 🏷️ Likely Rental
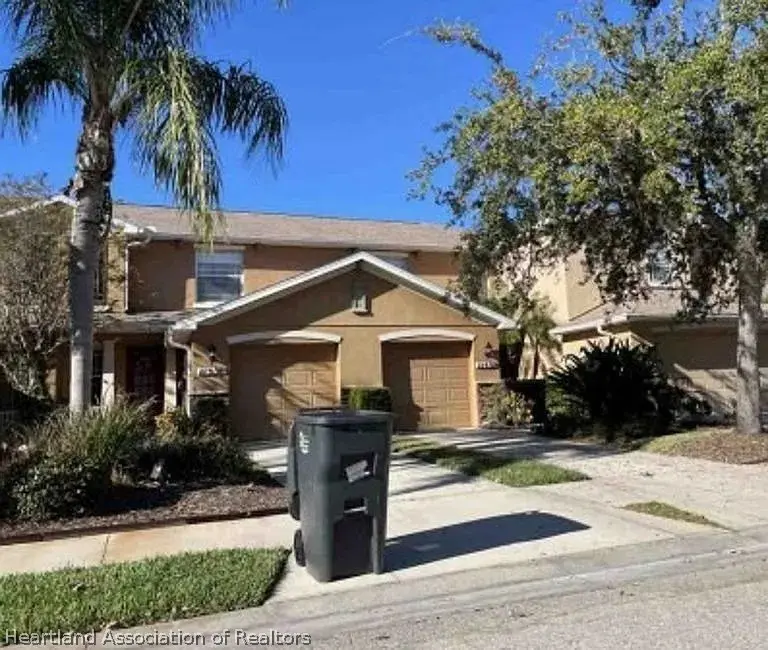
11532 52nd Ct E · Bradenton, FL
Flood risk 1/10 · Minimal
- FEMA flood zone
- X (unshaded)
- Chance of flooding over 30 yrs
- 0.0%
- Est. flood insurance / yr
- $507 – $1,088
Fire risk 3/10 · Minor
- Est. fire insurance / yr
- $947 – $1,759
Heat risk 10/10 · Severe
- Hot days now (above 107°F)
- 7 days/yr
- Hot days in 30 yrs
- 26 days/yr
Wind risk 10/10 · Severe
- Chance of severe wind over 30 yrs
- 99.0%
Air-quality risk 3/10 · Minor
- Unhealthy air days now
- 3 days/yr
- Unhealthy air days in 30 yrs
- 3 days/yr
Risk factors via First Street. Map © Google.
Why this score? — see what drove the D+ grade
The composite is a weighted blend of 9 inputs, each scored 0–100. Each bar is that input's sub-score; the figure is the points it added to the 100-point composite (weight × sub-score).
- Cash flow +15.0/30.0
- ARV discount +7.5/15.0
- 1% rule +5.0/10.0
- DSCR +5.0/10.0
- Schools +4.4/10.0
- Livability +4.0/5.0
- Condition / age +2.5/5.0
- Rent growth +2.3/5.0
- Appreciation +0.0/10.0
$5,000
🖨 Deal sheet 📄 Offer letter ✓ Due diligence
Listing remarks MLS
2 bedroom 2.5 bathrooms townhome with open floor plan. Features kitchen with Corian countertops and wood cabinets. First floor has ceramic tile throughout, crown molding and oversized sliding to enclosed lanai. The second story bedrooms each have fill baths and walk-in closets. Community pool, playground, and walking trails are part of this wonderful subdivision.
Key facts
- 2,178 sq ft lot
- Garage
- Built 2005
Property features AI
Exterior
- Parking: Detached garage (1 car)
- Utilities: Other water source; Other sewer
- Home design: Single-family home; One level; PDR zoning
- Construction: Construction materials: See remarks
- Exterior features: Front porch; Other roof
Interior
- Bedrooms: Total rooms: 1
- Flooring: Other
- Bathrooms: 2 full bathrooms; 1 half bathroom
- Heating & cooling: No heating; No cooling
- Interior features: Front porch; Other flooring
Neighborhood map
What this means for you Summary
Snapshot
- This is a 2-bed/2.5-bath single-family listed at $5k.
Deal economics
- At list price, monthly cash flow is $2k ($24k/yr) — positive.
- The deal already cash-flows at list — no discount required.
- Meets the 1% rule at list price ($3k rent vs $5k).
- Cap rate 482.1% vs local median 3.6% in Bradenton — top-decile yield for the area; either an underpriced asset or a hidden risk that comps aren't pricing in. Stress-test before assuming the spread holds.
Location & tenants
- Location reads 81/100 on livability (#101 in FL, #1,528 nationally) — a professional / high-income tenant draw. Strengths: commute A+, cost of living A+, housing A+; Watch: employment D+, crime D, amenities F.
- Manatee (suburban): math 54% / reading 50% proficiency, ranked #26 of 73 in FL (top 36%) — acceptable for families but not a draw, mixed tenant base, ~2y average lease.
- Market conditions: Rents soft (-0.9%/yr); 2170 active listings in the ZIP; 8 comparable units currently listed for rent nearby; rentals leasing fast (median 12d on market — plan ~1-2 weeks tenant-placement turnaround); high-income renter base; 7,472 units permitted in Manatee County in 2024 (1,782 in 5+ unit buildings).
Forward outlook
- Local home prices are declining (-3.0%/yr); year-one equity from $35 of loan paydown is wiped out by about $150 of value loss. Plan a longer hold.
- Manatee County population projected at +43% by 2050 — long-run rental-demand tailwind backs the buy-and-hold thesis.
- At projected returns (-3.0% appreciation + 0.0% rent growth), your $1k cash investment doubles in ~1 year — after that, you're playing with house money.
Negotiation context
- Only 8 days on market — expect competitive offers; lowballing is unlikely to land.
- 6 sale attempts since 22y ago with the ask held roughly flat each time — persistent listings suggest the price (not the market) is what's stuck; bring a comps-based counter.
Risks & watch-outs
- Climate carrying-cost: severe wind risk, 99% chance of damaging wind over 30y; extreme-heat days projected 7→26/yr by 2055 (HVAC capex compounding) — expect insurance premiums to compound above CPI over the hold.
Questions for the listing agent
- Is there a deadline driving the sale (1031 exchange, divorce, estate, relocation)? That informs how much negotiation room exists.
- Crime grade is D in this area — have there been break-ins, vandalism, or insurance claims at this property in the last 3 years? What carrier currently insures it and at what premium?
- The area grade is low — what's the realistic commute time and amenity access for the typical tenant pool here? Any planned neighborhood developments (good or bad) we should know about?
- What's the average days-on-market for RENTAL listings here right now (not sales)? A rising rental-DOM trend means longer vacancies and softer asking-rent achievability than the comps imply.
- What's the recent tenant-quality profile in this submarket — average credit score on applications, eviction rate, late-payment / NSF rate, and stable-employment percentage? A property-management company in the area should have these aggregated.
- How much new for-sale + rental construction is in the pipeline within 1–3 miles? Heavy new supply typically softens prices + rents 12–24 months out; constrained supply supports both.
Investment metrics
- 1% rule
- 51.06% ✓
- Cap rate
- 482.09%
- Cash-on-cash
- 1699.26%
- DSCR
- 76.61
- GRM
- 0.2
CMA / ARV
- ARV (on-the-fly)
- $308,740
- Comps found
- 12
Show comp detail 12 sales within ~0.75 mi
| Address | Dist | Beds/Ba | Sqft | Sold | Price | $/sf | Match |
|---|---|---|---|---|---|---|---|
| 4540 Deep Creek Ter | 0.62mi | 2/2.0 | 1,439 (+0%) | 1mo | $280,000 | $195 | 68 |
| 11705 Crawford Parrish Ln | 0.47mi | 2/2.5 | 1,480 (+3%) | 8mo | $299,000 | $202 | 66 |
| 4532 Deep Creek Ter | 0.63mi | 2/2.0 | 1,439 (+0%) | 3mo | $290,000 | $202 | 66 |
| 4710 Forest Creek Trl | 0.55mi | 2/2.5 | 1,480 (+3%) | 7mo | $293,000 | $198 | 63 |
| 4608 Oliver Manor Dr | 0.49mi | 3/2.0 (+1) | 1,581 (+10%) | 5mo | $370,000 | $234 | 50 |
| 6230 114th Ave E | 0.62mi | 3/2.0 (+1) | 1,515 (+6%) | 7mo | $325,000 | $215 | 49 |
| 11822 Crawford Parrish Ln | 0.57mi | 3/2.0 (+1) | 1,523 (+6%) | 9mo | $320,000 | $210 | 49 |
| 11813 Crawford Parrish Ln | 0.56mi | 2/2.0 | 1,299 (-10%) | 9mo | $294,000 | $226 | 48 |
| 11836 Crawford Parrish Ln | 0.60mi | 3/2.0 (+1) | 1,515 (+6%) | 12mo | $340,000 | $224 | 46 |
| 4318 Deep Creek Ter | 0.75mi | 3/2.0 (+1) | 1,495 (+4%) | 9mo | $330,000 | $221 | 44 |
| 4326 Forest Creek Trl | 0.68mi | 3/2.0 (+1) | 1,582 (+10%) | 3mo | $305,000 | $193 | 42 |
| 11843 Fennemore Way | 0.68mi | 2/2.0 | 1,293 (-10%) | 13mo | $285,000 | $220 | 39 |
Match score weights: distance 35% · size 25% · config 20% · recency 20%. Top-matched comps best support the ARV.
Projected returns pro-forma
-3.0% appreciation · 0.0% rent growth · sell at horizon
- IRR
- —
- Equity multiple
- 85.29×
- Total profit
- $118,011
- Equity at exit
- $746
- IRR
- —
- Equity multiple
- 169.99×
- Total profit
- $236,588
- Equity at exit
- $432
Cash invested: $1,400 (down + closing). Projections, not guarantees.
Landlord ↔ Tenant lean methodology
- Overall (STATE)
- 87 Strongly Landlord-Friendly
- State Florida
- 87 Strongly Landlord-Friendly · R+3
- County
- — inherits STATE
- City
- — inherits STATE
ZIP-level market 34219
- Home prices YoY
- -23.7%
- Rents YoY
- -0.9%
- Active inventory
- 2170
- Price-to-rent
- 0.2×
Monthly cashflow live
- Estimated rent
- $2,553 high interval (Pro) →
- Mortgage (P&I)
- −$26
- Tax est. 1.5%
- −$6 /mo · $75/yr
- Insurance
- −$2
- HOA
- −$0
- Vacancy / Maint / Mgmt
- −$536
- Net cashflow
- $1,982
Break-even live
UW: 25.0% down · 7.5% · 30yr · 1.5% tax · 5.0% vac · 8.0% maint · 8.0% mgmt
Financing live
Cash to close
- Down payment
- $1,250
- Closing costs
- $150
- Reserves months
- —
- Total cash needed
- —
Loan-product check · same deal, 3 products live
Conventional
25% down · 7.5% · 30yr
- Down + closing
- —
- Monthly P&I
- —
- Monthly cashflow
- —
- DSCR
- —
- Eligible?
- —
Personal DTI + credit; lowest rate.
DSCR
20% down · 8.5% · 30yr
- Down + closing
- —
- Monthly P&I
- —
- Monthly cashflow
- —
- DSCR
- —
- Eligible?
- —
No personal income docs; deal must DSCR.
Hard money
10% down · 12.0% · 12mo
- Down + closing
- —
- Monthly P&I
- —
- Monthly cashflow
- —
- DSCR
- —
- Eligible?
- —
Short-term bridge; refi at stabilization.
Rent comps 8 comps
| Address | Beds | Baths | Sqft | Rent | $/sqft | DOM | Units | Dist |
|---|---|---|---|---|---|---|---|---|
| 11639 Old Florida Ln Parrish, FL | 3.0 | 2.5 | 1692 | $2,350 | $1.39 | 20d | 1 | 0.34mi |
| 11835 Crawford Parrish Ln Parrish, FL | 2.0 | 2.0 | 1156 | $2,800 | $2.42 | 23d | 1 | 0.60mi |
| 11106 Sand Pine Ln Parrish, FL | 3.0 | 2.0 | 1766 | $2,579 | $1.46 | 3d | 1 | 0.80mi |
| 10508 55th Ct E Parrish, FL | 3.0 | 2.0 | 1447 | $3,000 | $2.07 | 23d | 1 | 0.91mi |
| 4213 Berkeley Dr Parrish, FL | 3.0 | 2.0 | 1749 | $2,485 | $1.42 | 2d | 1 | 0.95mi |
| 10610 Eddy Cir Parrish, FL | 1.0–3.0 | 1.0–2.0 | 1082 | $2,095 | $1.94 | 2d | 89 | 0.99mi |
| 9922 52nd St E Parrish, FL | 3.0 | 2.0 | 1270 | $2,250 | $1.77 | 3d | 1 | 1.30mi |
| 3511 Wild Blossom Pl Parrish, FL | 3.0 | 2.0 | 1692 | $2,500 | $1.48 | 12d | 1 | 1.49mi |
Listing history 7 events
-
2026-06-17days on market $5,000 Active 8 DOM
-
2026-06-16days on market $5,000 Active 7 DOM
-
2026-06-15days on market $5,000 Active 6 DOM
-
2026-06-13days on market $5,000 Active 4 DOM
-
2026-06-13days on market $5,000 Active 3 DOM
-
2026-06-10remarks 297-char remark
-
2026-06-10$5,000 Active 1 DOM
ⓘ Source: listings_history table (triggers on properties + properties_extension) + one-shot
backfill from property_details.listing_events for pre-trigger history.
Climate risk First Street
- Flood 1/10 Low FEMA zone X (unshaded) · 0% chance over 30 yrs
- Wildfire 3/10 Moderate
- Heat 10/10 Extreme 7 d/yr ≥107°F today · 26 d/yr by 30 yrs out
- Wind 10/10 Extreme 99% chance of damaging wind over 30 yrs
- Air quality 3/10 Moderate 3 unhealthy d/yr today · 3 by 30 yrs out
Nearby sold comps map
Loading sold comps map…
Walkable amenities ~0.75 mi
Loading nearby amenities…
Taxation est. · year 1
- Rental income
- $30,638
- − Mortgage interest
- −$280
- − Property taxes
- −$75
- − Insurance
- −$25
- − Repairs & maintenance
- −$2,451
- − Management
- −$2,451
- − Depreciation
- −$145
- Taxable income
- $25,211
- Est. tax owed @ 24.0%
- −$6,051
- After-tax cash flow
- $17,739/yr
For passive investors: Depreciation is non-cash, so a rental often shows a tax loss while cash-flowing — sheltering income. Rental losses are passive: they offset passive income freely, and up to $25,000/yr can offset ordinary (W-2) income if you actively participate and your MAGI is under $100k (phasing out to $0 by $150k); unused losses carry forward. On sale, claimed depreciation is recaptured at up to 25%, and gains may owe capital-gains tax (a 1031 exchange can defer both). Figures are a year-1 estimate at your 24.0% rate — not tax advice; consult a CPA.
Schools (NCES district)
- District
- Manatee
- NCES district ID
- 1201230
- Math proficiency
- 54% ▼ -6.00%
- Reading proficiency
- 50% ▼ -2.00%
- Median HH income
- $49,607
- Composite
- 44.43/100
- National rank
- #2806
- State rank
- #26 of 73 in FL
Livability — Bradenton
- Score
- 81/100
- State rank
- #101
- US rank
- #1528
Category grades
Schools grade is shown separately in the Schools card above.
Census & demographics
- County
- Manatee County · 416,364 people
- City population
- 52,177
- Metro
- North Port-Sarasota-Bradenton, FL
- Population (ZIP)
- 33,296
- Household income
- $113,773
- Rent vs Own
- Severe rent burden
- 219.0
Population outlook (Manatee County) Hauer SSP2
- Today (2025)
- 447,342 people
- By 2030
- 488,911 · +9.3%
- By 2040
- 567,934 · +27.0%
- By 2050
- 637,995 · +42.6%
- By 2075
- 781,970 · +74.8%
- By 2100
- 848,272 · +89.6%
Race, ethnicity, and origin ACS 2023
- Neighborhood character
- Predominantly White (75%)
- Race & ethnicity
- White 75% Hispanic / Latino 11% Two or more races 8% Black 8% Asian 2%
- Hispanic origin (detail)
- Mexican 2% Puerto Rican 3%
- Common ancestry
- Romanian 4% Hispanic 2% Russian 2%
- Foreign-born
- 10% · Canada, Dominican Republic, Jamaica
- Languages at home
- 88% English-only · Spanish 7% French/Haitian/Cajun 2% Other Asian/Pacific 1%
Political lean MEDSL · Manatee
- 2024 margin
- Strong R (+23.5) · D 37.9% · R 61.4%
- 2008→2024 swing
- -16.5pp toward R · 2008: -7.0pp · 2024: -23.5pp
- All cycles
- 2024: R+23.5 2020: R+16.1 2016: R+17.1 2012: R+12.5 2008: R+7.0
Not yet ingested
- Civics
- —
Market trends
- HPI YoY
- ▼ -84.45%
- Current HPI
- 271.7131
- Rent YoY
- ▼ -0.95%
- Metro
- North Port-Sarasota-Bradenton, FL
- State GDP YoY
- ▲ 3.28%
- F500 in state
- 36
Industry mix (Fortune 500 HQ in FL)
| Industry | F500 HQs | Revenue |
|---|---|---|
| Industrial Technology | 2 | $29B |
|
||
| Insurance | 2 | $17B |
|
||
| Retail | 1 | $60B |
|
||
| Technology Distribution | 1 | $58B |
|
||
| Homebuilding | 1 | $35B |
|
||
| Technology Manufacturing | 1 | $35B |
|
||
Price history
-97.5% since first listed17 events — show timeline
- 2026-06-09 Listed $5,000 HAOR as distributed by MLS GRID
- 2020-01-24 Sold (Public Records) $199,000 Public Records
- 2020-01-23 Sold (MLS) $199,000 Stellar MLS as Distributed by MLS Grid
- 2019-12-10 Pending — Stellar MLS as Distributed by MLS Grid
- 2019-11-11 Price Changed $199,000 Stellar MLS as Distributed by MLS Grid
- 2019-10-02 Listed $209,900 Stellar MLS as Distributed by MLS Grid
- 2015-03-26 Sold (Public Records) $145,000 Public Records
- 2015-03-20 Sold (MLS) $145,000 Stellar MLS as Distributed by MLS Grid
- 2015-02-22 Pending — Stellar MLS as Distributed by MLS Grid
- 2014-11-14 Listed $149,900 Stellar MLS as Distributed by MLS Grid
- 2013-08-16 Sold (MLS) $126,500 Stellar MLS as Distributed by MLS Grid
- 2013-06-06 Listed $129,900 Stellar MLS as Distributed by MLS Grid
- 2012-02-06 Listing Removed — Stellar MLS as Distributed by MLS Grid
- 2011-06-14 Listed $97,000 Stellar MLS as Distributed by MLS Grid
- 2005-10-27 Sold (MLS) $197,900 Stellar MLS as Distributed by MLS Grid
- 2004-11-04 Sold (Public Records) $460,900 Public Records
- 2004-10-21 Listed $200,575 Stellar MLS as Distributed by MLS Grid
Property tax history
+6.1%/yrLatest (2025): $4,100 · +59.8% YoY. Source: county tax records.
Cash-flow waterfall
monthlySold comps — $/sqft
last 12 mo · ≤1 miLoading sold comps…