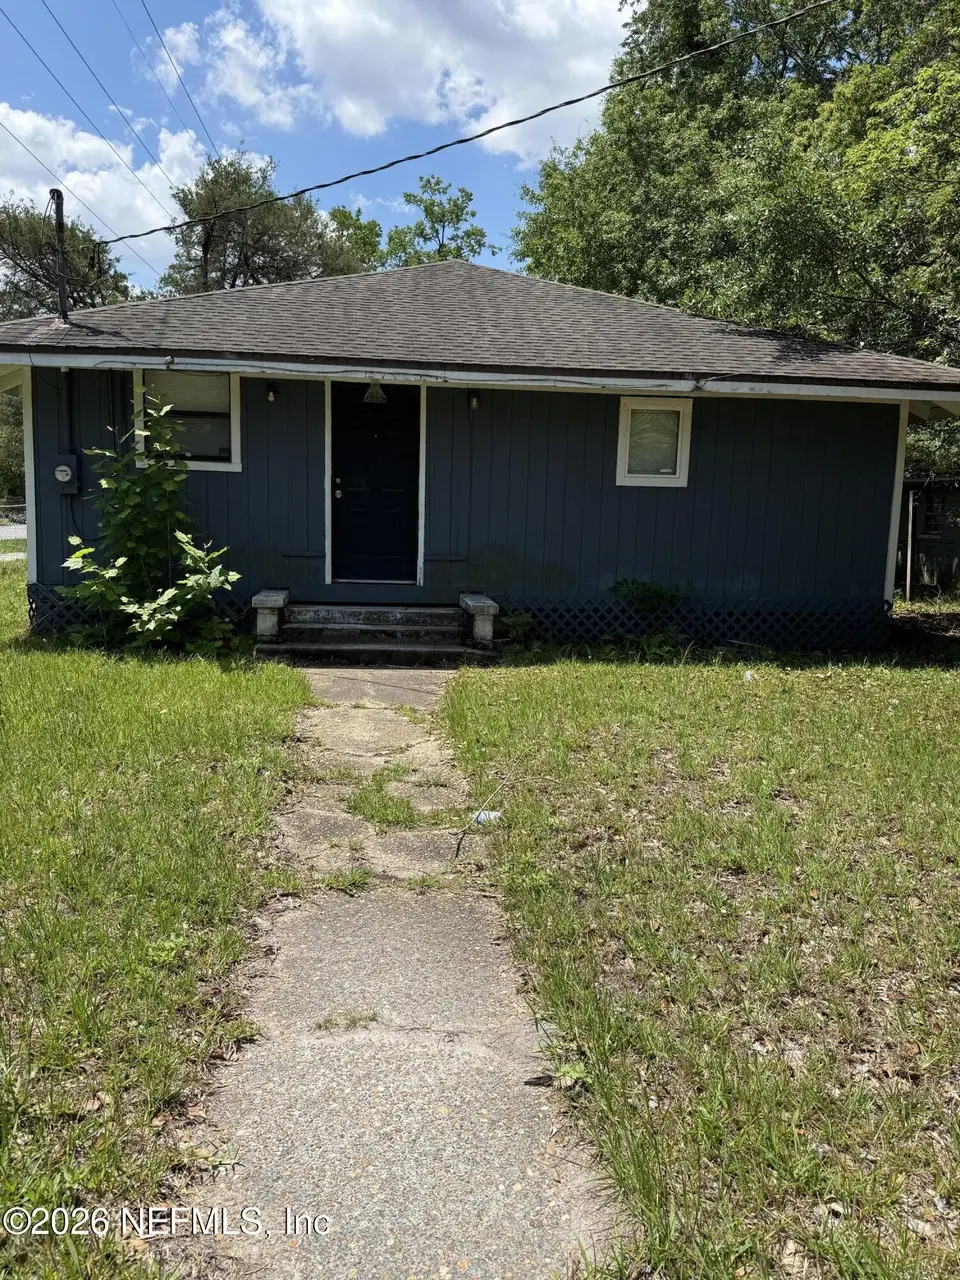
3004 W 16th St · Jacksonville, FL
Flood risk 1/10 · Minimal
- FEMA flood zone
- X (unshaded)
- Chance of flooding over 30 yrs
- 0.0%
- Est. flood insurance / yr
- $507 – $1,088
Fire risk 2/10 · Minimal
- Est. fire insurance / yr
- $947 – $1,759
Heat risk 9/10 · Severe
- Hot days now (above 107°F)
- 7 days/yr
- Hot days in 30 yrs
- 20 days/yr
Wind risk 9/10 · Severe
- Chance of severe wind over 30 yrs
- 99.0%
Air-quality risk 4/10 · Minor
- Unhealthy air days now
- 6 days/yr
- Unhealthy air days in 30 yrs
- 6 days/yr
Risk factors via First Street. Map © Google.
Why this score? — see what drove the C+ grade
The composite is a weighted blend of 9 inputs, each scored 0–100. Each bar is that input's sub-score; the figure is the points it added to the 100-point composite (weight × sub-score).
- Cash flow +16.9/30.0
- ARV discount +15.0/15.0
- Appreciation +6.7/10.0
- DSCR +5.2/10.0
- 1% rule +4.4/10.0
- Livability +4.2/5.0
- Schools +3.9/10.0
- Rent growth +2.9/5.0
- Condition / age +2.5/5.0
$150,000
🖨 Deal sheet 📄 Offer letter ✓ Due diligence
Listing remarks MLS
This 3 bedroom 2 full bath home has over 1400 square feet of living space! Come and check out the Hardwood Floors, Formal Dining Room, and Inside Laundry Connections. Master Bedroom features 2 Closets and a Connecting Bathroom with a Stand Up Shower. The Kitchen has lots of Cabinet Space and a PANTRY! The Fenced In Yard is a Plus, and you will also have a Large Storage Shed to Use!
Key facts
- Pantry
- Connecting bathroom
- Cabinet space
Tags
Property features AI
Exterior
- Parking: Additional off-street parking
- Utilities: Public sewer; Water available; Electricity available; Cable available
- Home design: Single-family residence; One level
- Exterior features: Lot of approximately 0.15 acres; No private pool
Interior
- Kitchen: Appliances included (unspecified)
- Bedrooms: 3 bedrooms
- Bathrooms: 3 full bathrooms
- Heating & cooling: Central heating (electric); Central air conditioning (electric)
- Interior features: Includes unspecified built-in appliances
Neighborhood map
What this means for you Summary
Snapshot
- This is a 3-bed/1.0-bath single-family listed at $150k.
Deal economics
- At list price, monthly cash flow is $98 ($1k/yr) — positive.
- The deal already cash-flows at list — no discount required.
- To meet the 1% rule (rent ≥ 1% of price), the offer needs to be $142k (5.6% below list).
- Recommended offer: $142k (5.6% below list) — sets the bar for 1% rule.
- Cap rate 7.1% vs local median 4.0% in Jacksonville — top-decile yield for the area; either an underpriced asset or a hidden risk that comps aren't pricing in. Stress-test before assuming the spread holds.
Location & tenants
- Location reads 83/100 on livability (#50 in FL, #911 nationally) — a professional / high-income tenant draw. Strengths: amenities A+, commute A+, housing A+.
- Duval (urban): math 46% / reading 45% proficiency, ranked #48 of 73 in FL (top 66%) — families likely to look elsewhere, expect single-tenant / working-renter base with shorter leases.
- Market conditions: Rents rising (+1.7%/yr); 172 active listings in the ZIP; 40 comparable units currently listed for rent nearby; rentals at typical pace (median 17d on market — plan ~3-4 weeks tenant-placement turnaround); lower-income renter base — watch delinquency; 6,503 units permitted in Duval County in 2024 (1,131 in 5+ unit buildings).
Forward outlook
- In year one you build about $6k of equity ($1k loan paydown + $5k appreciation (3.4% local appreciation)).
- Duval County population projected at +19% by 2050 — long-run rental-demand tailwind backs the buy-and-hold thesis.
- At projected returns (3.4% appreciation + 1.7% rent growth), your $42k cash investment doubles in ~6 years — after that, you're playing with house money.
- By year 6, paydown + projected appreciation supports a ~$33k cash-out refi (75% LTV) — recoverable capital for the next deal without selling this one.
Negotiation context
- It's been on market 21 days — a 2% lower offer ($148k) is reasonable based on typical stale-listing flexibility.
- 4 sale attempts since 14y ago with the ask held roughly flat each time — persistent listings suggest the price (not the market) is what's stuck; bring a comps-based counter.
- Current owner paid $72k; list at $150k implies a 108% gain — meaningful room to come down on a strong offer.
Risks & watch-outs
- Watch-outs: built in 1944 — expect roof / HVAC / electrical / plumbing capex.
- Climate carrying-cost: severe wind risk, 99% chance of damaging wind over 30y; extreme-heat days projected 7→20/yr by 2055 (HVAC capex compounding) — expect insurance premiums to compound above CPI over the hold.
Questions for the listing agent
- Built in 1944 — when were the roof, HVAC, electrical panel, plumbing, and water heater last replaced?
- Is there a deadline driving the sale (1031 exchange, divorce, estate, relocation)? That informs how much negotiation room exists.
- Schools are B-rated — typically a magnet for longer-tenancy family renters. What's the average tenant stay here, and is there a school-zone premium baked into asking?
- What's the average days-on-market for RENTAL listings here right now (not sales)? A rising rental-DOM trend means longer vacancies and softer asking-rent achievability than the comps imply.
- What's the recent tenant-quality profile in this submarket — average credit score on applications, eviction rate, late-payment / NSF rate, and stable-employment percentage? A property-management company in the area should have these aggregated.
- How much new for-sale + rental construction is in the pipeline within 1–3 miles? Heavy new supply typically softens prices + rents 12–24 months out; constrained supply supports both.
Investment metrics
- 1% rule
- 0.94% ✗
- Cap rate
- 7.08%
- Cash-on-cash
- 2.81%
- DSCR
- 1.12
- GRM
- 8.8
CMA / ARV
- ARV (on-the-fly)
- $190,736
- Comps found
- 10
Show comp detail 10 sales within ~0.75 mi
| Address | Dist | Beds/Ba | Sqft | Sold | Price | $/sf | Match |
|---|---|---|---|---|---|---|---|
| 2922 W 11th St | 0.29mi | 3/1.0 | 1,530 (+5%) | 2mo | $150,000 | $98 | 76 |
| 2935 W 10th St | 0.32mi | 4/2.0 (+1) | 1,458 (+0%) | 8mo | $196,000 | $134 | 69 |
| 1331 Dena St | 0.70mi | 2/2.0 (-1) | 1,440 (-1%) | 1mo | $50,125 | $35 | 56 |
| 2560 Robert St | 0.75mi | 3/1.5 | 1,518 (+4%) | 2mo | $61,000 | $40 | 54 |
| 2848 W 11th St | 0.34mi | 3/2.0 | 1,300 (-11%) | 13mo | $224,700 | $173 | 52 |
| 3075 W 19th St | 0.18mi | 4/2.0 (+1) | 1,640 (+13%) | 13mo | $285,000 | $174 | 51 |
| 1937 Allandale Cir S | 0.37mi | 3/2.0 | 1,282 (-12%) | 16mo | $160,000 | $125 | 46 |
| 1932 Detroit St | 0.33mi | 3/2.0 | 1,313 (-10%) | 23mo | $244,900 | $187 | 45 |
| 2693 W 23rd St | 0.64mi | 3/1.5 | 1,340 (-8%) | 15mo | $85,000 | $63 | 42 |
| 2917 W 8th St | 0.45mi | 4/1.5 (+1) | 1,268 (-13%) | 23mo | $165,500 | $131 | 31 |
Match score weights: distance 35% · size 25% · config 20% · recency 20%. Top-matched comps best support the ARV.
Projected returns pro-forma
3.41% appreciation · 1.7% rent growth · sell at horizon
- IRR
- 10.6%
- Equity multiple
- 1.61×
- Total profit
- $25,814
- Equity at exit
- $70,960
- IRR
- 12.0%
- Equity multiple
- 2.83×
- Total profit
- $76,747
- Equity at exit
- $112,172
Cash invested: $42,000 (down + closing). Projections, not guarantees.
Landlord ↔ Tenant lean methodology
- Overall (STATE)
- 87 Strongly Landlord-Friendly
- State Florida
- 87 Strongly Landlord-Friendly · R+3
- County
- — inherits STATE
- City
- — inherits STATE
ZIP-level market 32254
- Home prices YoY
- 1.2%
- Rents YoY
- 1.7%
- Active inventory
- 172
- Price-to-rent
- 8.8×
Monthly cashflow live
- Estimated rent
- $1,417 high interval (Pro) →
- Mortgage (P&I)
- −$787
- Tax from tax record
- −$172 /mo · $2,061/yr
- Insurance
- −$62
- HOA
- −$0
- Vacancy / Maint / Mgmt
- −$298
- Net cashflow
- $98
Break-even live
UW: 25.0% down · 7.5% · 30yr · 1.5% tax · 5.0% vac · 8.0% maint · 8.0% mgmt
Financing live
Cash to close
- Down payment
- $37,500
- Closing costs
- $4,500
- Reserves months
- —
- Total cash needed
- —
Loan-product check · same deal, 3 products live
Conventional
25% down · 7.5% · 30yr
- Down + closing
- —
- Monthly P&I
- —
- Monthly cashflow
- —
- DSCR
- —
- Eligible?
- —
Personal DTI + credit; lowest rate.
DSCR
20% down · 8.5% · 30yr
- Down + closing
- —
- Monthly P&I
- —
- Monthly cashflow
- —
- DSCR
- —
- Eligible?
- —
No personal income docs; deal must DSCR.
Hard money
10% down · 12.0% · 12mo
- Down + closing
- —
- Monthly P&I
- —
- Monthly cashflow
- —
- DSCR
- —
- Eligible?
- —
Short-term bridge; refi at stabilization.
Rent comps 40 comps
| Address | Beds | Baths | Sqft | Rent | $/sqft | DOM | Units | Dist |
|---|---|---|---|---|---|---|---|---|
| 3004 W 16th St Unit 1 Jacksonville, FL | 3.0 | 2.0 | 1456 | $1,526 | $1.05 | 23d | 1 | 0.02mi |
| 3078 W 15th St Jacksonville, FL | 3.0 | 1.0 | 1128 | $1,200 | $1.06 | 23d | 1 | 0.11mi |
| 2939 W 11th St Jacksonville, FL | 3.0 | 1.0 | 1086 | $1,295 | $1.19 | 23d | 1 | 0.26mi |
| 2854 Wickwire St Jacksonville, FL | 2.0 | 1.0 | 948 | $1,300 | $1.37 | 3d | 1 | 0.29mi |
| 1612 Alfen St Jacksonville, FL | 3.0 | 1.5 | 945 | $1,113 | $1.18 | 7d | 1 | 0.55mi |
| 2939 W 6th St Jacksonville, FL | 3.0 | 2.0 | 1269 | $1,225 | $0.97 | 1d | 1 | 0.56mi |
| 2902 W 5th St Jacksonville, FL | 3.0 | 2.0 | 1379 | $1,050 | $0.76 | 7d | 1 | 0.66mi |
| 2965 Sunset St Jacksonville, FL | 3.0 | 2.0 | 1056 | $1,375 | $1.30 | 3d | 1 | 0.67mi |
| 2965 Sunset St Jacksonville, FL | 3.0 | 1.5 | 1056 | $1,375 | $1.30 | 7d | 1 | 0.67mi |
| 2693 W 25th St Jacksonville, FL | 3.0 | 1.5 | 1300 | $1,450 | $1.12 | 23d | 1 | 0.72mi |
| 2661 W 25th St Jacksonville, FL | 4.0 | 2.0 | 1031 | $1,350 | $1.31 | 23d | 1 | 0.77mi |
| 1227 Dena St Jacksonville, FL | 3.0 | 1.0 | 1033 | $1,325 | $1.28 | 23d | 1 | 0.78mi |
| 1305 Melson Ave Jacksonville, FL | 3.0 | 2.0 | 1224 | $1,399 | $1.14 | 20d | 1 | 0.80mi |
| 3055 2nd Street Cir Jacksonville, FL | 3.0 | 1.5 | 1050 | $1,340 | $1.28 | 17d | 1 | 0.82mi |
| 3034 Detroit Cir E Jacksonville, FL | 3.0 | 2.0 | 1300 | $1,399 | $1.08 | 23d | 1 | 0.95mi |
| 5141 Shenandoah Ave Jacksonville, FL | 1.0–3.0 | 1.0–2.0 | 950 | $1,200 | $1.26 | 1d | 4 | 0.99mi |
| 5239 Potomac Ave Jacksonville, FL | 3.0 | 2.0 | 1392 | $1,432 | $1.03 | 7d | 1 | 0.99mi |
| 1037 Detroit St Jacksonville, FL | 3.0 | 2.0 | 912 | $1,250 | $1.37 | 1d | 1 | 1.06mi |
| 2344 W 18th St Jacksonville, FL | 3.0 | 1.5 | 1129 | $1,425 | $1.26 | 14d | 1 | 1.07mi |
| 2345 W 15th St Jacksonville, FL | 3.0 | 2.0 | 1112 | $1,400 | $1.26 | 23d | 1 | 1.08mi |
| 1021 Woodstock Ave Jacksonville, FL | 3.0 | 2.0 | 1012 | $1,495 | $1.48 | 7d | 1 | 1.11mi |
| 1021 Woodstock Ave Jacksonville, FL | 3.0 | 2.0 | 1012 | $1,495 | $1.48 | 23d | 1 | 1.11mi |
| 5247 Cleveland Rd Jacksonville, FL | 4.0 | 2.0 | 1850 | $1,775 | $0.96 | 14d | 1 | 1.19mi |
| 3516 Penton St Jacksonville, FL | 3.0 | 1.0 | 1000 | $1,350 | $1.35 | 23d | 1 | 1.19mi |
| 2319 Almeda St Jacksonville, FL | 3.0 | 1.0 | 1200 | $1,078 | $0.90 | 1d | 1 | 1.24mi |
| 912 Huron St Jacksonville, FL | 2.0 | 1.0 | 900 | $1,100 | $1.22 | 14d | 1 | 1.27mi |
| 5227 Bunche Dr Jacksonville, FL | 3.0 | 2.0 | 1174 | $1,450 | $1.24 | 23d | 1 | 1.29mi |
| 3368 Columbus Ave Jacksonville, FL | 2.0 | 1.0 | 955 | $1,300 | $1.36 | 4d | 1 | 1.30mi |
| 1213 Moat St Jacksonville, FL | 2.0 | 2.5 | 1022 | $1,283 | $1.26 | 17d | 1 | 1.31mi |
| 2415 N Canal St Jacksonville, FL | 4.0 | 2.0 | 1572 | $1,475 | $0.94 | 19d | 1 | 1.32mi |
| 2169 W 14th St Jacksonville, FL | 3.0 | 1.0 | 972 | $1,200 | $1.23 | 2d | 1 | 1.35mi |
| 3012 Imperial St Jacksonville, FL | 3.0 | 1.0 | 1089 | $1,395 | $1.28 | 23d | 1 | 1.35mi |
| 5428 Bunche Dr Jacksonville, FL | 3.0 | 1.0 | 900 | $1,600 | $1.78 | 23d | 1 | 1.37mi |
| 841 Ontario St Jacksonville, FL | 2.0 | 1.0 | 1000 | $1,285 | $1.28 | 23d | 1 | 1.37mi |
| 3362 Lowell Ave Jacksonville, FL | 3.0 | 2.0 | 1682 | $1,400 | $0.83 | 7d | 1 | 1.38mi |
| 2138 W 17th St Jacksonville, FL | 3.0 | 1.0 | 1158 | $1,425 | $1.23 | 4d | 1 | 1.40mi |
| 3303 Broadway Ave Jacksonville, FL | 3.0 | 2.0 | 1072 | $1,550 | $1.45 | 3d | 1 | 1.42mi |
| 5217 Mays Dr Jacksonville, FL | 3.0 | 1.0 | 900 | $1,250 | $1.39 | 7d | 1 | 1.43mi |
| 3450 Lowell Ave Jacksonville, FL | 3.0 | 2.0 | 1209 | $1,578 | $1.31 | 23d | 1 | 1.44mi |
| 5326 Mays Dr Jacksonville, FL | 3.0 | 1.0 | 900 | $1,200 | $1.33 | 23d | 1 | 1.45mi |
Listing history 27 events
-
2026-06-18days on market $150,000 Active 21 DOM
-
2026-06-17days on market $150,000 Active 20 DOM
-
2026-06-16days on market $150,000 Active 19 DOM
-
2026-06-15days on market $150,000 Active 18 DOM
-
2026-06-13days on market $150,000 Active 16 DOM
-
2026-06-13days on market $150,000 Active 15 DOM
-
2026-06-10days on market $150,000 Active 12 DOM
-
2026-06-08days on market $150,000 Active 11 DOM
-
2026-06-07days on market $150,000 Active 10 DOM
-
2026-06-05days on market $150,000 Active 7 DOM
-
2026-06-03days on market $150,000 Active 6 DOM
-
2026-06-02days on market $150,000 Active 5 DOM
-
2026-06-01days on market $150,000 Active 4 DOM
-
2026-05-31days on market $150,000 Active 3 DOM
-
2026-05-28$150,000 Active
-
2026-05-01historical $1,525
-
2026-05-01$1,525
-
2022-03-02soldstatus $72,000
-
2018-07-02soldstatus $55,000
-
2018-06-27soldstatus $55,000 Sold 384-char remark
Show marketing remark (384 chars)
This 3 bedroom 2 full bath home has over 1400 square feet of living space! Come and check out the Hardwood Floors, Formal Dining Room, and Inside Laundry Connections. Master Bedroom features 2 Closets and a Connecting Bathroom with a Stand Up Shower. The Kitchen has lots of Cabinet Space and a PANTRY! The Fenced In Yard is a Plus, and you will also have a Large Storage Shed to Use!
-
2018-05-10status Pending 384-char remark
Show marketing remark (384 chars)
This 3 bedroom 2 full bath home has over 1400 square feet of living space! Come and check out the Hardwood Floors, Formal Dining Room, and Inside Laundry Connections. Master Bedroom features 2 Closets and a Connecting Bathroom with a Stand Up Shower. The Kitchen has lots of Cabinet Space and a PANTRY! The Fenced In Yard is a Plus, and you will also have a Large Storage Shed to Use!
-
2018-02-07$60,000 Active 384-char remark
Show marketing remark (384 chars)
This 3 bedroom 2 full bath home has over 1400 square feet of living space! Come and check out the Hardwood Floors, Formal Dining Room, and Inside Laundry Connections. Master Bedroom features 2 Closets and a Connecting Bathroom with a Stand Up Shower. The Kitchen has lots of Cabinet Space and a PANTRY! The Fenced In Yard is a Plus, and you will also have a Large Storage Shed to Use!
-
2012-08-23soldstatus $19,900 445-char remark
Show marketing remark (445 chars)
Incredible Investment Opportunity!Unique home features 3 bedrooms, 2 baths,wood flooring thru out main areas add beauty to the space, log walls create cozy country feel with city convenience!Spacious living room,dining room,kitchen with breakfast bar is ideal.Large fenced yard & detached Shed are a plus!This is a Fannie Mae HomePath Property.Imagine the Possibilities as you explore this home. Invest in your future, Today-Now is the Time.
-
2012-06-28$18,500 445-char remark
Show marketing remark (445 chars)
Incredible Investment Opportunity!Unique home features 3 bedrooms, 2 baths,wood flooring thru out main areas add beauty to the space, log walls create cozy country feel with city convenience!Spacious living room,dining room,kitchen with breakfast bar is ideal.Large fenced yard & detached Shed are a plus!This is a Fannie Mae HomePath Property.Imagine the Possibilities as you explore this home. Invest in your future, Today-Now is the Time.
-
2000-10-17soldstatus $55,000
-
1994-04-05soldstatus $49,900
-
1993-06-18soldstatus $24,000
ⓘ Source: listings_history table (triggers on properties + properties_extension) + one-shot
backfill from property_details.listing_events for pre-trigger history.
Tax reassessment forecast FL · Resets to sale price
- Current annual tax
- $2,061 · $172/mo
- Projected year-2 tax
- $2,061 · $172/mo
- Expected delta
- $0/yr ($0/mo · 0.0%)
ⓘ Screening estimate from a state-policy table — verify with the county assessor before closing.
Climate risk First Street
- Flood 1/10 Low FEMA zone X (unshaded) · 0% chance over 30 yrs
- Wildfire 2/10 Low
- Heat 9/10 Extreme 7 d/yr ≥107°F today · 20 d/yr by 30 yrs out
- Wind 9/10 Extreme 99% chance of damaging wind over 30 yrs
- Air quality 4/10 Moderate 6 unhealthy d/yr today · 6 by 30 yrs out
Nearby sold comps map
Loading sold comps map…
Walkable amenities ~0.75 mi
Loading nearby amenities…
Taxation est. · year 1
- Rental income
- $17,000
- − Mortgage interest
- −$8,402
- − Property taxes
- −$2,061
- − Insurance
- −$750
- − Repairs & maintenance
- −$1,360
- − Management
- −$1,360
- − Depreciation
- −$4,364
- Taxable loss
- −$1,297
- Est. tax savings @ 24.0%
- +$311
- After-tax cash flow
- $1,491/yr
For passive investors: Depreciation is non-cash, so a rental often shows a tax loss while cash-flowing — sheltering income. Rental losses are passive: they offset passive income freely, and up to $25,000/yr can offset ordinary (W-2) income if you actively participate and your MAGI is under $100k (phasing out to $0 by $150k); unused losses carry forward. On sale, claimed depreciation is recaptured at up to 25%, and gains may owe capital-gains tax (a 1031 exchange can defer both). Figures are a year-1 estimate at your 24.0% rate — not tax advice; consult a CPA.
Schools (NCES district)
- District
- Duval
- NCES district ID
- 1200480
- Math proficiency
- 46% ▼ -11.00%
- Reading proficiency
- 45% ▼ -4.00%
- Median HH income
- $48,987
- Composite
- 38.97/100
- National rank
- #4076
- State rank
- #48 of 73 in FL
Livability — Jacksonville
- Score
- 83/100
- State rank
- #50
- US rank
- #911
Category grades
Schools grade is shown separately in the Schools card above.
Census & demographics
- Census place
- Jacksonville, FL
- County
- Duval County · 1,015,274 people
- City population
- 979,034
- Metro
- Jacksonville, FL
- Population (ZIP)
- 13,927
- Household income
- $34,953
- Rent vs Own
- Severe rent burden
- 882.0
Population outlook (Duval County) Hauer SSP2
- Today (2025)
- 1,013,010 people
- By 2030
- 1,059,228 · +4.6%
- By 2040
- 1,141,439 · +12.7%
- By 2050
- 1,205,258 · +19.0%
- By 2075
- 1,324,282 · +30.7%
- By 2100
- 1,319,620 · +30.3%
Race, ethnicity, and origin ACS 2023
- Neighborhood character
- Diverse neighborhood (Simpson 0.56)
- Race & ethnicity
- Black 60% White 28% Two or more races 7% Hispanic / Latino 5%
- Hispanic origin (detail)
- Puerto Rican 1%
- Common ancestry
- Slovak 1% Hispanic 1% Lithuanian 1%
- Foreign-born
- 4% · Canada
- Languages at home
- 94% English-only · Spanish 4% French/Haitian/Cajun 2%
Political lean MEDSL · Duval
- 2024 margin
- Toss-up / Even · D 48.7% · R 50.1% · Other 1.2%
- 2008→2024 swing
- +0.4pp no change · 2008: -1.9pp · 2024: -1.5pp
- All cycles
- 2024: R+1.5 2020: D+3.8 2016: R+1.5 2012: R+3.6 2008: R+1.9
Not yet ingested
- Civics
- —
Market trends
- HPI YoY
- ▲ 3.41%
- Current HPI
- 282.2981
- Rent YoY
- ▲ 1.70%
- Metro
- Jacksonville, FL
- State GDP YoY
- ▲ 3.28%
- F500 in state
- 36
Industry mix (Fortune 500 HQ in FL)
| Industry | F500 HQs | Revenue |
|---|---|---|
| Industrial Technology | 2 | $29B |
|
||
| Insurance | 2 | $17B |
|
||
| Retail | 1 | $60B |
|
||
| Technology Distribution | 1 | $58B |
|
||
| Homebuilding | 1 | $35B |
|
||
| Technology Manufacturing | 1 | $35B |
|
||
Price history
+525.0% since first listed13 events — show timeline
- 2026-05-28 Listed $150,000 realMLS
- 2026-05-01 Rental Removed $1,525 RENTALBEAST
- 2026-05-01 Listed for Rent $1,525 RENTALBEAST
- 2022-03-02 Sold (Public Records) $72,000 Public Records
- 2018-07-02 Sold (Public Records) $55,000 Public Records
- 2018-06-27 Sold (MLS) $55,000 realMLS
- 2018-05-10 Pending — realMLS
- 2018-02-07 Listed $60,000 realMLS
- 2012-08-23 Sold (MLS) $19,900 realMLS
- 2012-06-28 Listed $18,500 realMLS
- 2000-10-17 Sold (Public Records) $55,000 Public Records
- 1994-04-05 Sold (Public Records) $49,900 Public Records
- 1993-06-18 Sold (Public Records) $24,000 Public Records
Property tax history
+12.2%/yrLatest (2025): $2,061 · +17.3% YoY. Source: county tax records.
Cash-flow waterfall
monthlySold comps — $/sqft
last 12 mo · ≤1 miLoading sold comps…