622 Hummingbird Ln · Delray Beach, FL
Flood risk 4/10 · Minor
- FEMA flood zone
- X (unshaded)
- Chance of flooding over 30 yrs
- 0.22%
- Est. flood insurance / yr
- $507 – $1,088
Fire risk 1/10 · Minimal
- Est. fire insurance / yr
- $947 – $1,759
Heat risk 9/10 · Severe
- Hot days now (above 106°F)
- 7 days/yr
- Hot days in 30 yrs
- 26 days/yr
Wind risk 10/10 · Severe
- Chance of severe wind over 30 yrs
- 99.0%
Air-quality risk 2/10 · Minimal
- Unhealthy air days now
- 1 days/yr
- Unhealthy air days in 30 yrs
- 2 days/yr
Risk factors via First Street. Map © Google.
Why this score? — see what drove the C- grade
The composite is a weighted blend of 9 inputs, each scored 0–100. Each bar is that input's sub-score; the figure is the points it added to the 100-point composite (weight × sub-score).
- Cash flow +19.4/30.0
- ARV discount +7.5/15.0
- 1% rule +6.9/10.0
- DSCR +6.1/10.0
- Schools +4.3/10.0
- Livability +3.9/5.0
- Rent growth +3.0/5.0
- Condition / age +2.5/5.0
- Appreciation +0.0/10.0
$239,000
🖨 Deal sheet 📄 Offer letter ✓ Due diligence
Listing remarks
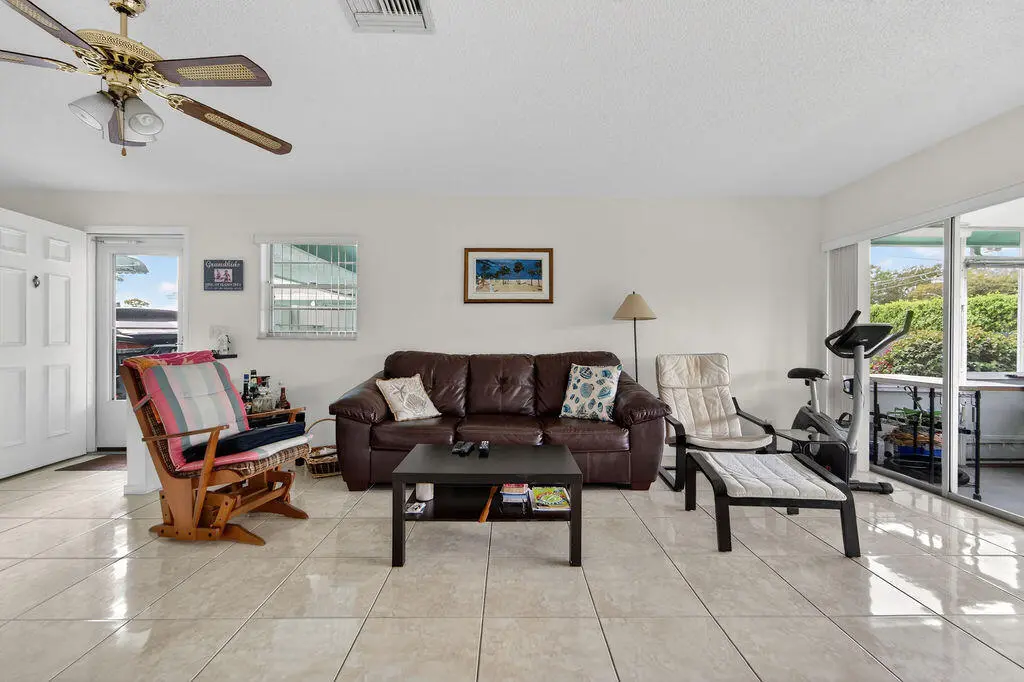
Beautifully maintained and thoughtfully updated villa offering comfort, convenience, and a relaxed lifestyle. This charming home features all-tile flooring throughout and is being sold fully furnished, making it truly move-in ready. Enjoy peace of mind with a roof that's approximately 10 years old and a brand-new A/C system. The property includes an attached carport for easy parking and added convenience. Step out back to a spacious screened porch—perfect for enjoying morning coffee or evening breezes in a private, tranquil setting. Located in a vibrant, active community with a wide range of amenities and social activities, this villa is ideal for those seeking both comfort and an eng
Key facts
- Attached carport
- All-tile flooring
- Screened porch
Tags
Property features AI
Finance
- Financial info: Pets allowed with restrictions (breed, number, and size limits)
- HOA & community: Part of Country Manors association; Monthly HOA fee of $371; Association amenities include pool, clubhouse, billiard room, shuffleboard court, community room, library, and street lights; HOA fee includes cable TV, grounds maintenance, sewer, water, common real estate tax, and recreation facility; Senior community
Exterior
- Parking: 2 total parking spaces; Attached carport with 1 covered space; 1 open parking space; Asphalt parking; Open/carport access
- Utilities: Public water; Public sewer; Cable available; Water and sewer available
- Home design: Villa (single-story, entry-level living); Faces northeast; Resale property
- Construction: CBS construction; Shingle roof; Built as one story
- Exterior features: Screened porch; Porch; Storage; Private road frontage; Asphalt road surface; No waterfront
Interior
- Kitchen: Electric range; Dishwasher; Microwave; Refrigerator; Electric water heater
- Bedrooms: 1 bedroom on the main level
- Flooring: Ceramic tile
- Bathrooms: 2 full bathrooms (1 on the main level)
- Heating & cooling: Central electric heating; Central air; Ceiling fan(s)
- Interior features: Walk-in closet(s); Furnished
- Laundry & utility: Laundry in carport; Laundry closet
Neighborhood map
What this means for you Summary
Snapshot
- This is a 2-bed/2.0-bath condo listed at $239k.
Deal economics
- At list price, monthly cash flow is $266 ($3k/yr) — positive.
- The deal already cash-flows at list — no discount required.
- Meets the 1% rule at list price ($3k rent vs $239k).
- Recommended offer: $217k (9.0% below list) — sets the bar for market timing.
- Cap rate 7.6% vs local median 4.3% in Delray Beach — top-decile yield for the area; either an underpriced asset or a hidden risk that comps aren't pricing in. Stress-test before assuming the spread holds.
Location & tenants
- Location reads 77/100 on livability (#202 in FL, #3,160 nationally) — a middle-class / working-renter tenant base. Strengths: housing A+, health & safety A+, commute A-; Watch: cost of living C-, crime D-, amenities F.
- Palm Beach (suburban): math 46% / reading 53% proficiency, ranked #34 of 73 in FL (top 47%) — families likely to look elsewhere, expect single-tenant / working-renter base with shorter leases.
- Market conditions: Rents rising (+1.8%/yr); 354 active listings in the ZIP; 40 comparable units currently listed for rent nearby; rentals at typical pace (median 24d on market — plan ~3-4 weeks tenant-placement turnaround); solid renter incomes; 3,974 units permitted in Palm Beach County in 2024 (1,012 in 5+ unit buildings).
- This rent runs 44% of the median local income ($78k/yr) — at the standard rent-burdened threshold; future hikes will face affordability resistance.
Forward outlook
- Local home prices are declining (-3.0%/yr); year-one equity from $2k of loan paydown is wiped out by about $7k of value loss. Plan a longer hold.
- Palm Beach County population projected at +30% by 2050 — long-run rental-demand tailwind backs the buy-and-hold thesis.
Negotiation context
- It's been on market 93 days — a 9% lower offer ($217k) is reasonable based on typical stale-listing flexibility.
- 5 sale attempts since 26y ago with the ask held roughly flat each time — persistent listings suggest the price (not the market) is what's stuck; bring a comps-based counter.
- Current owner paid $56k; list at $239k implies a 327% gain — meaningful room to come down on a strong offer.
Risks & watch-outs
- Climate carrying-cost: severe wind risk, 99% chance of damaging wind over 30y; extreme-heat days projected 7→26/yr by 2055 (HVAC capex compounding) — expect insurance premiums to compound above CPI over the hold.
Questions for the listing agent
- It's been on market 93 days. Have you received any prior offers? Is the seller open to a 9% concession, seller financing, or rate buy-down credit?
- Built in 1975 — when were the roof, HVAC, electrical panel, plumbing, and water heater last replaced?
- What does the HOA fee cover, when was the last increase, and are there any pending special assessments or reserve-fund shortfalls?
- Any open or pending special assessments — roof, HVAC, plumbing, elevator, façade? What's the per-unit balance and payoff schedule, and is the seller paying it off at close or rolling it to the buyer?
- Why hasn't it sold? Are there any deal-killer items the seller is aware of (foundation, flood, title, zoning, code violations)?
- Is there a deadline driving the sale (1031 exchange, divorce, estate, relocation)? That informs how much negotiation room exists.
- Schools are B-rated — typically a magnet for longer-tenancy family renters. What's the average tenant stay here, and is there a school-zone premium baked into asking?
- Crime grade is D in this area — have there been break-ins, vandalism, or insurance claims at this property in the last 3 years? What carrier currently insures it and at what premium?
- What's the average days-on-market for RENTAL listings here right now (not sales)? A rising rental-DOM trend means longer vacancies and softer asking-rent achievability than the comps imply.
- What's the recent tenant-quality profile in this submarket — average credit score on applications, eviction rate, late-payment / NSF rate, and stable-employment percentage? A property-management company in the area should have these aggregated.
- How much new apartment / multifamily construction is in the pipeline within 1–3 miles? Heavy new supply (>2% of stock underway) typically softens rents 12–24 months out; light construction supports rent growth.
Investment metrics
- 1% rule
- 1.19% ✓
- Cap rate
- 7.63%
- Cash-on-cash
- 4.78%
- DSCR
- 1.21
- GRM
- 7.0
CMA / ARV
No comps found within radius.
Projected returns pro-forma
-3.0% appreciation · 1.83% rent growth · sell at horizon
- IRR
- -10.3%
- Equity multiple
- 0.63×
- Total profit
- $-24,833
- Equity at exit
- $35,636
- IRR
- -2.8%
- Equity multiple
- 0.82×
- Total profit
- $-12,060
- Equity at exit
- $20,664
Cash invested: $66,920 (down + closing). Projections, not guarantees.
Landlord ↔ Tenant lean methodology
- Overall (STATE)
- 87 Strongly Landlord-Friendly
- State Florida
- 87 Strongly Landlord-Friendly · R+3
- County
- — inherits STATE
- City
- — inherits STATE
ZIP-level market 33445
- Rents YoY
- 1.8%
- Active inventory
- 354
- Price-to-rent
- 7.0×
Monthly cashflow live
- Estimated rent
- $2,847 high interval (Pro) →
- Mortgage (P&I)
- −$1,253
- Tax from tax record
- −$259 /mo · $3,108/yr
- Insurance
- −$100
- HOA
- −$371
- Vacancy / Maint / Mgmt
- −$598
- Net cashflow
- $266
Break-even live
UW: 25.0% down · 7.5% · 30yr · 1.5% tax · 5.0% vac · 8.0% maint · 8.0% mgmt
Financing live
Cash to close
- Down payment
- $59,750
- Closing costs
- $7,170
- Reserves months
- —
- Total cash needed
- —
Loan-product check · same deal, 3 products live
Conventional
25% down · 7.5% · 30yr
- Down + closing
- —
- Monthly P&I
- —
- Monthly cashflow
- —
- DSCR
- —
- Eligible?
- —
Personal DTI + credit; lowest rate.
DSCR
20% down · 8.5% · 30yr
- Down + closing
- —
- Monthly P&I
- —
- Monthly cashflow
- —
- DSCR
- —
- Eligible?
- —
No personal income docs; deal must DSCR.
Hard money
10% down · 12.0% · 12mo
- Down + closing
- —
- Monthly P&I
- —
- Monthly cashflow
- —
- DSCR
- —
- Eligible?
- —
Short-term bridge; refi at stabilization.
Rent comps 40 comps
| Address | Beds | Baths | Sqft | Rent | $/sqft | DOM | Units | Dist |
|---|---|---|---|---|---|---|---|---|
| 13487 Barwick Rd Unit B Delray Beach, FL | 2.0 | 1.5 | 1092 | $3,900 | $3.57 | 24d | 1 | 0.23mi |
| 1418 W Wickham Cir Unit B Delray Beach, FL | 3.0 | 2.5 | 1316 | $3,200 | $2.43 | 17d | 1 | 0.28mi |
| 4809 N Wickham Cir Unit A Delray Beach, FL | 2.0 | 2.0 | 1028 | $2,600 | $2.53 | 24d | 1 | 0.30mi |
| 5093 Privet Pl Unit A-1 Delray Beach, FL | 2.0 | 2.0 | 1220 | $2,350 | $1.93 | 24d | 1 | 0.35mi |
| 1225 E Magnolia Cir Delray Beach, FL | 3.0 | 2.0 | 1705 | $3,700 | $2.17 | 24d | 1 | 0.41mi |
| 4110 NW 10th St Delray Beach, FL | 3.0 | 2.5 | 1839 | $4,500 | $2.45 | 24d | 1 | 0.42mi |
| 4311 N Magnolia Cir Delray Beach, FL | 3.0 | 2.0 | 1705 | $3,100 | $1.82 | 24d | 1 | 0.43mi |
| 13419 Noble Dr Delray Beach, FL | 2.0 | 2.0 | 1410 | $3,600 | $2.55 | 17d | 1 | 0.44mi |
| 4477 NW 3rd Dr Delray Beach, FL | 2.0 | 1.5 | 1109 | $2,550 | $2.30 | 24d | 1 | 0.46mi |
| 5200 Privet Pl Unit C Delray Beach, FL | 2.0 | 2.0 | 1457 | $1,850 | $1.27 | 24d | 1 | 0.49mi |
| 4515 NW 3rd Ct Unit C Delray Beach, FL | 1.0 | 2.0 | 1080 | $1,900 | $1.76 | 24d | 1 | 0.50mi |
| 3996 NW 7th Ct Delray Beach, FL | 3.0 | 2.0 | 1480 | $5,000 | $3.38 | 24d | 1 | 0.51mi |
| 4510 NW 2nd St Unit A Delray Beach, FL | 2.0 | 2.0 | 1080 | $1,800 | $1.67 | 24d | 1 | 0.53mi |
| 4310 Village Dr Unit D Delray Beach, FL | 3.0 | 3.0 | 1326 | $2,600 | $1.96 | 24d | 1 | 0.53mi |
| 5260 Grande Palm Cir Delray Beach, FL | 3.0 | 2.0 | 1464 | $2,800 | $1.91 | 24d | 1 | 0.53mi |
| 945 Sunflower Ave Delray Beach, FL | 3.0 | 2.0 | 1755 | $4,500 | $2.56 | 7d | 1 | 0.54mi |
| 4574 Danson Way Delray Beach, FL | 3.0 | 2.5 | 1654 | $3,300 | $2.00 | 24d | 1 | 0.56mi |
| 5061 Nesting Way Unit D Delray Beach, FL | 2.0 | 2.0 | 1255 | $2,400 | $1.91 | 24d | 1 | 0.60mi |
| 5265 NW 3rd St Unit C Delray Beach, FL | 1.0 | 1.5 | 1080 | $2,200 | $2.04 | 24d | 1 | 0.61mi |
| 3935 Village Dr Unit A Delray Beach, FL | 3.0 | 3.0 | 1326 | $2,700 | $2.04 | 7d | 1 | 0.66mi |
| 3935 Village Dr Delray Beach, FL | 3.0 | 3.0 | 1326 | $2,700 | $2.04 | 5d | 1 | 0.66mi |
| 1252 Club Dr W Unit D Delray Beach, FL | 2.0 | 2.0 | 1137 | $2,100 | $1.85 | 24d | 1 | 0.70mi |
| 1252 Club Dr W Unit D Delray Beach, FL | 2.0 | 2.0 | 1137 | $2,100 | $1.85 | 5d | 1 | 0.70mi |
| 13990 Nesting Way Unit C Delray Beach, FL | 1.0 | 2.0 | 1092 | $2,300 | $2.11 | 24d | 1 | 0.70mi |
| 5462 Via Delray #123 Delray Beach, FL | 2.0 | 2.0 | 1200 | $2,700 | $2.25 | 20d | 1 | 0.73mi |
| 5033 S La Sedona Cir Delray Beach, FL | 3.0 | 2.0 | 1594 | $3,500 | $2.20 | 24d | 1 | 0.73mi |
| 13255 Royale Sabal Ct Delray Beach, FL | 3.0 | 2.5 | 1618 | $4,300 | $2.66 | 24d | 1 | 0.74mi |
| 5449 Grande Palm Cir Delray Beach, FL | 3.0 | 2.5 | 1618 | $4,000 | $2.47 | 24d | 1 | 0.77mi |
| 5449 Grande Palm Cir Delray Beach, FL | 3.0 | 2.5 | 1618 | $4,000 | $2.47 | 17d | 1 | 0.77mi |
| 14040 Nesting Way Unit B Delray Beach, FL | 1.0 | 2.0 | 1092 | $1,700 | $1.56 | 24d | 1 | 0.78mi |
| 1142 Circle Ter W Unit C Delray Beach, FL | 1.0 | 1.5 | 1080 | $1,700 | $1.57 | 2d | 1 | 0.78mi |
| 797 NW 32nd Ave Delray Beach, FL | 2.0 | 2.0 | 1480 | $2,800 | $1.89 | 17d | 1 | 0.78mi |
| 797 NW 32nd Ave Delray Beach, FL | 2.0 | 2.0 | 1480 | $2,800 | $1.89 | 24d | 1 | 0.78mi |
| 5030 Lakefront Blvd Unit D Delray Beach, FL | 2.0 | 2.0 | 1287 | $1,700 | $1.32 | 24d | 1 | 0.80mi |
| 20 Westgate Ln Unit 20G Boynton Beach, FL | 2.0 | 2.0 | 1712 | $7,990 | $4.67 | 10d | 1 | 0.82mi |
| 1152 Circle Dr Unit D Delray Beach, FL | 2.0 | 2.0 | 1200 | $2,000 | $1.67 | 12d | 1 | 0.83mi |
| 1152 Circle Dr Unit D Delray Beach, FL | 2.0 | 2.0 | 1200 | $2,000 | $1.67 | 24d | 1 | 0.83mi |
| 1155 South Drive Cir Unit A Delray Beach, FL | 2.0 | 2.0 | 1080 | $2,195 | $2.03 | 24d | 1 | 0.83mi |
| 13682 Via Flora Unit H Delray Beach, FL | 2.0 | 2.0 | 1097 | $1,900 | $1.73 | 24d | 1 | 0.84mi |
| 13670 Via Flora Delray Beach, FL | 2.0 | 2.0 | 1021 | $1,400 | $1.37 | 24d | 1 | 0.85mi |
HOA detail condo
- Monthly dues
- $371 · $4,452/yr
- Assessments
- None detected in remarks — confirm with the listing agent.
Listing history 30 events
-
2026-06-18days on market $239,000 Active 93 DOM
-
2026-06-17days on market $239,000 Active 92 DOM
-
2026-06-16days on market $239,000 Active 91 DOM
-
2026-06-15days on market $239,000 Active 90 DOM
-
2026-06-13days on market $239,000 Active 88 DOM
-
2026-06-09days on market $239,000 Active 84 DOM
-
2026-06-08days on market $239,000 Active 83 DOM
-
2026-06-07days on market $239,000 Active 82 DOM
-
2026-06-04days on market $239,000 Active 79 DOM
-
2026-06-03days on market $239,000 Active 78 DOM
-
2026-06-02days on market $239,000 Active 77 DOM
-
2026-06-01days on market $239,000 Active 76 DOM
-
2026-05-31days on market $239,000 Active 75 DOM
-
2026-03-13$239,000 Active
-
2013-12-02historical
-
2011-09-02soldstatus $56,000
-
2008-02-09historical
-
2007-11-09$129,900
-
2007-05-08$137,900
-
2005-09-06soldstatus $153,000
-
2005-06-29soldstatus $139,900
-
2005-04-25soldstatus $139,900
-
2005-04-11$139,900
-
2004-11-22soldstatus $122,900
-
2004-03-17soldstatus $74,500
-
2001-07-30soldstatus $52,500
-
2001-07-12soldstatus $52,500
-
2001-05-30historical
-
2000-07-14$54,800
-
1987-04-01soldstatus $45,000
ⓘ Source: listings_history table (triggers on properties + properties_extension) + one-shot
backfill from property_details.listing_events for pre-trigger history.
Tax reassessment forecast FL · Resets to sale price
- Current annual tax
- $3,108 · $259/mo
- Projected year-2 tax
- $3,108 · $259/mo
- Expected delta
- $0/yr ($0/mo · 0.0%)
ⓘ Screening estimate from a state-policy table — verify with the county assessor before closing.
Climate risk First Street
- Flood 4/10 Moderate FEMA zone X (unshaded) · 22% chance over 30 yrs
- Wildfire 1/10 Low
- Heat 9/10 Extreme 7 d/yr ≥106°F today · 26 d/yr by 30 yrs out
- Wind 10/10 Extreme 99% chance of damaging wind over 30 yrs
- Air quality 2/10 Low 1 unhealthy d/yr today · 2 by 30 yrs out
Nearby sold comps map
Loading sold comps map…
Walkable amenities ~0.75 mi
Loading nearby amenities…
Taxation est. · year 1
- Rental income
- $34,166
- − Mortgage interest
- −$13,388
- − Property taxes
- −$3,108
- − Insurance
- −$1,195
- − Repairs & maintenance
- −$2,733
- − Management
- −$2,733
- − HOA
- −$4,452
- − Depreciation
- −$6,953
- Taxable loss
- −$396
- Est. tax savings @ 24.0%
- +$95
- After-tax cash flow
- $3,291/yr
For passive investors: Depreciation is non-cash, so a rental often shows a tax loss while cash-flowing — sheltering income. Rental losses are passive: they offset passive income freely, and up to $25,000/yr can offset ordinary (W-2) income if you actively participate and your MAGI is under $100k (phasing out to $0 by $150k); unused losses carry forward. On sale, claimed depreciation is recaptured at up to 25%, and gains may owe capital-gains tax (a 1031 exchange can defer both). Figures are a year-1 estimate at your 24.0% rate — not tax advice; consult a CPA.
Schools (NCES district)
- District
- Palm Beach
- NCES district ID
- 1201500
- Math proficiency
- 46% ▼ -16.00%
- Reading proficiency
- 53% ▼ -4.00%
- Median HH income
- $53,943
- Composite
- 42.72/100
- National rank
- #3160
- State rank
- #34 of 73 in FL
Livability — Delray Beach
- Score
- 77/100
- State rank
- #202
- US rank
- #3160
Category grades
Schools grade is shown separately in the Schools card above.
Census & demographics
- Census place
- Delray Beach, FL
- County
- Palm Beach County · 1,438,312 people
- City population
- 123,167
- Metro
- Miami-Fort Lauderdale-Pompano Beach, FL
- Population (ZIP)
- 33,122
- Household income
- $78,163
- Rent vs Own
- Severe rent burden
- 1649.0
Population outlook (Palm Beach County) Hauer SSP2
- Today (2025)
- 1,637,487 people
- By 2030
- 1,743,255 · +6.5%
- By 2040
- 1,948,712 · +19.0%
- By 2050
- 2,132,979 · +30.3%
- By 2075
- 2,530,027 · +54.5%
- By 2100
- 2,706,979 · +65.3%
Race, ethnicity, and origin ACS 2023
- Neighborhood character
- Diverse neighborhood (Simpson 0.62)
- Race & ethnicity
- White 55% Black 24% Hispanic / Latino 11% Two or more races 11% Asian 4%
- Hispanic origin (detail)
- Puerto Rican 3% Cuban 2%
- Common ancestry
- Hispanic 14% Romanian 3% Scotch-Irish 3%
- Foreign-born
- 27% · Canada, Jamaica, Dominican Republic
- Languages at home
- 66% English-only · French/Haitian/Cajun 18% Spanish 9% Other Indo-European 4%
Political lean MEDSL · Palm Beach
- 2024 margin
- Toss-up / Even · D 50.0% · R 49.2%
- 2008→2024 swing
- -22.1pp toward R · 2008: 22.9pp · 2024: 0.8pp
- All cycles
- 2024: D+0.8 2020: D+12.8 2016: D+15.3 2012: D+17.0 2008: D+22.9
Not yet ingested
- Civics
- —
Market trends
- HPI YoY
- ▼ -258.16%
- Current HPI
- 349.5505
- Rent YoY
- ▲ 1.83%
- Metro
- Miami-Fort Lauderdale-Pompano Beach, FL
- State GDP YoY
- ▲ 3.28%
- F500 in state
- 36
Industry mix (Fortune 500 HQ in FL)
| Industry | F500 HQs | Revenue |
|---|---|---|
| Industrial Technology | 2 | $29B |
|
||
| Insurance | 2 | $17B |
|
||
| Retail | 1 | $60B |
|
||
| Technology Distribution | 1 | $58B |
|
||
| Homebuilding | 1 | $35B |
|
||
| Technology Manufacturing | 1 | $35B |
|
||
Price history
+431.1% since first listed17 events — show timeline
- 2026-03-13 Listed $239,000 Beaches MLS
- 2013-12-02 Listing Removed — Beaches MLS
- 2011-09-02 Sold (Public Records) $56,000 Public Records
- 2008-02-09 Listing Removed — Beaches MLS
- 2007-11-09 Listed $129,900 Beaches MLS
- 2007-05-08 Listed $137,900 Beaches MLS
- 2005-09-06 Sold (Public Records) $153,000 Public Records
- 2005-06-29 Sold (Public Records) $139,900 Public Records
- 2005-04-25 Sold (MLS) $139,900 Beaches MLS
- 2005-04-11 Listed $139,900 Beaches MLS
- 2004-11-22 Sold (Public Records) $122,900 Public Records
- 2004-03-17 Sold (Public Records) $74,500 Public Records
- 2001-07-30 Sold (Public Records) $52,500 Public Records
- 2001-07-12 Sold (MLS) $52,500 Beaches MLS
- 2001-05-30 Listing Removed — Beaches MLS
- 2000-07-14 Listed $54,800 Beaches MLS
- 1987-04-01 Sold (Public Records) $45,000 Public Records
Property tax history
+12.1%/yrLatest (2025): $3,108 · +4.4% YoY. Source: county tax records.
Cash-flow waterfall
monthlySold comps — $/sqft
last 12 mo · ≤1 miLoading sold comps…