5662 Golden Eagle Cir · Palm Beach Gardens, FL
Flood risk 1/10 · Minimal
- FEMA flood zone
- X (unshaded)
- Chance of flooding over 30 yrs
- 0.0%
- Est. flood insurance / yr
- $507 – $1,088
Fire risk 3/10 · Minor
- Est. fire insurance / yr
- $947 – $1,759
Heat risk 9/10 · Severe
- Hot days now (above 106°F)
- 6 days/yr
- Hot days in 30 yrs
- 21 days/yr
Wind risk 10/10 · Severe
- Chance of severe wind over 30 yrs
- 99.0%
Air-quality risk 2/10 · Minimal
- Unhealthy air days now
- 1 days/yr
- Unhealthy air days in 30 yrs
- 2 days/yr
Risk factors via First Street. Map © Google.
Why this score? — see what drove the D grade
The composite is a weighted blend of 9 inputs, each scored 0–100. Each bar is that input's sub-score; the figure is the points it added to the 100-point composite (weight × sub-score).
- Cash flow +12.7/30.0
- ARV discount +7.5/15.0
- Schools +4.3/10.0
- DSCR +3.8/10.0
- 1% rule +3.6/10.0
- Livability +3.5/5.0
- Rent growth +3.0/5.0
- Condition / age +2.5/5.0
- Appreciation +0.0/10.0
$399,000
🖨 Deal sheet (PDF) 📄 Offer letter ✓ Due diligence
Listing remarks MLS
View the photos and click the virtual tour link under the main photo to view a 3 D virtual walk-through tour of this beautiful one story town home situated within walking distance to the clubhouse, community tour and tour of Palm Beach Gardens. All broker information deemed reliable and subject to errors and omissions and changes without notice. Measurements are approximate and all information should be independently verified.
Key facts
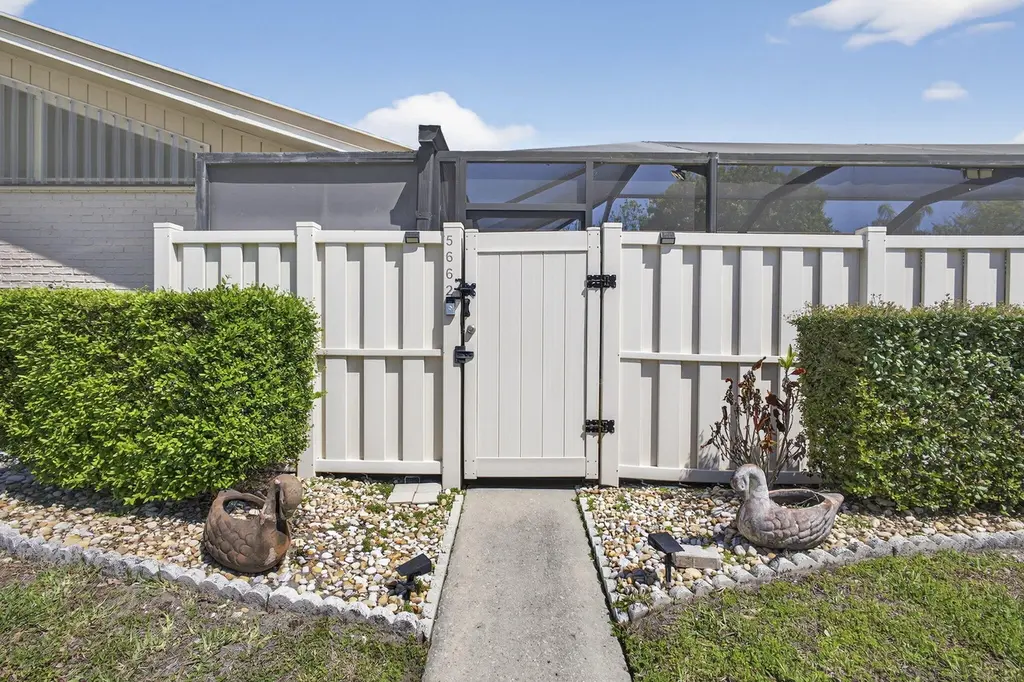
- Private fenced patio
- Easy access to i-95
- Sliding glass doors
Tags
Property features AI
Finance
- Other: Pets allowed (restrictions possible)
- HOA & community: Part of Westwood Gardens community; Monthly association fee; Association amenities include pool, clubhouse, tennis and pickleball courts, basketball court, jogging path, parking, and community room; Association fee covers cable TV, ground maintenance, and common areas
Exterior
- Parking: Two assigned parking spaces; Deeded parking; Guest parking; Open parking
- Utilities: Public water; Public sewer; Electricity available; Cable available
- Home design: Townhouse; One story; Entry level: 1; Faces northwest; Resale property
- Construction: CBS construction; Metal roof
- Exterior features: Screened patio and screened porch; Patio; Porch; Fenced yard; Landscaped; Paved road access; Not waterfront
Interior
- Kitchen: Dishwasher; Electric range; Microwave; Refrigerator
- Bedrooms: One main-level bedroom
- Flooring: Ceramic tile
- Bathrooms: Two full bathrooms (one on main level)
- Heating & cooling: Central electric heating; Central electric cooling (central air)
- Interior features: Vaulted ceilings; Split bedroom layout; Roman tub; Sliding windows
- Laundry & utility: Indoor laundry with washer hookup
Neighborhood map
What this means for you Summary
Snapshot
- This is a 3-bed/2.0-bath single-family listed at $399k.
Deal economics
- At list price, monthly cash flow is $-47 ($-566/yr) — negative.
- To cash-flow at today's rent, offer at most $391k (2.1% below list).
- To meet the 1% rule (rent ≥ 1% of price), the offer needs to be $345k (13.6% below list).
- Recommended offer: $345k (13.6% below list) — sets the bar for 1% rule.
Location & tenants
- Location reads 69/100 on livability (#464 in FL) — a middle-class / working-renter tenant base. Strengths: crime A+, employment A+, housing A+; Watch: amenities F, commute F, cost of living F.
- Palm Beach (suburban): math 46% / reading 53% proficiency, ranked #34 of 73 in FL (top 47%) — families likely to look elsewhere, expect single-tenant / working-renter base with shorter leases.
- Zoned schools: Marsh Pointe Elementary (math 85% / reading 85%, grade A+, #35 of 2,144 statewide, top 2%, 835 students, 16% FRL); Watson B. Duncan Middle School (math 54% / reading 59%, grade B, #171 of 571 statewide, top 30%, 1,157 students, 41% FRL); William T. Dwyer High School (math 36% / reading 58%, grade D-, #207 of 667 statewide, top 32%, 2,206 students, 37% FRL) — zoned schools average 31% FRL vs 52% district-wide (21 pts lower); this property's tenant base skews higher-income than the district average.
- Zoned-school proficiency averages 63% at this address vs 50% district-wide (+13 pts) — the actual schools serving this property are materially stronger than the Palm Beach average implies; a family-tenant draw the district grade alone would hide.
- Market conditions: Rents rising (+2.0%/yr); 541 active listings in the ZIP; 33 comparable units currently listed for rent nearby; rentals at typical pace (median 22d on market — plan ~3-4 weeks tenant-placement turnaround); high-income renter base; 3,974 units permitted in Palm Beach County in 2024 (1,012 in 5+ unit buildings).
- This rent runs 33% of the median local income ($125k/yr) — at the standard rent-burdened threshold; future hikes will face affordability resistance.
Forward outlook
- Local home prices are declining (-3.0%/yr); year-one equity from $3k of loan paydown is wiped out by about $12k of value loss. Plan a longer hold.
- Palm Beach County population projected at +30% by 2050 — long-run rental-demand tailwind backs the buy-and-hold thesis.
Negotiation context
- It's been on market 86 days — a 6% lower offer ($375k) is reasonable based on typical stale-listing flexibility.
- 10 sale attempts since 24y ago with the ask held roughly flat each time — persistent listings suggest the price (not the market) is what's stuck; bring a comps-based counter.
- Current owner paid $238k; list at $399k implies a 68% gain — meaningful room to come down on a strong offer.
Risks & watch-outs
- Climate carrying-cost: severe wind risk, 99% chance of damaging wind over 30y; extreme-heat days projected 6→21/yr by 2055 (HVAC capex compounding) — expect insurance premiums to compound above CPI over the hold.
Questions for the listing agent
- What do current leases actually rent for vs. the listed asking? Can we see a recent rent roll and the last 12 months of T-12 income?
- It's been on market 86 days. Have you received any prior offers? Is the seller open to a 14% concession, seller financing, or rate buy-down credit?
- What does the HOA fee cover, when was the last increase, and are there any pending special assessments or reserve-fund shortfalls?
- Why hasn't it sold? Are there any deal-killer items the seller is aware of (foundation, flood, title, zoning, code violations)?
- Is there a deadline driving the sale (1031 exchange, divorce, estate, relocation)? That informs how much negotiation room exists.
- Schools are B-rated — typically a magnet for longer-tenancy family renters. What's the average tenant stay here, and is there a school-zone premium baked into asking?
- The area grade is low — what's the realistic commute time and amenity access for the typical tenant pool here? Any planned neighborhood developments (good or bad) we should know about?
- What's the average days-on-market for RENTAL listings here right now (not sales)? A rising rental-DOM trend means longer vacancies and softer asking-rent achievability than the comps imply.
- What's the recent tenant-quality profile in this submarket — average credit score on applications, eviction rate, late-payment / NSF rate, and stable-employment percentage? A property-management company in the area should have these aggregated.
- How much new for-sale + rental construction is in the pipeline within 1–3 miles? Heavy new supply typically softens prices + rents 12–24 months out; constrained supply supports both.
Investment metrics
- 1% rule
- 0.86% ✗
- Cap rate
- 6.15%
- Cash-on-cash
- -0.51%
- DSCR
- 0.98
- GRM
- 9.6
CMA / ARV
No comps found within radius.
Projected returns pro-forma
-3.0% appreciation · 2.0% rent growth · sell at horizon
- IRR
- -18.3%
- Equity multiple
- 0.36×
- Total profit
- $-71,034
- Equity at exit
- $59,492
- IRR
- -12.6%
- Equity multiple
- 0.29×
- Total profit
- $-79,294
- Equity at exit
- $34,498
Cash invested: $111,720 (down + closing). Projections, not guarantees.
Landlord ↔ Tenant lean methodology
- Overall (STATE)
- 87 Strongly Landlord-Friendly
- State Florida
- 87 Strongly Landlord-Friendly · R+3
- County
- — inherits STATE
- City
- — inherits STATE
ZIP-level market 33418
- Home prices YoY
- -32.4%
- Rents YoY
- 2.0%
- Active inventory
- 541
- Price-to-rent
- 9.6×
Monthly cashflow live
- Estimated rent
- $3,449 high interval (Pro) →
- Mortgage (P&I)
- −$2,092
- Tax from tax record
- −$123 /mo · $1,482/yr
- Insurance
- −$166
- HOA
- −$390
- Vacancy / Maint / Mgmt
- −$724
- Net cashflow
- $-47
Break-even live
Sensitivity live
| Price | -10% $179 | -5% $66 | +0% $-47 | +5% $-160 | +10% $-273 |
|---|---|---|---|---|---|
| Rent | -10% $-320 | -5% $-183 | +0% $-47 | +5% $89 | +10% $225 |
| Rate | -1.0pp $154 | -0.5pp $54 | base $-47 | +0.5pp $-151 | +1.0pp $-256 |
UW: 25.0% down · 7.5% · 30yr · 1.5% tax · 5.0% vac · 8.0% maint · 8.0% mgmt
Financing live
Cash to close
- Down payment
- $99,750
- Closing costs
- $11,970
- Reserves months
- —
- Total cash needed
- —
Loan-product check · same deal, 3 products live
Conventional
25% down · 7.5% · 30yr
- Down + closing
- —
- Monthly P&I
- —
- Monthly cashflow
- —
- DSCR
- —
- Eligible?
- —
Personal DTI + credit; lowest rate.
DSCR
20% down · 8.5% · 30yr
- Down + closing
- —
- Monthly P&I
- —
- Monthly cashflow
- —
- DSCR
- —
- Eligible?
- —
No personal income docs; deal must DSCR.
Hard money
10% down · 12.0% · 12mo
- Down + closing
- —
- Monthly P&I
- —
- Monthly cashflow
- —
- DSCR
- —
- Eligible?
- —
Short-term bridge; refi at stabilization.
Rent comps 33 comps
| Address | Beds | Baths | Sqft | Rent | $/sqft | DOM | Units | Dist |
|---|---|---|---|---|---|---|---|---|
| 5653 Golden Eagle Cir Palm Beach Gardens, FL | 3.0 | 2.0 | 1276 | $3,200 | $2.51 | 13d | 1 | 0.06mi |
| 5457 Eagle Lake Dr Palm Beach Gardens, FL | 2.0 | 2.0 | 1276 | $2,800 | $2.19 | 25d | 1 | 0.31mi |
| 12885 Trevi Isle Dr Palm Beach Gardens, FL | 3.0 | 2.5 | 1832 | $4,100 | $2.24 | 15d | 1 | 0.51mi |
| 100 Portofino Dr Palm Beach Gardens, FL | 1.0–3.0 | 1.0–2.0 | 1183 | $3,200 | $2.70 | 0d | 51 | 0.56mi |
| 12751 Touchstone Pl Palm Beach Gardens, FL | 2.0 | 2.0 | 1741 | $3,550 | $2.04 | 25d | 1 | 0.61mi |
| 3333 Central Gardens Cir Palm Beach Gardens, FL | 2.0–3.0 | 2.0 | 1597 | $4,169 | $2.61 | 3d | 5 | 0.73mi |
| 3319 Central Gardens Cir Unit Elite Palm Beach Gardens, FL | 2.0 | 2.0 | 1415 | $3,201 | $2.26 | 12d | 1 | 0.79mi |
| 3319 Central Gardens Cir Unit Elite Palm Beach Gardens, FL | 2.0 | 2.0 | 1415 | $3,470 | $2.45 | 0d | 1 | 0.79mi |
| 4045 Central Gardens Way Palm Beach Gardens, FL | 1.0–3.0 | 1.0–2.0 | 1175 | $3,772 | $3.21 | 0d | 19 | 0.89mi |
| 5009 Dulce Ct Palm Beach Gardens, FL | 3.0 | 2.5 | 1855 | $5,500 | $2.96 | 4d | 1 | 0.99mi |
| 12830 Briarlake Dr #103 Palm Beach Gardens, FL | 2.0 | 2.0 | 1000 | $5,500 | $5.50 | 12d | 1 | 1.00mi |
| 12962 Briarlake Dr #103 Palm Beach Gardens, FL | 2.0 | 2.0 | 1000 | $2,800 | $2.80 | 25d | 1 | 1.02mi |
| 12926 Briarlake Dr #201 Palm Beach Gardens, FL | 2.0 | 2.0 | 1300 | $2,850 | $2.19 | 15d | 1 | 1.02mi |
| 6403 Eastpointe Pines St Palm Beach Gardens, FL | 2.0 | 2.0 | 1656 | $4,500 | $2.72 | 4d | 1 | 1.03mi |
| 6403 Eastpointe Pines St Palm Beach Gardens, FL | 2.0 | 2.0 | 1656 | $4,500 | $2.72 | 25d | 1 | 1.03mi |
| 12870 Briarlake Dr #205 Palm Beach Gardens, FL | 2.0 | 2.0 | 1400 | $3,000 | $2.14 | 25d | 1 | 1.06mi |
| 6672 S Pine Ct Palm Beach Gardens, FL | 2.0 | 2.0 | 1778 | $6,900 | $3.88 | 21d | 1 | 1.14mi |
| 13289 Touchstone Pl Palm Beach Gardens, FL | 2.0 | 2.0 | 1328 | $4,000 | $3.01 | 25d | 1 | 1.30mi |
| 801 Sabal Ridge Cir Unit H Palm Beach Gardens, FL | 2.0 | 2.0 | 1400 | $2,900 | $2.07 | 25d | 1 | 1.34mi |
| 455 Pumpkin Dr Palm Beach Gardens, FL | 3.0 | 2.5 | 1609 | $3,650 | $2.27 | 0d | 1 | 1.36mi |
| 13403 Touchstone Pl Unit A-102 West Palm Beach, FL | 2.0 | 2.0 | 1245 | $3,000 | $2.41 | 8d | 1 | 1.38mi |
| 1101 Myrtlewood Cir E Unit 101 Palm Beach Gardens, FL | 2.0 | 2.0 | 1213 | $2,150 | $1.77 | 25d | 1 | 1.41mi |
| 9212 Myrtlewood Cir W Palm Beach Gardens, FL | 2.0 | 1.0 | 910 | $2,400 | $2.64 | 25d | 1 | 1.41mi |
| 1201 Myrtlewood Cir E Palm Beach Gardens, FL | 2.0 | 2.0 | 1213 | $2,600 | $2.14 | 25d | 1 | 1.41mi |
| 5203 Myrtlewood Cir E Palm Beach Gardens, FL | 2.0 | 2.0 | 1202 | $2,600 | $2.16 | 25d | 1 | 1.41mi |
| 7302 Myrtlewood Cir W Palm Beach Gardens, FL | 3.0 | 2.0 | 1193 | $3,200 | $2.68 | 25d | 1 | 1.41mi |
| 4208 Myrtlewood Cir E #4208 Palm Beach Gardens, FL | 2.0 | 2.0 | 1057 | $2,500 | $2.37 | 6d | 1 | 1.41mi |
| 1101 Myrtlewood Cir E Unit 101 Palm Beach Gardens, FL | 2.0 | 2.0 | 1213 | $2,150 | $1.77 | 23d | 1 | 1.41mi |
| 10103 Myrtlewood Cir W Palm Beach Gardens, FL | 2.0 | 2.0 | 1213 | $2,600 | $2.14 | 6d | 1 | 1.41mi |
| 10106 Myrtlewood Cir W Palm Beach Gardens, FL | 2.0 | 2.0 | 1004 | $2,350 | $2.34 | 12d | 1 | 1.41mi |
| 233 Evergrene Pkwy Palm Beach Gardens, FL | 2.0 | 2.0 | 1144 | $3,250 | $2.84 | 23d | 1 | 1.42mi |
| 113 Evergrene Pkwy Unit 3-A Palm Beach Gardens, FL | 2.0 | 2.0 | 1144 | $3,700 | $3.23 | 25d | 1 | 1.42mi |
| 354 November St Palm Beach Gardens, FL | 3.0 | 2.5 | 1609 | $3,950 | $2.45 | 25d | 1 | 1.45mi |
HOA detail
- Monthly dues
- $390 · $4,680/yr
Listing history 46 events
-
2026-06-21days on market $399,000 Active 86 DOM
-
2026-06-18days on market $399,000 Active 83 DOM
-
2026-06-17days on market $399,000 Active 82 DOM
-
2026-06-16days on market $399,000 Active 81 DOM
-
2026-06-15days on market $399,000 Active 80 DOM
-
2026-06-13days on market $399,000 Active 78 DOM
-
2026-06-09days on market $399,000 Active 74 DOM
-
2026-06-08days on market $399,000 Active 73 DOM
-
2026-06-07days on market $399,000 Active 72 DOM
-
2026-06-04days on market $399,000 Active 69 DOM
-
2026-06-03days on market $399,000 Active 68 DOM
-
2026-06-02days on market $399,000 Active 67 DOM
-
2026-06-01days on market $399,000 Active 66 DOM
-
2026-05-31days on market $399,000 Active 65 DOM
-
2026-03-27price $399,000
-
2026-03-27$399,999 Active
-
2025-10-17historical
-
2025-06-19price $415,000
-
2025-05-27status Active
-
2025-05-20historical Active Under Contract
-
2025-04-18status Active
-
2025-04-17historical
-
2025-03-13price $405,000
-
2025-02-21price $415,000
-
2025-01-13status Active
-
2024-10-25historical
-
2024-10-15$420,000 Active
-
2018-06-26soldstatus $238,000
-
2018-06-25soldstatus $238,000 Closed 430-char remark
Show marketing remark (430 chars)
View the photos and click the virtual tour link under the main photo to view a 3 D virtual walk-through tour of this beautiful one story town home situated within walking distance to the clubhouse, community tour and tour of Palm Beach Gardens. All broker information deemed reliable and subject to errors and omissions and changes without notice. Measurements are approximate and all information should be independently verified.
-
2018-05-15historical Active Under Contract 430-char remark
Show marketing remark (430 chars)
View the photos and click the virtual tour link under the main photo to view a 3 D virtual walk-through tour of this beautiful one story town home situated within walking distance to the clubhouse, community tour and tour of Palm Beach Gardens. All broker information deemed reliable and subject to errors and omissions and changes without notice. Measurements are approximate and all information should be independently verified.
-
2018-05-04$238,000 Active 430-char remark
Show marketing remark (430 chars)
View the photos and click the virtual tour link under the main photo to view a 3 D virtual walk-through tour of this beautiful one story town home situated within walking distance to the clubhouse, community tour and tour of Palm Beach Gardens. All broker information deemed reliable and subject to errors and omissions and changes without notice. Measurements are approximate and all information should be independently verified.
-
2018-04-18historical
-
2017-10-22$265,000 Active
-
2015-08-24soldstatus $185,000
-
2015-08-04soldstatus $165,000 Closed
-
2015-06-21historical Contingent
-
2015-06-08price $190,000
-
2015-04-19$200,000 Active
-
2008-12-22soldstatus $123,500
-
2008-11-26historical
-
2008-11-12$124,900
-
2002-05-16soldstatus $122,500
-
2002-05-16soldstatus $122,500
-
2002-04-01historical
-
2002-03-26$122,500
-
1984-12-01soldstatus $68,900
ⓘ Source: listings_history table (triggers on properties + properties_extension) + one-shot
backfill from property_details.listing_events for pre-trigger history.
Tax reassessment forecast FL · Resets to sale price
- Current annual tax
- $1,482 · $123/mo
- Projected year-2 tax
- $3,312 · $276/mo
- Expected delta
- +$1,830/yr (+$153/mo · 123.5%)
ⓘ Screening estimate from a state-policy table — verify with the county assessor before closing.
Climate risk First Street
- Flood 1/10 Low FEMA zone X (unshaded) · 0% chance over 30 yrs
- Wildfire 3/10 Moderate
- Heat 9/10 Extreme 6 d/yr ≥106°F today · 21 d/yr by 30 yrs out
- Wind 10/10 Extreme 99% chance of damaging wind over 30 yrs
- Air quality 2/10 Low 1 unhealthy d/yr today · 2 by 30 yrs out
Nearby sold comps map
Loading sold comps map…
Walkable amenities ~0.75 mi
Loading nearby amenities…
Taxation est. · year 1
- Rental income
- $41,392
- − Mortgage interest
- −$22,350
- − Property taxes
- −$1,482
- − Insurance
- −$1,995
- − Repairs & maintenance
- −$3,311
- − Management
- −$3,311
- − HOA
- −$4,680
- − Depreciation
- −$11,607
- Taxable loss
- −$7,345
- Est. tax savings @ 24.0%
- +$1,763
- After-tax cash flow
- $1,197/yr
For passive investors: Depreciation is non-cash, so a rental often shows a tax loss while cash-flowing — sheltering income. Rental losses are passive: they offset passive income freely, and up to $25,000/yr can offset ordinary (W-2) income if you actively participate and your MAGI is under $100k (phasing out to $0 by $150k); unused losses carry forward. On sale, claimed depreciation is recaptured at up to 25%, and gains may owe capital-gains tax (a 1031 exchange can defer both). Figures are a year-1 estimate at your 24.0% rate — not tax advice; consult a CPA.
Schools (NCES district)
- District
- Palm Beach
- NCES district ID
- 1201500
- Math proficiency
- 46% ▼ -16.00%
- Reading proficiency
- 53% ▼ -4.00%
- Median HH income
- $53,943
- Composite
- 42.72/100
- National rank
- #3160
- State rank
- #34 of 73 in FL
Livability — Palm Beach Gardens
- Score
- 69/100
- State rank
- #464
- US rank
- #8366
Category grades
Schools grade is shown separately in the Schools card above.
Census & demographics
- Census place
- Palm Beach Gardens, FL
- County
- Palm Beach County · 1,438,312 people
- City population
- 96,294
- Metro
- Miami-Fort Lauderdale-Pompano Beach, FL
- Population (ZIP)
- 43,676
- Household income
- $125,497
- Rent vs Own
- Severe rent burden
- 1339.0
Population outlook (Palm Beach County) Hauer SSP2
- Today (2025)
- 1,637,487 people
- By 2030
- 1,743,255 · +6.5%
- By 2040
- 1,948,712 · +19.0%
- By 2050
- 2,132,979 · +30.3%
- By 2075
- 2,530,027 · +54.5%
- By 2100
- 2,706,979 · +65.3%
Race, ethnicity, and origin ACS 2023
- Neighborhood character
- Predominantly White (75%)
- Race & ethnicity
- White 75% Hispanic / Latino 13% Two or more races 9% Black 5% Asian 4%
- Hispanic origin (detail)
- Mexican 2% Puerto Rican 2% Cuban 2%
- Common ancestry
- Romanian 5% Lithuanian 4% Scotch-Irish 4%
- Foreign-born
- 15% · Canada, China, Jamaica
- Languages at home
- 83% English-only · Spanish 8% German/W. Germanic 2% Other Indo-European 2%
Political lean MEDSL · Palm Beach
- 2024 margin
- Toss-up / Even · D 50.0% · R 49.2%
- 2008→2024 swing
- -22.1pp toward R · 2008: 22.9pp · 2024: 0.8pp
- All cycles
- 2024: D+0.8 2020: D+12.8 2016: D+15.3 2012: D+17.0 2008: D+22.9
Not yet ingested
- Civics
- —
Market trends
- HPI YoY
- ▼ -172.79%
- Current HPI
- 361.1997
- Rent YoY
- ▲ 2.00%
- Metro
- Miami-Fort Lauderdale-Pompano Beach, FL
- State GDP YoY
- ▲ 3.28%
- F500 in state
- 36
Industry mix (Fortune 500 HQ in FL)
| Industry | F500 HQs | Revenue |
|---|---|---|
| Industrial Technology | 2 | $29B |
|
||
| Insurance | 2 | $17B |
|
||
| Retail | 1 | $60B |
|
||
| Technology Distribution | 1 | $58B |
|
||
| Homebuilding | 1 | $35B |
|
||
| Technology Manufacturing | 1 | $35B |
|
||
Price history
+479.1% since first listed32 events — show timeline
- 2026-03-27 Price Changed $399,000 Beaches MLS
- 2026-03-27 Listed $399,999 Beaches MLS
- 2025-10-17 Listing Removed — Beaches MLS
- 2025-06-19 Price Changed $415,000 Beaches MLS
- 2025-05-27 Relisted — Beaches MLS
- 2025-05-20 Contingent — Beaches MLS
- 2025-04-18 Relisted — Beaches MLS
- 2025-04-17 Listing Removed — Beaches MLS
- 2025-03-13 Price Changed $405,000 Beaches MLS
- 2025-02-21 Price Changed $415,000 Beaches MLS
- 2025-01-13 Relisted — Beaches MLS
- 2024-10-25 Listing Removed — Beaches MLS
- 2024-10-15 Listed $420,000 Beaches MLS
- 2018-06-26 Sold (Public Records) $238,000 Public Records
- 2018-06-25 Sold (MLS) $238,000 Beaches MLS
- 2018-05-15 Contingent — Beaches MLS
- 2018-05-04 Listed $238,000 Beaches MLS
- 2018-04-18 Listing Removed — Beaches MLS
- 2017-10-22 Listed $265,000 Beaches MLS
- 2015-08-24 Sold (Public Records) $185,000 Public Records
- 2015-08-04 Sold (MLS) $165,000 Beaches MLS
- 2015-06-21 Contingent — Beaches MLS
- 2015-06-08 Price Changed $190,000 Beaches MLS
- 2015-04-19 Listed $200,000 Beaches MLS
- 2008-12-22 Sold (MLS) $123,500 Beaches MLS
- 2008-11-26 Listing Removed — Beaches MLS
- 2008-11-12 Listed $124,900 Beaches MLS
- 2002-05-16 Sold (Public Records) $122,500 Public Records
- 2002-05-16 Sold (MLS) $122,500 Beaches MLS
- 2002-04-01 Listing Removed — Beaches MLS
- 2002-03-26 Listed $122,500 Beaches MLS
- 1984-12-01 Sold (Public Records) $68,900 Public Records
Property tax history
+0.1%/yrLatest (2025): $1,482 · +4.5% YoY. Source: county tax records.
Cash-flow waterfall
monthlySold comps — $/sqft
last 12 mo · ≤1 miLoading sold comps…