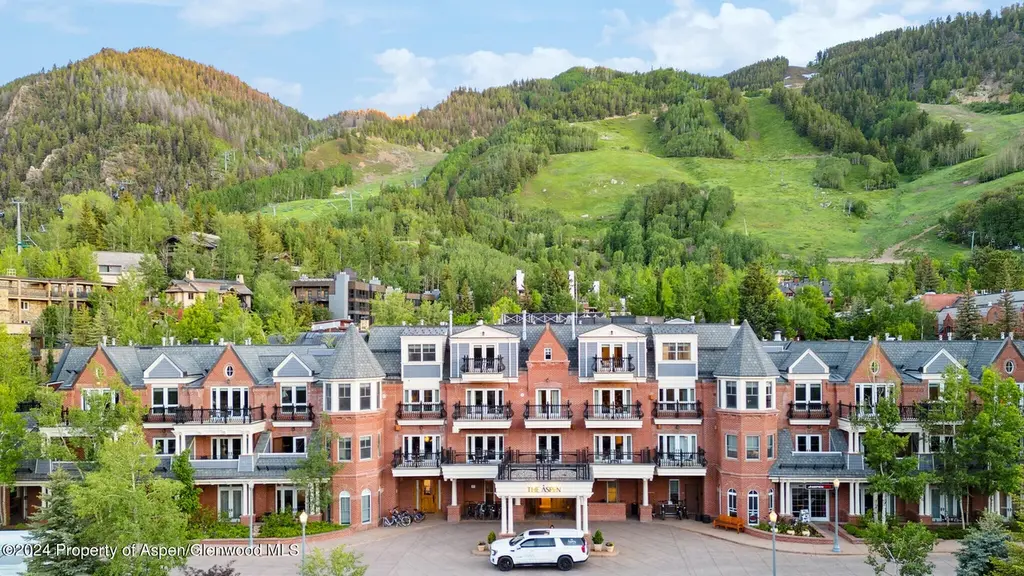
415 E Dean St, Unit 1, Week 29 St · Aspen, CO
Flood risk 1/10 · Minimal
- FEMA flood zone
- X (unshaded)
- Chance of flooding over 30 yrs
- 0.0%
- Est. flood insurance / yr
- $473 – $860
Fire risk 4/10 · Minor
- Est. fire insurance / yr
- $939 – $1,743
Heat risk 1/10 · Minimal
- Hot days now (above 76°F)
- 9 days/yr
- Hot days in 30 yrs
- 25 days/yr
Wind risk 1/10 · Minimal
- Chance of severe wind over 30 yrs
- —
Air-quality risk 3/10 · Minor
- Unhealthy air days now
- 2 days/yr
- Unhealthy air days in 30 yrs
- 3 days/yr
Risk factors via First Street. Map © Google.
Why this score? — see what drove the C grade
The composite is a weighted blend of 9 inputs, each scored 0–100. Each bar is that input's sub-score; the figure is the points it added to the 100-point composite (weight × sub-score).
- Cash flow +15.0/30.0
- Appreciation +10.0/10.0
- ARV discount +7.5/15.0
- 1% rule +5.0/10.0
- DSCR +5.0/10.0
- Rent growth +5.0/5.0
- Condition / age +4.8/5.0
- Schools +4.1/10.0
- Livability +3.3/5.0
$205,000
🖨 Deal sheet 📄 Offer letter ✓ Due diligence
Listing remarks MLS
Luxury three bedroom condominium conveniently located ground level (very private - the only unit at the end of the east wing of the building). The Aspen Mountain Residences offer outstanding service and amenities. Walk to lifts, restaurants and shopping. Enjoy summer week 32 every year together with additional float time. 2023 dates: Sat, August 13 to Sat, August 20. 2024 dates: Sat, August 12 to Sat, August 19.
Key facts
- Concierge
- Ski shop
- Heated outdoor pool
Tags
Property features AI
Finance
- Other: Located in G.A. resort condos (The Aspen Mountain Residences); Directions: Downtown Aspen, corner of Dean and Mill St.
- HOA & community: Association membership required; Annual association fee; Association amenities include management, front desk, locker ski storage, and bus/shuttle service; Association fee covers contingency fund, insurance, management, sewer, unit heat, water, trash, snow removal, and cable TV
Exterior
- Parking: Common parking; Has carport
- Home design: Condominium
- Exterior features: Faces northwest; Not new construction
Interior
- Kitchen: Dishwasher; Freezer; Oven; Range; Microwave; Refrigerator
- Bathrooms: 3 full bathrooms
- Heating & cooling: Forced air heating; Central cooling
- Interior features: Gas fireplace; Property in excellent condition
- Laundry & utility: Washer; Dryer
Neighborhood map
What this means for you Summary
Snapshot
- This is a 3-bed/3.0-bath condo listed at $205k. Condition is rated excellent.
Deal economics
- At list price, monthly cash flow is $5k ($59k/yr) — positive.
- The deal already cash-flows at list — no discount required.
- Meets the 1% rule at list price ($9k rent vs $205k).
Location & tenants
- Location reads 66/100 on livability (#142 in CO) — a middle-class / working-renter tenant base. Strengths: commute A+, employment A+, schools B+; Watch: amenities F, cost of living F, health & safety F.
- Aspen School District No. 1 In The County Of Pitkin And Sta (rural): math 36% / reading 56% proficiency, ranked #18 of 86 in CO (top 21%) — families likely to look elsewhere, expect single-tenant / working-renter base with shorter leases; only 4% free/reduced lunch — higher-income household profile.
- Market conditions: Rents rising fast (+22.1%/yr); 324 active listings in the ZIP; solid renter incomes; 145 units permitted in Pitkin County in 2024 (89 in 5+ unit buildings).
- At $9,425/mo this rent would consume 137% of the median local household income ($83k/yr) (locally 566% of renters already pay >50% of income on rent) — very limited rent-growth headroom before tenants either downsize or default.
Forward outlook
- In year one you build about $22k of equity ($1k loan paydown + $20k appreciation (10.0% local appreciation)).
- Pitkin County population projected at +20% by 2050 — long-run rental-demand tailwind backs the buy-and-hold thesis.
- At projected returns (10.0% appreciation + 8.0% rent growth), your $57k cash investment doubles in ~1 year — after that, you're playing with house money.
- By year 2, paydown + projected appreciation supports a ~$35k cash-out refi (75% LTV) — recoverable capital for the next deal without selling this one.
Negotiation context
- Only 14 days on market — expect competitive offers; lowballing is unlikely to land.
- 2 sale attempts since 4y ago with the ask held roughly flat each time — persistent listings suggest the price (not the market) is what's stuck; bring a comps-based counter.
- Current owner paid $135k; list at $205k implies a 52% gain — meaningful room to come down on a strong offer.
Questions for the listing agent
- What does the HOA fee cover, when was the last increase, and are there any pending special assessments or reserve-fund shortfalls?
- Any open or pending special assessments — roof, HVAC, plumbing, elevator, façade? What's the per-unit balance and payoff schedule, and is the seller paying it off at close or rolling it to the buyer?
- Is there a deadline driving the sale (1031 exchange, divorce, estate, relocation)? That informs how much negotiation room exists.
- Schools are B-rated — typically a magnet for longer-tenancy family renters. What's the average tenant stay here, and is there a school-zone premium baked into asking?
- What's the average days-on-market for RENTAL listings here right now (not sales)? A rising rental-DOM trend means longer vacancies and softer asking-rent achievability than the comps imply.
- What's the recent tenant-quality profile in this submarket — average credit score on applications, eviction rate, late-payment / NSF rate, and stable-employment percentage? A property-management company in the area should have these aggregated.
- How much new apartment / multifamily construction is in the pipeline within 1–3 miles? Heavy new supply (>2% of stock underway) typically softens rents 12–24 months out; light construction supports rent growth.
Investment metrics
- 1% rule
- 4.60% ✓
- Cap rate
- 35.30%
- Cash-on-cash
- 103.59%
- DSCR
- 5.61
- GRM
- 1.8
CMA / ARV
No comps found within radius.
Projected returns pro-forma
10.0% appreciation · 8.0% rent growth · sell at horizon
- IRR
- —
- Equity multiple
- 9.33×
- Total profit
- $477,861
- Equity at exit
- $184,680
- IRR
- —
- Equity multiple
- 23.37×
- Total profit
- $1,284,027
- Equity at exit
- $398,270
Cash invested: $57,400 (down + closing). Projections, not guarantees.
Landlord ↔ Tenant lean methodology
- Overall (STATE)
- 38 Tenant-Leaning
- State Colorado
- 38 Tenant-Leaning · D+4
- County
- — inherits STATE
- City
- — inherits STATE
ZIP-level market 81611
- Home prices YoY
- 3.6%
- Rents YoY
- 22.1%
- Active inventory
- 324
- Price-to-rent
- 1.8×
Monthly cashflow live
- Estimated rent
- $9,425 medium interval (Pro) →
- Mortgage (P&I)
- −$1,075
- Tax est. 1.5%
- −$256 /mo · $3,075/yr
- Insurance
- −$85
- HOA
- −$1,074
- Vacancy / Maint / Mgmt
- −$1,979
- Net cashflow
- $4,955
Break-even live
UW: 25.0% down · 7.5% · 30yr · 1.5% tax · 5.0% vac · 8.0% maint · 8.0% mgmt
Financing live
Cash to close
- Down payment
- $51,250
- Closing costs
- $6,150
- Reserves months
- —
- Total cash needed
- —
Loan-product check · same deal, 3 products live
Conventional
25% down · 7.5% · 30yr
- Down + closing
- —
- Monthly P&I
- —
- Monthly cashflow
- —
- DSCR
- —
- Eligible?
- —
Personal DTI + credit; lowest rate.
DSCR
20% down · 8.5% · 30yr
- Down + closing
- —
- Monthly P&I
- —
- Monthly cashflow
- —
- DSCR
- —
- Eligible?
- —
No personal income docs; deal must DSCR.
Hard money
10% down · 12.0% · 12mo
- Down + closing
- —
- Monthly P&I
- —
- Monthly cashflow
- —
- DSCR
- —
- Eligible?
- —
Short-term bridge; refi at stabilization.
HOA detail condo
- Monthly dues
- $1,074 · $12,888/yr
- Assessments
- None detected in remarks — confirm with the listing agent.
Listing history 11 events
-
2026-06-19days on market $205,000 Active 14 DOM
-
2026-06-18days on market $205,000 Active 13 DOM
-
2026-06-17days on market $205,000 Active 12 DOM
-
2026-06-16days on market $205,000 Active 11 DOM
-
2026-06-15days on market $205,000 Active 10 DOM
-
2026-06-14days on market $205,000 Active 8 DOM
-
2026-06-12days on market $205,000 Active 7 DOM
-
2026-06-09days on market $205,000 Active 4 DOM
-
2026-06-08days on market $205,000 Active 3 DOM
-
2026-06-07remarks 699-char remark
-
2026-06-07$205,000 Active 2 DOM
ⓘ Source: listings_history table (triggers on properties + properties_extension) + one-shot
backfill from property_details.listing_events for pre-trigger history.
Climate risk First Street
- Flood 1/10 Low FEMA zone X (unshaded) · 0% chance over 30 yrs
- Wildfire 4/10 Moderate
- Heat 1/10 Low 9 d/yr ≥76°F today · 25 d/yr by 30 yrs out
- Wind 1/10 Low
- Air quality 3/10 Moderate 2 unhealthy d/yr today · 3 by 30 yrs out
Nearby sold comps map
Loading sold comps map…
Walkable amenities ~0.75 mi
Loading nearby amenities…
Taxation est. · year 1
- Rental income
- $113,103
- − Mortgage interest
- −$11,483
- − Property taxes
- −$3,075
- − Insurance
- −$1,025
- − Repairs & maintenance
- −$9,048
- − Management
- −$9,048
- − HOA
- −$12,888
- − Depreciation
- −$5,964
- Taxable income
- $60,571
- Est. tax owed @ 24.0%
- −$14,537
- After-tax cash flow
- $44,925/yr
For passive investors: Depreciation is non-cash, so a rental often shows a tax loss while cash-flowing — sheltering income. Rental losses are passive: they offset passive income freely, and up to $25,000/yr can offset ordinary (W-2) income if you actively participate and your MAGI is under $100k (phasing out to $0 by $150k); unused losses carry forward. On sale, claimed depreciation is recaptured at up to 25%, and gains may owe capital-gains tax (a 1031 exchange can defer both). Figures are a year-1 estimate at your 24.0% rate — not tax advice; consult a CPA.
Condition & rehab AI · 12 photos
This luxury three-bedroom condo is in excellent condition with recent renovations, offering a prime location and top-notch amenities.
Value-add opportunities
- Both landscaping improvements — enhances curb appeal and adds value
- Both smart home integration — increases convenience and marketability
- Both smart thermostat — improves energy efficiency and comfort
Renovation cost estimate screening
Value-add ROI direction
- Both landscaping improvements — enhances curb appeal and adds value ↑
- Both smart home integration — increases convenience and marketability ↑
- Both smart thermostat — improves energy efficiency and comfort ↑
ⓘ Cost ranges are severity-bucket heuristics (US national rule-of-thumb). Get contractor quotes + a written scope before underwriting a rehab budget.
Schools (NCES district)
- District
- Aspen School District No. 1 In The County Of Pitkin And Sta
- NCES district ID
- 0802280
- Math proficiency
- 36% ▼ -5.00%
- Reading proficiency
- 56% ▼ -3.00%
- Median HH income
- $66,694
- Composite
- 40.98/100
- National rank
- #3595
- State rank
- #18 of 86 in CO
Livability — Aspen
- Score
- 66/100
- State rank
- #142
- US rank
- #11780
Category grades
Schools grade is shown separately in the Schools card above.
Census & demographics
- Census place
- Aspen, CO
- County
- Pitkin County · 9,068 people
- City population
- 9,068
- Metro
- Glenwood Springs, CO
- Population (ZIP)
- 9,068
- Household income
- $82,664
- Rent vs Own
- Severe rent burden
- 566.0
Population outlook (Pitkin County) Hauer SSP2
- Today (2025)
- 20,121 people
- By 2030
- 21,110 · +4.9%
- By 2040
- 22,707 · +12.9%
- By 2050
- 24,105 · +19.8%
- By 2075
- 27,933 · +38.8%
- By 2100
- 30,018 · +49.2%
Race, ethnicity, and origin ACS 2023
- Neighborhood character
- Predominantly White (81%)
- Race & ethnicity
- White 81% Hispanic / Latino 10% Two or more races 7% Asian 4%
- Hispanic origin (detail)
- Mexican 4% Salvadoran 4%
- Common ancestry
- Slovak 3% Iranian 3% Romanian 3%
- Foreign-born
- 15% · Canada, Dominican Republic, China
- Languages at home
- 82% English-only · Spanish 9% Other Indo-European 2% Chinese 2%
Political lean MEDSL · Pitkin
- 2024 margin
- Solid D (+44.2) · D 71.0% · R 26.8% · Other 2.2%
- 2008→2024 swing
- -4.6pp toward R · 2008: 48.8pp · 2024: 44.2pp
- All cycles
- 2024: D+44.2 2020: D+51.9 2016: D+45.4 2012: D+37.9 2008: D+48.8
Not yet ingested
- Civics
- —
Market trends
- HPI YoY
- ▲ 12.97%
- Current HPI
- 370.9593
- Rent YoY
- ▲ 22.07%
- Metro
- Glenwood Springs, CO
- State GDP YoY
- ▲ 1.95%
- F500 in state
- 14
Industry mix (Fortune 500 HQ in CO)
| Industry | F500 HQs | Revenue |
|---|---|---|
| Technology Distribution | 1 | $31B |
|
||
| Food / Agriculture | 1 | $18B |
|
||
| Packaging | 1 | $14B |
|
||
| Healthcare | 1 | $13B |
|
||
| Energy | 1 | $10B |
|
||
| Technology | 1 | $4B |
|
||
Price history
+5.7% since first listed5 events — show timeline
- 2026-06-05 Listed $205,000 AGMLS
- 2022-09-19 Sold (MLS) $135,000 AGMLS
- 2022-08-30 Pending — AGMLS
- 2022-06-14 Listed $149,500 AGMLS
- 2014-02-28 Sold (MLS) $194,000 AGMLS
Cash-flow waterfall
monthlySold comps — $/sqft
last 12 mo · ≤1 miLoading sold comps…