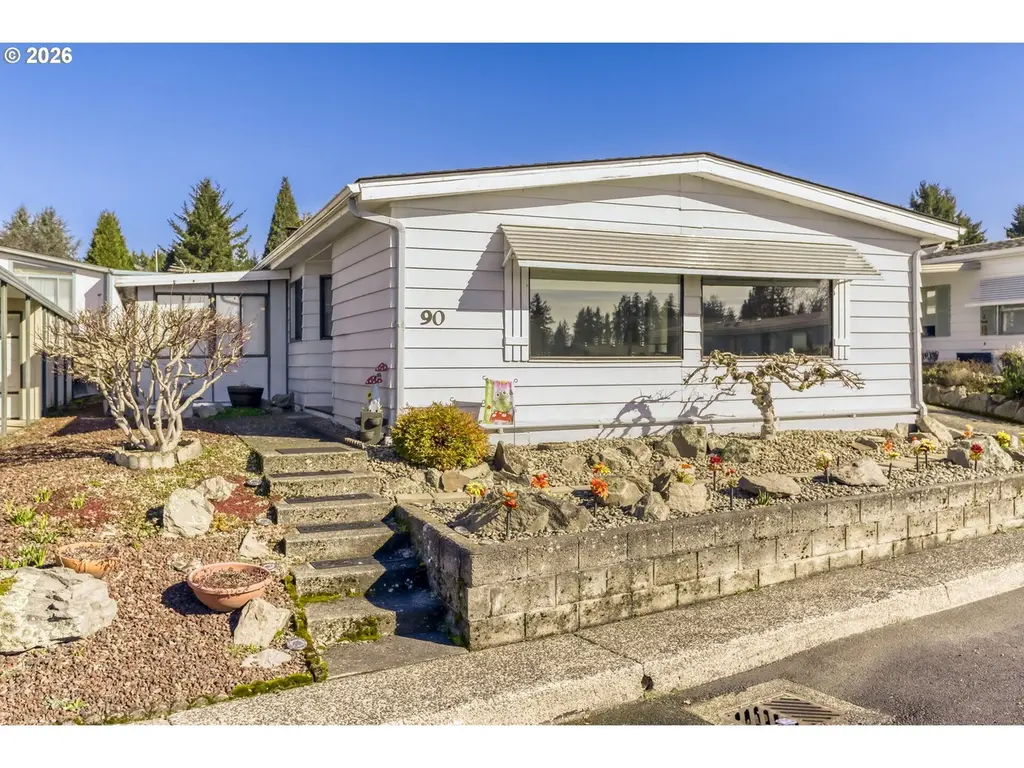
17401 SE 39th St #90 · Vancouver, WA
Flood risk No data
- FEMA flood zone
- —
- Chance of flooding over 30 yrs
- —
- Est. flood insurance / yr
- —
Fire risk No data
- Est. fire insurance / yr
- —
Heat risk No data
- Hot days now (above threshold)
- —
- Hot days in 30 yrs
- —
Wind risk No data
- Chance of severe wind over 30 yrs
- —
Air-quality risk No data
- Unhealthy air days now
- —
- Unhealthy air days in 30 yrs
- —
Risk factors via First Street. Map © Google.
Why this score? — see what drove the B+ grade
The composite is a weighted blend of 9 inputs, each scored 0–100. Each bar is that input's sub-score; the figure is the points it added to the 100-point composite (weight × sub-score).
- Cash flow +30.0/30.0
- ARV discount +15.0/15.0
- 1% rule +10.0/10.0
- DSCR +10.0/10.0
- Schools +4.3/10.0
- Livability +4.1/5.0
- Rent growth +2.5/5.0
- Condition / age +2.5/5.0
- Appreciation +0.0/10.0
$114,000
🖨 Deal sheet 📄 Offer letter ✓ Due diligence
Listing remarks MLS
2Bd, 2Ba with Den/Office and 1524SF of open space. Sunporch, back patio, fenced landscaped yard and tandem driveway with direct access to mud room. Secured workshop area in carport for the hobbyist. The home itself has a bright open living room and kitchen with HUGE view windows. Primary bed & bath with Walk-in shower, double sinks and space. All this located in the highly sought after Vista Del Rio (55+) community of Fishers Landing area. Space rent includes water & sewer as well as use of Clubhouse, pool. park, library, exercise room & pool tables. Numerous community activities can add to the fun of retirement.
Key facts
- Tandem driveway
- Walk-in shower
- Back patio
Tags
Neighborhood map
What this means for you Summary
Snapshot
- This is a 2-bed/2.0-bath manufactured listed at $114k.
Deal economics
- At list price, monthly cash flow is $891 ($11k/yr) — positive.
- The deal already cash-flows at list — no discount required.
- Meets the 1% rule at list price ($2k rent vs $114k).
- Recommended offer: $104k (9.0% below list) — sets the bar for market timing.
- Cap rate 15.7% vs local median 2.7% in Vancouver — top-decile yield for the area; either an underpriced asset or a hidden risk that comps aren't pricing in. Stress-test before assuming the spread holds.
Location & tenants
- Location reads 82/100 on livability (#62 in WA, #1,133 nationally) — a professional / high-income tenant draw. Strengths: amenities A+, commute A+, housing A+; Watch: crime F, cost of living D-.
- Evergreen School District (Clark) (urban): math 41% / reading 51% proficiency, ranked #164 of 291 in WA (top 56%) — families likely to look elsewhere, expect single-tenant / working-renter base with shorter leases.
- Market conditions: Rents soft (-0.1%/yr); 175 active listings in the ZIP; 9 comparable units currently listed for rent nearby; rentals leasing fast (median 2d on market — plan ~1-2 weeks tenant-placement turnaround); solid renter incomes; 3,547 units permitted in Clark County in 2024 (1,361 in 5+ unit buildings).
Forward outlook
- Local home prices are declining (-3.0%/yr); year-one equity from $788 of loan paydown is wiped out by about $3k of value loss. Plan a longer hold.
- Clark County population projected at +29% by 2050 — long-run rental-demand tailwind backs the buy-and-hold thesis.
- At projected returns (-3.0% appreciation + 0.0% rent growth), your $32k cash investment doubles in ~4 years — after that, you're playing with house money.
Negotiation context
- It's been on market 105 days — a 9% lower offer ($104k) is reasonable based on typical stale-listing flexibility.
Questions for the listing agent
- It's been on market 105 days. Have you received any prior offers? Is the seller open to a 9% concession, seller financing, or rate buy-down credit?
- Why hasn't it sold? Are there any deal-killer items the seller is aware of (foundation, flood, title, zoning, code violations)?
- Is there a deadline driving the sale (1031 exchange, divorce, estate, relocation)? That informs how much negotiation room exists.
- Crime grade is F in this area — have there been break-ins, vandalism, or insurance claims at this property in the last 3 years? What carrier currently insures it and at what premium?
- What's the average days-on-market for RENTAL listings here right now (not sales)? A rising rental-DOM trend means longer vacancies and softer asking-rent achievability than the comps imply.
- What's the recent tenant-quality profile in this submarket — average credit score on applications, eviction rate, late-payment / NSF rate, and stable-employment percentage? A property-management company in the area should have these aggregated.
- How much new for-sale + rental construction is in the pipeline within 1–3 miles? Heavy new supply typically softens prices + rents 12–24 months out; constrained supply supports both.
Investment metrics
- 1% rule
- 1.85% ✓
- Cap rate
- 15.67%
- Cash-on-cash
- 33.50%
- DSCR
- 2.49
- GRM
- 4.5
CMA / ARV
- ARV (median comp)
- $140,570
- List price
- $114,000
- Delta
- -18.90%
- Verdict
- UNDERPRICED
- Comps
- 9 within 1.0 mi
Show comp detail 12 sales within ~0.75 mi
| Address | Dist | Beds/Ba | Sqft | Sold | Price | $/sf | Match |
|---|---|---|---|---|---|---|---|
| 17401 SE 39th St #208 | 0.00mi | 2/2.0 | 1,524 (0%) | 12mo | $160,000 | $105 | 90 |
| 17401 SE 39th St #74 | 0.00mi | 2/2.0 | 1,483 (-3%) | 10mo | $174,000 | $117 | 87 |
| 17401 SE 39th St #200 | 0.00mi | 2/2.0 | 1,600 (+5%) | 10mo | $125,500 | $78 | 83 |
| 17401 SE 39th St #77 | 0.00mi | 2/2.0 | 1,425 (-6%) | 9mo | $149,000 | $105 | 82 |
| 17401 SE 39th St #125 | 0.00mi | 2/2.0 | 1,445 (-5%) | 12mo | $152,000 | $105 | 81 |
| 17401 SE 39th St #127 | 0.00mi | 2/2.0 | 1,451 (-5%) | 18mo | $170,000 | $117 | 77 |
| 17401 SE 39th St #141 | 0.00mi | 2/2.0 | 1,693 (+11%) | 9mo | $140,000 | $83 | 74 |
| 17401 SE 39th St #30 | 0.00mi | 2/2.0 | 1,390 (-9%) | 15mo | $158,000 | $114 | 73 |
| 17401 SE 39th St #86 | 0.00mi | 3/2.0 (+1) | 1,636 (+7%) | 12mo | $150,000 | $92 | 73 |
| 17401 SE 39th St #203 | 0.00mi | 2/2.0 | 1,340 (-12%) | 11mo | $150,000 | $112 | 71 |
| 17401 SE 39th St #96 | 0.00mi | 3/2.0 (+1) | 1,688 (+11%) | 8mo | $140,000 | $83 | 70 |
| 17401 SE 39th St #148 | 0.00mi | 2/2.0 | 1,325 (-13%) | 18mo | $151,900 | $115 | 63 |
Match score weights: distance 35% · size 25% · config 20% · recency 20%. Top-matched comps best support the ARV.
Projected returns pro-forma
-3.0% appreciation · 0.0% rent growth · sell at horizon
- IRR
- 25.3%
- Equity multiple
- 2.01×
- Total profit
- $32,112
- Equity at exit
- $16,998
- IRR
- 31.2%
- Equity multiple
- 3.42×
- Total profit
- $77,222
- Equity at exit
- $9,857
Cash invested: $31,920 (down + closing). Projections, not guarantees.
Landlord ↔ Tenant lean methodology
- Overall (STATE)
- 28 Tenant-Leaning
- State Washington
- 28 Tenant-Leaning · D+8
- County
- — inherits STATE
- City
- — inherits STATE
ZIP-level market 98683
- Rents YoY
- -0.1%
- Active inventory
- 175
- Price-to-rent
- 4.5×
Monthly cashflow live
- Estimated rent
- $2,112 high interval (Pro) →
- Mortgage (P&I)
- −$598
- Tax from tax record
- −$132 /mo · $1,582/yr
- Insurance
- −$48
- HOA
- −$0
- Vacancy / Maint / Mgmt
- −$443
- Net cashflow
- $891
Break-even live
UW: 25.0% down · 7.5% · 30yr · 1.5% tax · 5.0% vac · 8.0% maint · 8.0% mgmt
Financing live
Cash to close
- Down payment
- $28,500
- Closing costs
- $3,420
- Reserves months
- —
- Total cash needed
- —
Loan-product check · same deal, 3 products live
Conventional
25% down · 7.5% · 30yr
- Down + closing
- —
- Monthly P&I
- —
- Monthly cashflow
- —
- DSCR
- —
- Eligible?
- —
Personal DTI + credit; lowest rate.
DSCR
20% down · 8.5% · 30yr
- Down + closing
- —
- Monthly P&I
- —
- Monthly cashflow
- —
- DSCR
- —
- Eligible?
- —
No personal income docs; deal must DSCR.
Hard money
10% down · 12.0% · 12mo
- Down + closing
- —
- Monthly P&I
- —
- Monthly cashflow
- —
- DSCR
- —
- Eligible?
- —
Short-term bridge; refi at stabilization.
Rent comps 9 comps
| Address | Beds | Baths | Sqft | Rent | $/sqft | DOM | Units | Dist |
|---|---|---|---|---|---|---|---|---|
| 3100 SE 168th Ave Vancouver, WA | 1.0–3.0 | 1.0–2.5 | 1040 | $2,205 | $2.12 | 1d | 14 | 0.54mi |
| 16506 SE 29th St Vancouver, WA | 1.0–3.0 | 1.0–2.0 | 1062 | $1,962 | $1.85 | 1d | 13 | 0.67mi |
| 2610 SE 164th Ave Unit G12 Vancouver, WA | 2.0 | 2.0 | 1130 | $2,265 | $2.00 | 43d | 1 | 0.87mi |
| Chase LNDG Gresham, OR | 3.0 | 2.5 | 1389 | $2,200 | $1.58 | 12d | 3 | 0.99mi |
| 1600 SE 168th Ave Vancouver, WA | 3.0 | 1.5 | 1210 | $2,350 | $1.94 | 4d | 1 | 1.18mi |
| 2220 SE 192nd Ave Vancouver, WA | 1.0–2.0 | 1.0–2.0 | 905 | $1,979 | $2.19 | 2d | 4 | 1.18mi |
| 3114 SE 147th Pl Vancouver, WA | 2.0–3.0 | 1.5 | 1271 | $1,825 | $1.44 | 14d | 12 | 1.34mi |
| 5515 NW Pacific Rim Blvd Camas, WA | 1.0–2.0 | 1.0–2.0 | 1121 | $3,999 | $3.57 | 1d | 18 | 1.40mi |
| 5988 NW 38th Ave Camas, WA | 1.0–2.0 | 1.0–2.0 | 922 | $2,461 | $2.67 | 1d | 12 | 1.42mi |
Listing history 16 events
-
2026-06-18days on market $114,000 Active 105 DOM
-
2026-06-17days on market $114,000 Active 104 DOM
-
2026-06-16days on market $114,000 Active 103 DOM
-
2026-06-15days on market $114,000 Active 102 DOM
-
2026-06-13days on market $114,000 Active 100 DOM
-
2026-06-13days on market $114,000 Active 99 DOM
-
2026-06-09days on market $114,000 Active 96 DOM
-
2026-06-08days on market $114,000 Active 95 DOM
-
2026-06-07days on market $114,000 Active 94 DOM
-
2026-06-03days on market $114,000 Active 90 DOM
-
2026-06-02pricedays on market $114,000 Active 89 DOM
-
2026-06-01days on market $122,000 Active 88 DOM
-
2026-05-31days on market $122,000 Active 87 DOM
-
2026-04-18price $122,000 632-char remark
Show marketing remark (632 chars)
2Bd, 2Ba with Den/Office and 1524SF of open space. Sunporch, back patio, fenced landscaped yard and tandem driveway with direct access to mud room. Secured workshop area in carport for the hobbyist. The home itself has a bright open living room and kitchen with HUGE view windows. Primary bed & bath with Walk-in shower, double sinks and space. All this located in the highly sought after Vista Del Rio (55+) community of Fishers Landing area. Space rent includes water & sewer as well as use of Clubhouse, pool. park, library, exercise room & pool tables. Numerous community activities can add to the fun of retirement.
-
2026-04-09price $139,000 632-char remark
Show marketing remark (632 chars)
2Bd, 2Ba with Den/Office and 1524SF of open space. Sunporch, back patio, fenced landscaped yard and tandem driveway with direct access to mud room. Secured workshop area in carport for the hobbyist. The home itself has a bright open living room and kitchen with HUGE view windows. Primary bed & bath with Walk-in shower, double sinks and space. All this located in the highly sought after Vista Del Rio (55+) community of Fishers Landing area. Space rent includes water & sewer as well as use of Clubhouse, pool. park, library, exercise room & pool tables. Numerous community activities can add to the fun of retirement.
-
2026-03-05$154,900 Active 632-char remark
Show marketing remark (632 chars)
2Bd, 2Ba with Den/Office and 1524SF of open space. Sunporch, back patio, fenced landscaped yard and tandem driveway with direct access to mud room. Secured workshop area in carport for the hobbyist. The home itself has a bright open living room and kitchen with HUGE view windows. Primary bed & bath with Walk-in shower, double sinks and space. All this located in the highly sought after Vista Del Rio (55+) community of Fishers Landing area. Space rent includes water & sewer as well as use of Clubhouse, pool. park, library, exercise room & pool tables. Numerous community activities can add to the fun of retirement.
ⓘ Source: listings_history table (triggers on properties + properties_extension) + one-shot
backfill from property_details.listing_events for pre-trigger history.
Tax reassessment forecast WA · Resets to sale price
- Current annual tax
- $1,582 · $132/mo
- Projected year-2 tax
- $1,582 · $132/mo
- Expected delta
- $0/yr ($0/mo · 0.0%)
ⓘ Screening estimate from a state-policy table — verify with the county assessor before closing.
Nearby sold comps map
Loading sold comps map…
Walkable amenities ~0.75 mi
Loading nearby amenities…
Taxation est. · year 1
- Rental income
- $25,339
- − Mortgage interest
- −$6,386
- − Property taxes
- −$1,582
- − Insurance
- −$570
- − Repairs & maintenance
- −$2,027
- − Management
- −$2,027
- − Depreciation
- −$3,316
- Taxable income
- $9,431
- Est. tax owed @ 24.0%
- −$2,263
- After-tax cash flow
- $8,429/yr
For passive investors: Depreciation is non-cash, so a rental often shows a tax loss while cash-flowing — sheltering income. Rental losses are passive: they offset passive income freely, and up to $25,000/yr can offset ordinary (W-2) income if you actively participate and your MAGI is under $100k (phasing out to $0 by $150k); unused losses carry forward. On sale, claimed depreciation is recaptured at up to 25%, and gains may owe capital-gains tax (a 1031 exchange can defer both). Figures are a year-1 estimate at your 24.0% rate — not tax advice; consult a CPA.
Schools (NCES district)
- District
- Evergreen School District (Clark)
- NCES district ID
- 5302700
- Math proficiency
- 41% ▼ -3.00%
- Reading proficiency
- 51% ▼ -3.00%
- Median HH income
- $59,418
- Composite
- 42.53/100
- National rank
- #6859
- State rank
- #164 of 291 in WA
Livability — Vancouver
- Score
- 82/100
- State rank
- #62
- US rank
- #1133
Category grades
Schools grade is shown separately in the Schools card above.
Census & demographics
- Census place
- Vancouver, WA
- County
- Clark County · 513,189 people
- City population
- 360,195
- Metro
- Portland-Vancouver-Hillsboro, OR-WA
- Population (ZIP)
- 32,107
- Household income
- $87,659
- Rent vs Own
- Severe rent burden
- 1485.0
Population outlook (Clark County) Hauer SSP2
- Today (2025)
- 529,610 people
- By 2030
- 563,242 · +6.4%
- By 2040
- 625,905 · +18.2%
- By 2050
- 681,558 · +28.7%
- By 2075
- 805,967 · +52.2%
- By 2100
- 877,450 · +65.7%
Race, ethnicity, and origin ACS 2023
- Neighborhood character
- Diverse neighborhood (Simpson 0.55)
- Race & ethnicity
- White 65% Hispanic / Latino 13% Two or more races 11% Asian 10% Pacific Islander 2% Black 2%
- Hispanic origin (detail)
- Mexican 10% Puerto Rican 1%
- Common ancestry
- Slovak 3% Portuguese 3% Lithuanian 2%
- Foreign-born
- 14% · Canada, China, South Korea
- Languages at home
- 81% English-only · Spanish 7% Other Asian/Pacific 3% Chinese 3%
Political lean MEDSL · Clark
- 2024 margin
- Lean D (+7.0) · D 52.1% · R 45.1% · Other 2.8%
- 2008→2024 swing
- +0.9pp no change · 2008: 6.1pp · 2024: 7.0pp
- All cycles
- 2024: D+7.0 2020: D+5.1 2016: D+0.1 2012: D+0.1 2008: D+6.1
Not yet ingested
- Civics
- —
Market trends
- HPI YoY
- ▼ -273.47%
- Current HPI
- 296.9734
- Rent YoY
- ▼ -0.06%
- Metro
- Portland-Vancouver-Hillsboro, OR-WA
- State GDP YoY
- ▲ 4.65%
- F500 in state
- 22
Industry mix (Fortune 500 HQ in WA)
| Industry | F500 HQs | Revenue |
|---|---|---|
| Retail | 2 | $269B |
|
||
| Technology / Retail | 1 | $638B |
|
||
| Technology | 1 | $245B |
|
||
| Telecommunications | 1 | $38B |
|
||
| Food / Beverage | 1 | $36B |
|
||
| Automotive / Trucks | 1 | $34B |
|
||
Price history
-21.2% since first listed3 events — show timeline
- 2026-04-18 Price Changed $122,000 RMLS
- 2026-04-09 Price Changed $139,000 RMLS
- 2026-03-05 Listed $154,900 RMLS
Property tax history
+37.3%/yrLatest (2026): $1,582 · +41.8% YoY. Source: county tax records.
Cash-flow waterfall
monthlySold comps — $/sqft
last 12 mo · ≤1 miLoading sold comps…