1555 14th Ave #209 · Vero Beach, FL
Flood risk 4/10 · Minor
- FEMA flood zone
- X (unshaded)
- Chance of flooding over 30 yrs
- 0.24%
- Est. flood insurance / yr
- $507 – $1,088
Fire risk 1/10 · Minimal
- Est. fire insurance / yr
- $947 – $1,759
Heat risk 10/10 · Severe
- Hot days now (above 105°F)
- 7 days/yr
- Hot days in 30 yrs
- 24 days/yr
Wind risk 10/10 · Severe
- Chance of severe wind over 30 yrs
- 99.0%
Air-quality risk 1/10 · Minimal
- Unhealthy air days now
- 0 days/yr
- Unhealthy air days in 30 yrs
- 0 days/yr
Risk factors via First Street. Map © Google.
Why this score? — see what drove the B grade
The composite is a weighted blend of 9 inputs, each scored 0–100. Each bar is that input's sub-score; the figure is the points it added to the 100-point composite (weight × sub-score).
- Cash flow +30.0/30.0
- 1% rule +10.0/10.0
- DSCR +10.0/10.0
- ARV discount +7.5/15.0
- Schools +4.2/10.0
- Livability +4.0/5.0
- Condition / age +2.5/5.0
- Rent growth +2.1/5.0
- Appreciation +0.0/10.0
$120,000
🖨 Deal sheet (PDF) 📄 Offer letter ✓ Due diligence
Listing remarks
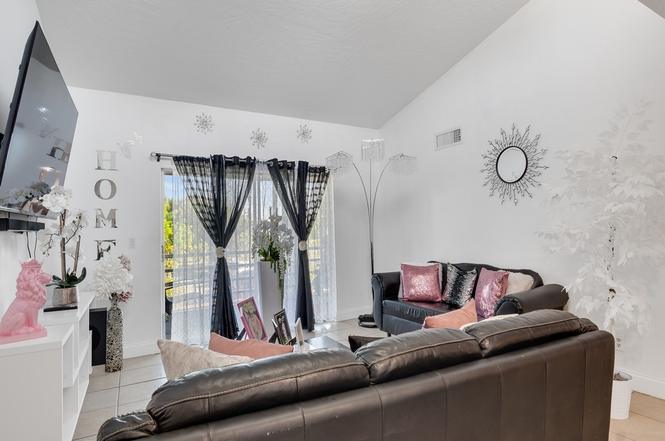
Beautifully updated 2BR/2BA second-floor condo in desirable Sutton Place! Features vaulted ceilings, tile flooring, and a screened balcony with storage—perfect for enjoying the Florida breeze. Sutton Place is a quiet, well-maintained community offering a pool, tennis courts, and lush tropical landscaping. Ideally located near downtown Vero Beach’s shops, dining, and vibrant arts district. Sizes approx. /subject to error.
Key facts
- Tennis
- Screened balcony
- Pool
Tags
Property features AI
Finance
- Financial info: Pets allowed with restrictions and limits
- HOA & community: Sutton Place Condo Association; Association dues $400 monthly; HOA covers common areas, insurance, ground maintenance, structure maintenance, roof, and reserve fund
Exterior
- Parking: Assigned uncovered parking
- Utilities: Public water; Public sewer
- Home design: Condominium, 2 stories
- Construction: Block and concrete construction
- Exterior features: Balcony; Community pool; Community amenities include pool and tennis courts; Has view; Faces east; Has attached property
Interior
- Kitchen: Dishwasher; Microwave; Range; Refrigerator; Electric water heater
- Bedrooms: Bedroom (14 x 11); Bedroom (15 x 14)
- Flooring: Tile
- Bathrooms: 2 full bathrooms
- Heating & cooling: Central heating; Central air conditioning
- Interior features: High ceilings; Sliding doors; Unfurnished
- Laundry & utility: Common area laundry
Neighborhood map
What this means for you Summary
Snapshot
- This is a 2-bed/2.0-bath condo listed at $120k.
Deal economics
- At list price, monthly cash flow is $571 ($7k/yr) — positive.
- The deal already cash-flows at list — no discount required.
- Meets the 1% rule at list price ($2k rent vs $120k).
- Recommended offer: $106k (12.0% below list) — sets the bar for market timing.
- Cap rate 12.0% vs local median 2.8% in Vero Beach — top-decile yield for the area; either an underpriced asset or a hidden risk that comps aren't pricing in. Stress-test before assuming the spread holds.
Location & tenants
- Location reads 80/100 on livability (#116 in FL, #1,784 nationally) — a professional / high-income tenant draw. Strengths: crime A+, commute A+, health & safety A+; Watch: employment D+, amenities D.
- Indian River (other): math 48% / reading 52% proficiency, ranked #35 of 73 in FL (top 48%) — acceptable for families but not a draw, mixed tenant base, ~2y average lease.
- Zoned schools: Vero Beach Elementary School (math 39% / reading 36%, grade F, #1,596 of 2,144 statewide, top 75%, 599 students, 80% FRL); Gifford Middle School (math 46% / reading 45%, grade D+, #305 of 571 statewide, top 54%, 582 students, 72% FRL); Vero Beach High School (math 28% / reading 43%, grade F, #367 of 667 statewide, top 57%, 2,847 students, 50% FRL).
- Market conditions: Rents soft (-1.7%/yr); 208 active listings in the ZIP; 40 comparable units currently listed for rent nearby; rentals at typical pace (median 23d on market — plan ~3-4 weeks tenant-placement turnaround); 564 units permitted in Indian River County in 2024 (281 in 5+ unit buildings).
- At $2,242/mo this rent would consume 49% of the median local household income ($55k/yr) (locally 1166% of renters already pay >50% of income on rent) — very limited rent-growth headroom before tenants either downsize or default.
Forward outlook
- Local home prices are declining (-3.0%/yr); year-one equity from $830 of loan paydown is wiped out by about $4k of value loss. Plan a longer hold.
- Indian River County population projected at +18% by 2050 — long-run rental-demand tailwind backs the buy-and-hold thesis.
- At projected returns (-3.0% appreciation + 0.0% rent growth), your $34k cash investment doubles in ~9 years — after that, you're playing with house money.
Negotiation context
- It's been on market 321 days — a 12% lower offer ($106k) is reasonable based on typical stale-listing flexibility.
- 2 sale attempts since 13y ago; this cycle's ask has dropped $10k (8%) from the opening price — seller is motivated, your offer sets the floor, not the list.
- Current owner paid $89k; 35% above their basis — modest negotiation headroom, anchor on the comps not their cost.
Risks & watch-outs
- Climate carrying-cost: severe wind risk, 99% chance of damaging wind over 30y; extreme-heat days projected 7→24/yr by 2055 (HVAC capex compounding) — expect insurance premiums to compound above CPI over the hold.
Questions for the listing agent
- It's been on market 321 days. Have you received any prior offers? Is the seller open to a 12% concession, seller financing, or rate buy-down credit?
- Built in 1960 — when were the roof, HVAC, electrical panel, plumbing, and water heater last replaced?
- What does the HOA fee cover, when was the last increase, and are there any pending special assessments or reserve-fund shortfalls?
- Any open or pending special assessments — roof, HVAC, plumbing, elevator, façade? What's the per-unit balance and payoff schedule, and is the seller paying it off at close or rolling it to the buyer?
- Why hasn't it sold? Are there any deal-killer items the seller is aware of (foundation, flood, title, zoning, code violations)?
- Is there a deadline driving the sale (1031 exchange, divorce, estate, relocation)? That informs how much negotiation room exists.
- What's the average days-on-market for RENTAL listings here right now (not sales)? A rising rental-DOM trend means longer vacancies and softer asking-rent achievability than the comps imply.
- What's the recent tenant-quality profile in this submarket — average credit score on applications, eviction rate, late-payment / NSF rate, and stable-employment percentage? A property-management company in the area should have these aggregated.
- How much new apartment / multifamily construction is in the pipeline within 1–3 miles? Heavy new supply (>2% of stock underway) typically softens rents 12–24 months out; light construction supports rent growth.
Investment metrics
- 1% rule
- 1.87% ✓
- Cap rate
- 12.00%
- Cash-on-cash
- 20.39%
- DSCR
- 1.91
- GRM
- 4.5
CMA / ARV
No comps found within radius.
Projected returns pro-forma
-3.0% appreciation · 0.0% rent growth · sell at horizon
- IRR
- 8.4%
- Equity multiple
- 1.32×
- Total profit
- $10,602
- Equity at exit
- $17,892
- IRR
- 14.2%
- Equity multiple
- 1.94×
- Total profit
- $31,716
- Equity at exit
- $10,375
Cash invested: $33,600 (down + closing). Projections, not guarantees.
Landlord ↔ Tenant lean methodology
- Overall (STATE)
- 87 Strongly Landlord-Friendly
- State Florida
- 87 Strongly Landlord-Friendly · R+3
- County
- — inherits STATE
- City
- — inherits STATE
ZIP-level market 32960
- Home prices YoY
- -25.5%
- Rents YoY
- -1.7%
- Active inventory
- 208
- Price-to-rent
- 4.5×
Monthly cashflow live
- Estimated rent
- $2,242 high interval (Pro) →
- Mortgage (P&I)
- −$629
- Tax from tax record
- −$121 /mo · $1,455/yr
- Insurance
- −$50
- HOA
- −$400
- Vacancy / Maint / Mgmt
- −$471
- Net cashflow
- $571
Break-even live
Sensitivity live
| Price | -10% $639 | -5% $605 | +0% $571 | +5% $537 | +10% $503 |
|---|---|---|---|---|---|
| Rent | -10% $394 | -5% $482 | +0% $571 | +5% $659 | +10% $748 |
| Rate | -1.0pp $631 | -0.5pp $601 | base $571 | +0.5pp $540 | +1.0pp $508 |
UW: 25.0% down · 7.5% · 30yr · 1.5% tax · 5.0% vac · 8.0% maint · 8.0% mgmt
Financing live
Cash to close
- Down payment
- $30,000
- Closing costs
- $3,600
- Reserves months
- —
- Total cash needed
- —
Loan-product check · same deal, 3 products live
Conventional
25% down · 7.5% · 30yr
- Down + closing
- —
- Monthly P&I
- —
- Monthly cashflow
- —
- DSCR
- —
- Eligible?
- —
Personal DTI + credit; lowest rate.
DSCR
20% down · 8.5% · 30yr
- Down + closing
- —
- Monthly P&I
- —
- Monthly cashflow
- —
- DSCR
- —
- Eligible?
- —
No personal income docs; deal must DSCR.
Hard money
10% down · 12.0% · 12mo
- Down + closing
- —
- Monthly P&I
- —
- Monthly cashflow
- —
- DSCR
- —
- Eligible?
- —
Short-term bridge; refi at stabilization.
Rent comps 40 comps
| Address | Beds | Baths | Sqft | Rent | $/sqft | DOM | Units | Dist |
|---|---|---|---|---|---|---|---|---|
| 1306 12th St Unit B Vero Beach, FL | 2.0 | 1.0 | 1000 | $1,600 | $1.60 | 23d | 1 | 0.43mi |
| 1725 20th Ave Vero Beach, FL | 3.0 | 2.0 | 1394 | $3,000 | $2.15 | 15d | 1 | 0.50mi |
| 2035 15th Pl Vero Beach, FL | 1.0 | 1.0 | 1400 | $1,750 | $1.25 | 15d | 1 | 0.51mi |
| 974 14th Ln Vero Beach, FL | 1.0–3.0 | 1.0–3.0 | 1828 | $4,049 | $2.21 | 15d | 32 | 0.51mi |
| 1936 18th Ave Unit A Vero Beach, FL | 2.0 | 1.0 | 1100 | $2,000 | $1.82 | 23d | 1 | 0.53mi |
| 939 19th St Unit 961 Vero Beach, FL | 2.0 | 2.0 | 1000 | $1,850 | $1.85 | 23d | 1 | 0.58mi |
| 1608 24th Ave Unit NA Vero Beach, FL | 3.0 | 2.0 | 1800 | $2,000 | $1.11 | 23d | 1 | 0.68mi |
| 1616 24th Ave Vero Beach, FL | 3.0 | 2.0 | 1430 | $2,495 | $1.74 | 15d | 1 | 0.68mi |
| 859 20th St Vero Beach, FL | 2.0 | 2.0 | 1736 | $6,000 | $3.46 | 23d | 1 | 0.73mi |
| 686 17th St Vero Beach, FL | 2.0 | 1.0 | 950 | $1,700 | $1.79 | 15d | 2 | 0.77mi |
| 2222 Ponce De Leon Cir Unit B Vero Beach, FL | 2.0 | 1.0 | 970 | $1,650 | $1.70 | 15d | 1 | 0.81mi |
| 1136 9th Sq Unit 1467671P Vero Beach, FL | 3.0 | 2.0 | 1399 | $4,165 | $2.98 | 23d | 1 | 0.81mi |
| 635 18th Pl Vero Beach, FL | 3.0 | 2.0 | 1120 | $2,300 | $2.05 | 23d | 1 | 0.85mi |
| 2616 15th St Vero Beach, FL | 2.0 | 2.0 | 1268 | $2,400 | $1.89 | 15d | 1 | 0.87mi |
| 1748 23rd St Vero Beach, FL | 1.0 | 1.0 | 900 | $1,250 | $1.39 | 15d | 1 | 0.88mi |
| 843 22nd Pl Vero Beach, FL | 2.0 | 1.0 | 1790 | $3,300 | $1.84 | 15d | 1 | 0.94mi |
| 808 22nd St Unit 8 Vero Beach, FL | 2.0 | 2.0 | 1000 | $1,465 | $1.47 | 23d | 1 | 0.95mi |
| 516 13th Pl Vero Beach, FL | 3.0 | 2.0 | 1102 | $1,800 | $1.63 | 23d | 1 | 0.96mi |
| 1450 5th Ave Vero Beach, FL | 3.0 | 2.0 | 1124 | $2,400 | $2.14 | 23d | 1 | 0.97mi |
| 1330 28th Ave Vero Beach, FL | 3.0 | 2.0 | 1488 | $3,200 | $2.15 | 23d | 1 | 0.99mi |
| 2434 19th Ave Vero Beach, FL | 3.0 | 2.0 | 1335 | $3,500 | $2.62 | 15d | 1 | 1.00mi |
| 400 18th St Vero Beach, FL | 2.0 | 2.0 | 1065 | $1,575 | $1.48 | 23d | 1 | 1.08mi |
| 400 18th St Vero Beach, FL | 2.0 | 2.0 | 1065 | $1,512 | $1.42 | 15d | 2 | 1.08mi |
| 1702 7th St Vero Beach, FL | 3.0 | 2.0 | 1230 | $2,100 | $1.71 | 15d | 1 | 1.09mi |
| 572 10th Pl Vero Beach, FL | 3.0 | 2.0 | 1524 | $2,500 | $1.64 | 23d | 1 | 1.11mi |
| 1510 3rd Ct Vero Beach, FL | 3.0 | 2.0 | 950 | $6,000 | $6.32 | 15d | 1 | 1.11mi |
| 677 Royal Palm Blvd #22 Vero Beach, FL | 2.0 | 2.0 | 1200 | $1,700 | $1.42 | 15d | 1 | 1.14mi |
| 1170 6th Ave Unit 2D Vero Beach, FL | 2.0 | 2.5 | 1170 | $1,800 | $1.54 | 15d | 1 | 1.15mi |
| 1166 6th Ave Vero Beach, FL | 2.0 | 2.0 | 1140 | $2,200 | $1.93 | 15d | 1 | 1.15mi |
| 1166 6th Ave Unit D Vero Beach, FL | 2.0 | 2.0 | 1140 | $2,000 | $1.75 | 23d | 1 | 1.16mi |
| 303 18th Pl Vero Beach, FL | 2.0 | 1.5 | 1200 | $1,599 | $1.33 | 23d | 1 | 1.16mi |
| 315 18th Pl Unit 315 Vero Beach, FL | 2.0 | 1.5 | 1200 | $1,599 | $1.33 | 23d | 1 | 1.17mi |
| 855 6th Ave Vero Beach, FL | 2.0 | 2.0 | 1194 | $1,950 | $1.63 | 15d | 1 | 1.19mi |
| 1801 Indian River Blvd Unit C7 Vero Beach, FL | 2.0 | 2.0 | 1200 | $1,700 | $1.42 | 15d | 1 | 1.22mi |
| 1135 3rd Ave #101 Vero Beach, FL | 2.0 | 2.0 | 906 | $1,800 | $1.99 | 23d | 1 | 1.22mi |
| 2706 10th Ave Vero Beach, FL | 3.0 | 2.0 | 1818 | $3,200 | $1.76 | 15d | 1 | 1.23mi |
| 725 23rd Ave Vero Beach, FL | 3.0 | 2.0 | 1696 | $3,500 | $2.06 | 23d | 1 | 1.23mi |
| 400 E Waverly Pl Unit 2b Vero Beach, FL | 2.0 | 2.5 | 1170 | $1,900 | $1.62 | 23d | 1 | 1.24mi |
| 600 Royal Palm Blvd Unit 1A Vero Beach, FL | 2.0 | 2.0 | 1400 | $2,000 | $1.43 | 23d | 1 | 1.26mi |
| 340 E Waverly Pl Unit 6D Vero Beach, FL | 1.0 | 1.5 | 1200 | $1,000 | $0.83 | 23d | 1 | 1.27mi |
HOA detail condo
- Monthly dues
- $400 · $4,800/yr
- Likely covers
- landscapingpool
- Assessments
- None detected in remarks — confirm with the listing agent.
Listing history 23 events
-
2026-06-22days on market $120,000 Active 321 DOM
-
2026-06-19days on market $120,000 Active 319 DOM
-
2026-06-18days on market $120,000 Active 318 DOM
-
2026-06-17days on market $120,000 Active 317 DOM
-
2026-06-16days on market $120,000 Active 316 DOM
-
2026-06-15days on market $120,000 Active 315 DOM
-
2026-06-14days on market $120,000 Active 313 DOM
-
2026-06-13days on market $120,000 Active 312 DOM
-
2026-06-10days on market $120,000 Active 310 DOM
-
2026-06-09days on market $120,000 Active 309 DOM
-
2026-06-08days on market $120,000 Active 308 DOM
-
2026-06-07days on market $120,000 Active 307 DOM
-
2026-06-05days on market $120,000 Active 304 DOM
-
2026-06-02days on market $120,000 Active 302 DOM
-
2026-06-01days on market $120,000 Active 301 DOM
-
2026-05-31days on market $120,000 Active 300 DOM
-
2026-05-30days on market $120,000 Active 299 DOM
-
2025-08-04$130,000 Active
-
2018-07-24historical
-
2013-07-09$64,000
-
2006-03-17soldstatus $88,700
-
2005-03-14soldstatus $76,200
-
1998-07-22soldstatus $31,000
ⓘ Source: listings_history table (triggers on properties + properties_extension) + one-shot
backfill from property_details.listing_events for pre-trigger history.
Tax reassessment forecast FL · Resets to sale price
- Current annual tax
- $1,455 · $121/mo
- Projected year-2 tax
- $1,455 · $121/mo
- Expected delta
- $0/yr ($0/mo · 0.0%)
ⓘ Screening estimate from a state-policy table — verify with the county assessor before closing.
Climate risk First Street
- Flood 4/10 Moderate FEMA zone X (unshaded) · 24% chance over 30 yrs
- Wildfire 1/10 Low
- Heat 10/10 Extreme 7 d/yr ≥105°F today · 24 d/yr by 30 yrs out
- Wind 10/10 Extreme 99% chance of damaging wind over 30 yrs
- Air quality 1/10 Low 0 unhealthy d/yr today · 0 by 30 yrs out
Nearby sold comps map
Loading sold comps map…
Walkable amenities ~0.75 mi
Loading nearby amenities…
Taxation est. · year 1
- Rental income
- $26,907
- − Mortgage interest
- −$6,722
- − Property taxes
- −$1,455
- − Insurance
- −$600
- − Repairs & maintenance
- −$2,153
- − Management
- −$2,153
- − HOA
- −$4,800
- − Depreciation
- −$3,491
- Taxable income
- $5,534
- Est. tax owed @ 24.0%
- −$1,328
- After-tax cash flow
- $5,522/yr
For passive investors: Depreciation is non-cash, so a rental often shows a tax loss while cash-flowing — sheltering income. Rental losses are passive: they offset passive income freely, and up to $25,000/yr can offset ordinary (W-2) income if you actively participate and your MAGI is under $100k (phasing out to $0 by $150k); unused losses carry forward. On sale, claimed depreciation is recaptured at up to 25%, and gains may owe capital-gains tax (a 1031 exchange can defer both). Figures are a year-1 estimate at your 24.0% rate — not tax advice; consult a CPA.
Schools (NCES district)
- District
- Indian River
- NCES district ID
- 1200930
- Math proficiency
- 48% ▼ -9.00%
- Reading proficiency
- 52% ▼ -3.00%
- Median HH income
- $46,597
- Composite
- 42.45/100
- National rank
- #3218
- State rank
- #35 of 73 in FL
Livability — Vero Beach
- Score
- 80/100
- State rank
- #116
- US rank
- #1784
Category grades
Schools grade is shown separately in the Schools card above.
Census & demographics
- Census place
- Vero Beach, FL
- County
- Indian River County · 143,738 people
- City population
- 98,707
- Metro
- Sebastian-Vero Beach, FL
- Population (ZIP)
- 25,259
- Household income
- $54,682
- Rent vs Own
- Severe rent burden
- 1166.0
Population outlook (Indian River County) Hauer SSP2
- Today (2025)
- 165,104 people
- By 2030
- 172,869 · +4.7%
- By 2040
- 185,640 · +12.4%
- By 2050
- 194,465 · +17.8%
- By 2075
- 211,115 · +27.9%
- By 2100
- 211,781 · +28.3%
Race, ethnicity, and origin ACS 2023
- Neighborhood character
- Majority White (65%)
- Race & ethnicity
- White 65% Hispanic / Latino 16% Two or more races 12% Black 10% Asian 4% Native American 1%
- Hispanic origin (detail)
- Mexican 6% Puerto Rican 3% Cuban 2%
- Common ancestry
- Italian 4% Slovak 3% Romanian 3%
- Foreign-born
- 11% · Canada, Jamaica, Vietnam
- Languages at home
- 82% English-only · Spanish 13% French/Haitian/Cajun 2% Other Asian/Pacific 1%
Political lean MEDSL · Indian River
- 2024 margin
- Strong R (+27.4) · D 36.0% · R 63.4%
- 2008→2024 swing
- -12.5pp toward R · 2008: -14.8pp · 2024: -27.4pp
- All cycles
- 2024: R+27.4 2020: R+21.6 2016: R+24.5 2012: R+22.3 2008: R+14.8
Not yet ingested
- Civics
- —
Market trends
- HPI YoY
- ▼ -103.20%
- Current HPI
- 302.0029
- Rent YoY
- ▼ -1.66%
- Metro
- Sebastian-Vero Beach, FL
- State GDP YoY
- ▲ 3.28%
- F500 in state
- 36
Industry mix (Fortune 500 HQ in FL)
| Industry | F500 HQs | Revenue |
|---|---|---|
| Industrial Technology | 2 | $29B |
|
||
| Insurance | 2 | $17B |
|
||
| Retail | 1 | $60B |
|
||
| Technology Distribution | 1 | $58B |
|
||
| Homebuilding | 1 | $35B |
|
||
| Technology Manufacturing | 1 | $35B |
|
||
Price history
+319.4% since first listed6 events — show timeline
- 2025-08-04 Listed $130,000 RAIRCMLS
- 2018-07-24 Listing Removed — Beaches MLS
- 2013-07-09 Listed $64,000 Beaches MLS
- 2006-03-17 Sold (Public Records) $88,700 Public Records
- 2005-03-14 Sold (Public Records) $76,200 Public Records
- 1998-07-22 Sold (Public Records) $31,000 Public Records
Property tax history
+11.0%/yrLatest (2025): $1,455 · +6.1% YoY. Source: county tax records.
Cash-flow waterfall
monthlySold comps — $/sqft
last 12 mo · ≤1 miLoading sold comps…