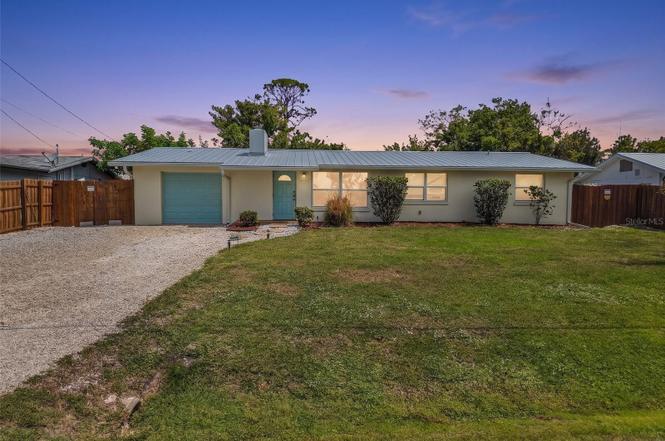
1664 Lakeview Pl · Englewood, FL
Flood risk 8/10 · Major
- FEMA flood zone
- AE
- Chance of flooding over 30 yrs
- 0.99%
- Est. flood insurance / yr
- $1,737 – $8,500
Fire risk 3/10 · Minor
- Est. fire insurance / yr
- $947 – $1,759
Heat risk 10/10 · Severe
- Hot days now (above 107°F)
- 7 days/yr
- Hot days in 30 yrs
- 29 days/yr
Wind risk 10/10 · Severe
- Chance of severe wind over 30 yrs
- 99.0%
Air-quality risk 2/10 · Minimal
- Unhealthy air days now
- 1 days/yr
- Unhealthy air days in 30 yrs
- 1 days/yr
Risk factors via First Street. Map © Google.
Why this score? — see what drove the D- grade
The composite is a weighted blend of 9 inputs, each scored 0–100. Each bar is that input's sub-score; the figure is the points it added to the 100-point composite (weight × sub-score).
- Cash flow +15.3/30.0
- Schools +5.4/10.0
- Rent growth +4.8/5.0
- DSCR +4.7/10.0
- Livability +3.7/5.0
- 1% rule +3.6/10.0
- Condition / age +2.5/5.0
- ARV discount +0.0/15.0
- Appreciation +0.0/10.0
$389,000
🖨 Deal sheet (PDF) 📄 Offer letter ✓ Due diligence
Listing remarks MLS
A lovely tropical oasis awaits you! This home offers an updated kitchen, travertine floors, wood burning fireplace, and a complete smart home setup. The outside is the perfect Florida setting to relax and have a cup of coffee or enjoy a glass of wine sitting by your heated pool surrounded by beautiful landscaping. Unwind after a long day in your hot tub or watch a game on the TV while finishing the day with a beverage at your tiki bar. This home is conveniently located within a short drive to Englewood beaches as well as the new Braves spring training facilities and the amenities of West Villages. Make your appointment today as this one will not last long!
Key facts
- Tropical tiki bar
- Travertine flooring
- Updated interior
Tags
Property features AI
Finance
- Other: Lot size approximately 0.23 acre (160 x 125); Living area reported as 1,803 sq ft; total building area reported as 2,232 sq ft; Direction the home faces: South
- Financial info: No lease restrictions indicated; Turnkey (furnished)
- HOA & community: Pets allowed; Golf carts allowed
Exterior
- Parking: Converted garage; Attached garage (1 car); Driveway parking; Off-street parking; Guest parking; Oversized parking; Ground-level access
- Security: Smoke detector(s)
- Utilities: Public water; Public sewer; Electricity connected; Cable connected; Broadband/high-speed internet available; Water connected; Sewer connected
- Home design: Single-family residence; One story; South-facing entry
- Construction: Block construction; Metal roof; Slab foundation; Completed condition
- Exterior features: Covered rear porch and patio; Patio; Rear porch; Private pool (gunite, in-ground, with lighting); Exterior lighting; Rain gutters; Storage shed(s); Private mailbox; Mature landscaping and trees; Landscaped lot; Near golf course; Near marina; Paved roads; Located on a cul-de-sac; Flood zone
Interior
- Kitchen: Built-in oven; Dishwasher; Microwave; Range; Refrigerator; Stone counters; Solid wood cabinets
- Bedrooms: 3 bedrooms
- Flooring: Travertine
- Bathrooms: 2 full bathrooms; 1 half bathroom
- Heating & cooling: Central heating (electric); Central air conditioning
- Interior features: Ceiling fans; Open floorplan; Kitchen/family room combo; Living room/dining room combo; Split bedroom layout; Solid wood cabinets; Stone counters; Thermostat; Blinds, rods and shades; Bonus room; Inside utility; Smoke detector(s); Fireplace in family room
- Laundry & utility: Inside laundry room; Washer and dryer included; Electric water heater
Neighborhood map
What this means for you Summary
Snapshot
- This is a 3-bed/2.0-bath single-family listed at $389k.
Deal economics
- At list price, monthly cash flow is $-284 ($-3k/yr) — negative.
- To cash-flow at today's rent, offer at most $339k (12.9% below list).
- To meet the 1% rule (rent ≥ 1% of price), the offer needs to be $333k (14.5% below list).
- Recommended offer: $333k (14.5% below list) — sets the bar for 1% rule.
- Cap rate 6.7% vs local median 3.8% in Englewood — top-decile yield for the area; either an underpriced asset or a hidden risk that comps aren't pricing in. Stress-test before assuming the spread holds.
Location & tenants
- Location reads 73/100 on livability (#321 in FL) — a middle-class / working-renter tenant base. Strengths: housing A+, cost of living A, health & safety A; Watch: employment C-, amenities F, commute F.
- Sarasota (urban): math 63% / reading 63% proficiency, ranked #7 of 73 in FL (top 10%) — acceptable for families but not a draw, mixed tenant base, ~2y average lease.
- Zoned schools: Englewood Elementary School (math 65% / reading 66%, grade B+, #500 of 2,144 statewide, top 24%, 587 students, 52% FRL).
- Market conditions: Rents rising fast (+9.0%/yr); 726 active listings in the ZIP; 11 comparable units currently listed for rent nearby; rentals at typical pace (median 23d on market — plan ~3-4 weeks tenant-placement turnaround); solid renter incomes; 7,466 units permitted in Sarasota County in 2024 (2,138 in 5+ unit buildings).
- At $3,328/mo this rent would consume 53% of the median local household income ($76k/yr) (locally 290% of renters already pay >50% of income on rent) — very limited rent-growth headroom before tenants either downsize or default.
Forward outlook
- Local home prices are declining (-3.0%/yr); year-one equity from $3k of loan paydown is wiped out by about $12k of value loss. Plan a longer hold.
- Sarasota County population projected at +20% by 2050 — long-run rental-demand tailwind backs the buy-and-hold thesis.
Negotiation context
- Only 1 days on market — expect competitive offers; lowballing is unlikely to land.
- 3 sale attempts since 7y ago with the ask held roughly flat each time — persistent listings suggest the price (not the market) is what's stuck; bring a comps-based counter.
Risks & watch-outs
- Watch-outs: flood insurance adds $427/mo.
- Climate carrying-cost: in FEMA flood zone AE (mandatory federal flood insurance); severe wind risk, 99% chance of damaging wind over 30y; extreme-heat days projected 7→29/yr by 2055 (HVAC capex compounding) — expect insurance premiums to compound above CPI over the hold.
Questions for the listing agent
- What do current leases actually rent for vs. the listed asking? Can we see a recent rent roll and the last 12 months of T-12 income?
- Built in 1968 — when were the roof, HVAC, electrical panel, plumbing, and water heater last replaced?
- What's the actual annual flood-insurance premium (NFIP or private), and is the property in a SFHA with mandatory coverage?
- Is there a deadline driving the sale (1031 exchange, divorce, estate, relocation)? That informs how much negotiation room exists.
- Schools are A-rated — typically a magnet for longer-tenancy family renters. What's the average tenant stay here, and is there a school-zone premium baked into asking?
- The area grade is low — what's the realistic commute time and amenity access for the typical tenant pool here? Any planned neighborhood developments (good or bad) we should know about?
- What's the average days-on-market for RENTAL listings here right now (not sales)? A rising rental-DOM trend means longer vacancies and softer asking-rent achievability than the comps imply.
- What's the recent tenant-quality profile in this submarket — average credit score on applications, eviction rate, late-payment / NSF rate, and stable-employment percentage? A property-management company in the area should have these aggregated.
- How much new for-sale + rental construction is in the pipeline within 1–3 miles? Heavy new supply typically softens prices + rents 12–24 months out; constrained supply supports both.
Investment metrics
- 1% rule
- 0.86% ✗
- Cap rate
- 6.73%
- Cash-on-cash
- 1.57%
- DSCR
- 1.07
- GRM
- 9.7
CMA / ARV
- ARV (on-the-fly)
- $288,728
- Comps found
- 3
Show comp detail 3 sales within ~0.75 mi
| Address | Dist | Beds/Ba | Sqft | Sold | Price | $/sf | Match |
|---|---|---|---|---|---|---|---|
| 1220 Greaza St | 0.36mi | 2/2.0 (-1) | 1,527 (+2%) | 17mo | $285,500 | $187 | 61 |
| 1575 Loralin Dr | 0.42mi | 3/2.0 | 1,322 (-12%) | 22mo | $410,000 | $310 | 43 |
| 1720 Florence Ave | 0.48mi | 2/2.0 (-1) | 1,293 (-14%) | 14mo | $250,000 | $193 | 38 |
Match score weights: distance 35% · size 25% · config 20% · recency 20%. Top-matched comps best support the ARV.
Projected returns pro-forma
-3.0% appreciation · 8.0% rent growth · sell at horizon
- IRR
- -15.6%
- Equity multiple
- 0.42×
- Total profit
- $-63,341
- Equity at exit
- $58,001
- IRR
- 0.3%
- Equity multiple
- 1.02×
- Total profit
- $2,365
- Equity at exit
- $33,634
Cash invested: $108,920 (down + closing). Projections, not guarantees.
Landlord ↔ Tenant lean methodology
- Overall (STATE)
- 87 Strongly Landlord-Friendly
- State Florida
- 87 Strongly Landlord-Friendly · R+3
- County
- — inherits STATE
- City
- — inherits STATE
ZIP-level market 34223
- Home prices YoY
- -34.2%
- Rents YoY
- 9.0%
- Active inventory
- 726
- Price-to-rent
- 9.7×
Monthly cashflow live
- Estimated rent
- $3,328 high interval (Pro) →
- Mortgage (P&I)
- −$2,040
- Tax from tax record
- −$284 /mo · $3,409/yr
- Insurance
- −$162
- Flood insurance flood zone
- −$427 /mo · $5,118/yr
- HOA
- −$0
- Vacancy / Maint / Mgmt
- −$699
- Net cashflow
- $-284
Break-even live
Sensitivity live
| Price | -10% $-64 | -5% $-174 | +0% $-284 | +5% $-394 | +10% $-504 |
|---|---|---|---|---|---|
| Rent | -10% $-547 | -5% $-415 | +0% $-284 | +5% $-152 | +10% $-21 |
| Rate | -1.0pp $-88 | -0.5pp $-185 | base $-284 | +0.5pp $-385 | +1.0pp $-487 |
UW: 25.0% down · 7.5% · 30yr · 1.5% tax · 5.0% vac · 8.0% maint · 8.0% mgmt
Financing live
Cash to close
- Down payment
- $97,250
- Closing costs
- $11,670
- Reserves months
- —
- Total cash needed
- —
Loan-product check · same deal, 3 products live
Conventional
25% down · 7.5% · 30yr
- Down + closing
- —
- Monthly P&I
- —
- Monthly cashflow
- —
- DSCR
- —
- Eligible?
- —
Personal DTI + credit; lowest rate.
DSCR
20% down · 8.5% · 30yr
- Down + closing
- —
- Monthly P&I
- —
- Monthly cashflow
- —
- DSCR
- —
- Eligible?
- —
No personal income docs; deal must DSCR.
Hard money
10% down · 12.0% · 12mo
- Down + closing
- —
- Monthly P&I
- —
- Monthly cashflow
- —
- DSCR
- —
- Eligible?
- —
Short-term bridge; refi at stabilization.
Rent comps 11 comps
| Address | Beds | Baths | Sqft | Rent | $/sqft | DOM | Units | Dist |
|---|---|---|---|---|---|---|---|---|
| 1210 S Maryknoll Rd Englewood, FL | 2.0 | 2.0 | 1063 | $2,600 | $2.45 | 23d | 1 | 0.44mi |
| 1575 Loralin Dr Englewood, FL | 3.0 | 2.0 | 1322 | $5,000 | $3.78 | 23d | 1 | 0.44mi |
| 858 E 7th St Englewood, FL | 3.0 | 2.0 | 1244 | $1,995 | $1.60 | 23d | 1 | 0.47mi |
| 1501 Helene Ave Englewood, FL | 3.0 | 2.0 | 1608 | $3,200 | $1.99 | 15d | 1 | 0.52mi |
| 1401 S McCall Rd Unit 301A Englewood, FL | 2.0 | 2.0 | 1093 | $3,300 | $3.02 | 23d | 1 | 0.60mi |
| 1120 Lampp Dr Englewood, FL | 3.0 | 2.0 | 1212 | $4,000 | $3.30 | 23d | 1 | 0.70mi |
| 1531 Placida Rd #204 Englewood, FL | 2.0 | 2.0 | 1056 | $3,500 | $3.31 | 23d | 1 | 0.83mi |
| 1531 Placida Rd #203 Englewood, FL | 2.0 | 2.0 | 1056 | $3,900 | $3.69 | 23d | 1 | 0.83mi |
| 1375 Beach Rd #311 Englewood, FL | 3.0 | 2.0 | 1686 | $4,950 | $2.94 | 23d | 1 | 1.03mi |
| 1081 Humboldt St Englewood, FL | 3.0 | 2.0 | 1838 | $2,400 | $1.31 | 23d | 1 | 1.08mi |
| 2275 S McCall Rd #201 Englewood, FL | 2.0 | 2.0 | 1050 | $2,000 | $1.90 | 15d | 1 | 1.46mi |
Listing history 2 events
-
2026-06-21remarks 693-char remark
-
2026-06-21$389,000 Active 1 DOM
ⓘ Source: listings_history table (triggers on properties + properties_extension) + one-shot
backfill from property_details.listing_events for pre-trigger history.
Tax reassessment forecast FL · Resets to sale price
- Current annual tax
- $3,409 · $284/mo
- Projected year-2 tax
- $3,409 · $284/mo
- Expected delta
- $0/yr ($0/mo · 0.0%)
ⓘ Screening estimate from a state-policy table — verify with the county assessor before closing.
Climate risk First Street
- Flood 8/10 Severe FEMA zone AE · 99% chance over 30 yrs
- Wildfire 3/10 Moderate
- Heat 10/10 Extreme 7 d/yr ≥107°F today · 29 d/yr by 30 yrs out
- Wind 10/10 Extreme 99% chance of damaging wind over 30 yrs
- Air quality 2/10 Low 1 unhealthy d/yr today · 1 by 30 yrs out
Nearby sold comps map
Loading sold comps map…
Walkable amenities ~0.75 mi
Loading nearby amenities…
Taxation est. · year 1
- Rental income
- $39,931
- − Mortgage interest
- −$21,790
- − Property taxes
- −$3,409
- − Insurance
- −$7,064
- − Repairs & maintenance
- −$3,194
- − Management
- −$3,194
- − Depreciation
- −$11,316
- Taxable loss
- −$10,037
- Est. tax savings @ 24.0%
- +$2,409
- After-tax cash flow
- $-998/yr
For passive investors: Depreciation is non-cash, so a rental often shows a tax loss while cash-flowing — sheltering income. Rental losses are passive: they offset passive income freely, and up to $25,000/yr can offset ordinary (W-2) income if you actively participate and your MAGI is under $100k (phasing out to $0 by $150k); unused losses carry forward. On sale, claimed depreciation is recaptured at up to 25%, and gains may owe capital-gains tax (a 1031 exchange can defer both). Figures are a year-1 estimate at your 24.0% rate — not tax advice; consult a CPA.
Schools (NCES district)
- District
- Sarasota
- NCES district ID
- 1201680
- Math proficiency
- 63% ▼ -8.00%
- Reading proficiency
- 63% ▼ -3.00%
- Median HH income
- $51,167
- Composite
- 53.68/100
- National rank
- #1428
- State rank
- #7 of 73 in FL
Livability — Englewood
- Score
- 73/100
- State rank
- #321
- US rank
- #5655
Category grades
Schools grade is shown separately in the Schools card above.
Census & demographics
- Census place
- Englewood, FL
- County
- Sarasota County · 448,376 people
- City population
- 35,420
- Metro
- North Port-Sarasota-Bradenton, FL
- Population (ZIP)
- 19,884
- Household income
- $76,016
- Rent vs Own
- Severe rent burden
- 290.0
Population outlook (Sarasota County) Hauer SSP2
- Today (2025)
- 452,380 people
- By 2030
- 474,175 · +4.8%
- By 2040
- 511,577 · +13.1%
- By 2050
- 541,467 · +19.7%
- By 2075
- 604,947 · +33.7%
- By 2100
- 621,965 · +37.5%
Race, ethnicity, and origin ACS 2023
- Neighborhood character
- Predominantly White (94%)
- Race & ethnicity
- White 94% Two or more races 3% Hispanic / Latino 3% Asian 1%
- Common ancestry
- Romanian 7% Lithuanian 4% Iranian 2%
- Foreign-born
- 9% · Canada
- Languages at home
- 94% English-only · German/W. Germanic 2% Spanish 1% Other Indo-European 1%
Political lean MEDSL · Sarasota
- 2024 margin
- R (+18.2) · D 40.5% · R 58.7%
- 2008→2024 swing
- -18.1pp toward R · 2008: -0.1pp · 2024: -18.2pp
- All cycles
- 2024: R+18.2 2020: R+10.4 2016: R+11.6 2012: R+7.4 2008: R+0.1
Not yet ingested
- Civics
- —
Market trends
- HPI YoY
- ▼ -146.26%
- Current HPI
- 281.0529
- Rent YoY
- ▲ 9.02%
- Metro
- North Port-Sarasota-Bradenton, FL
- State GDP YoY
- ▲ 3.28%
- F500 in state
- 36
Industry mix (Fortune 500 HQ in FL)
| Industry | F500 HQs | Revenue |
|---|---|---|
| Industrial Technology | 2 | $29B |
|
||
| Insurance | 2 | $17B |
|
||
| Retail | 1 | $60B |
|
||
| Technology Distribution | 1 | $58B |
|
||
| Homebuilding | 1 | $35B |
|
||
| Technology Manufacturing | 1 | $35B |
|
||
Price history
+489.4% since first listed20 events — show timeline
- 2026-06-21 Listed $389,000 Stellar MLS as Distributed by MLS Grid
- 2022-02-28 Sold (Public Records) $369,900 Public Records
- 2022-02-28 Sold (MLS) $369,900 Stellar MLS as Distributed by MLS Grid
- 2022-01-17 Pending — Stellar MLS as Distributed by MLS Grid
- 2022-01-09 Listed $369,900 Stellar MLS as Distributed by MLS Grid
- 2019-07-11 Sold (Public Records) $215,000 Public Records
- 2019-07-10 Sold (MLS) $215,000 Stellar MLS as Distributed by MLS Grid
- 2019-05-19 Pending — Stellar MLS as Distributed by MLS Grid
- 2019-05-03 Price Changed $212,000 Stellar MLS as Distributed by MLS Grid
- 2019-04-19 Price Changed $215,000 Stellar MLS as Distributed by MLS Grid
- 2019-04-12 Price Changed $296,500 Stellar MLS as Distributed by MLS Grid
- 2019-03-30 Price Changed $297,500 Stellar MLS as Distributed by MLS Grid
- 2019-03-21 Price Changed $298,500 Stellar MLS as Distributed by MLS Grid
- 2019-03-15 Price Changed $299,500 Stellar MLS as Distributed by MLS Grid
- 2019-03-08 Price Changed $313,000 Stellar MLS as Distributed by MLS Grid
- 2019-03-02 Price Changed $315,000 Stellar MLS as Distributed by MLS Grid
- 2019-02-22 Price Changed $317,000 Stellar MLS as Distributed by MLS Grid
- 2019-02-14 Listed $319,000 Stellar MLS as Distributed by MLS Grid
- 2002-12-09 Sold (Public Records) $113,000 Public Records
- 1987-06-01 Sold (Public Records) $66,000 Public Records
Property tax history
+5.5%/yrLatest (2025): $3,409 · -3.1% YoY. Source: county tax records.
Cash-flow waterfall
monthlySold comps — $/sqft
last 12 mo · ≤1 miLoading sold comps…