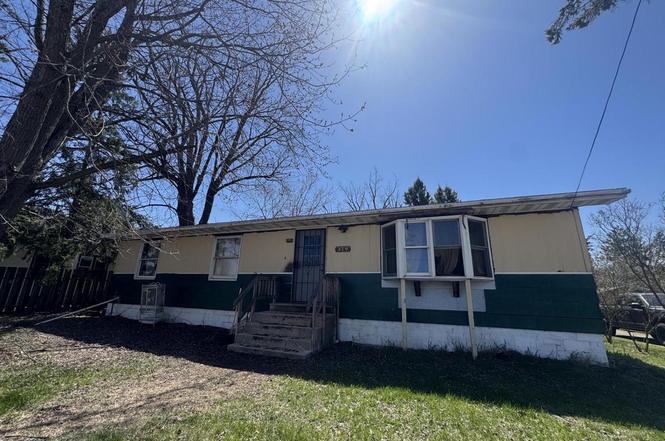
319 E Algoma St · Suring, WI
Flood risk 1/10 · Minimal
- FEMA flood zone
- X (unshaded)
- Chance of flooding over 30 yrs
- 0.0%
- Est. flood insurance / yr
- $473 – $860
Fire risk 3/10 · Minor
- Est. fire insurance / yr
- $636 – $1,182
Heat risk 1/10 · Minimal
- Hot days now (above 97°F)
- 7 days/yr
- Hot days in 30 yrs
- 12 days/yr
Wind risk 1/10 · Minimal
- Chance of severe wind over 30 yrs
- —
Air-quality risk 2/10 · Minimal
- Unhealthy air days now
- 0 days/yr
- Unhealthy air days in 30 yrs
- 1 days/yr
Risk factors via First Street. Map © Google.
Why this score? — see what drove the B- grade
The composite is a weighted blend of 9 inputs, each scored 0–100. Each bar is that input's sub-score; the figure is the points it added to the 100-point composite (weight × sub-score).
- Cash flow +25.0/30.0
- Appreciation +8.6/10.0
- DSCR +8.1/10.0
- ARV discount +7.5/15.0
- 1% rule +6.2/10.0
- Livability +3.2/5.0
- Rent growth +2.5/5.0
- Condition / age +2.5/5.0
- Schools +2.0/10.0
$109,900
🖨 Deal sheet 📄 Offer letter ✓ Due diligence
Listing remarks
Some enjoy living in the heart of Suring right across from the School. This home has 3 bedroom 2 full bath with 1974 sq ft. Home needs some love and care and a very good cleaning! Master has full master bath. Main bath updated with walk in shower. Kitchen open with large island and lots of counter space. Lower level has finished kitchen area with stove and refrigerator. 2 other rooms could be extra living/family room and a office area. The Lower level rooms have concrete block walls. Partially finished area with work bench and space for tools. Back doors leads to back yard with small chain and link fence. Extra parking in back and canvas storage shed included in sale. Come fix up and make t
Key facts
- Extra parking
- Canvas storage shed
- Large island
Tags
Property features AI
Exterior
- Utilities: Municipal water; Municipal sewer
- Home design: Single-family, 1-story home; Construction completed
- Construction: Finished above-grade and below-grade living areas (finished below-grade area about 630); Estimated finished area range: 1,751–2,000 square feet
- Exterior features: Aluminum/steel and vinyl exterior; Lot is approximately 0.22 acres (< 1/2 acre); Residential zoning
Interior
- Kitchen: Kitchen on main level (12 x 13)
- Bedrooms: Master bedroom on main level (13 x 12); Bedroom 2 on main level (10 x 10); Bedroom 3 on main level (10 x 10)
- Bathrooms: Two full bathrooms
- Heating & cooling: Forced air heating; Natural gas heat
- Interior features: Full, partially finished block basement; Bonus room in the garage (15 x 15); Den/office on lower level (15 x 15); Living room on main level (14 x 21)
Neighborhood map
What this means for you Summary
Snapshot
- This is a 3-bed/2.0-bath single-family listed at $110k.
Deal economics
- At list price, monthly cash flow is $238 ($3k/yr) — positive.
- The deal already cash-flows at list — no discount required.
- Meets the 1% rule at list price ($1k rent vs $110k).
- Recommended offer: $100k (9.0% below list) — sets the bar for market timing.
Location & tenants
- Location reads 63/100 on livability (#591 in WI) — a middle-class / working-renter tenant base. Strengths: cost of living A+, housing A-; Watch: crime C-, schools F, amenities F.
- Suring Public School District (rural): math 15% / reading 25% proficiency, ranked #413 of 426 in WI (top 97%) — low school quality limits family demand, transient renter base, plan for 1-2y turnover.
- Market conditions: 15 active listings in the ZIP; 132 units permitted in Oconto County in 2024 (0 in 5+ unit buildings).
Forward outlook
- In year one you build about $9k of equity ($760 loan paydown + $8k appreciation (7.2% local appreciation)).
- Oconto County population projected at -20% by 2050 — secular population decline; favor cash flow + early exit over multi-decade hold.
- At projected returns (7.2% appreciation + 3.0% rent growth), your $31k cash investment doubles in ~3 years — after that, you're playing with house money.
- By year 5, paydown + projected appreciation supports a ~$39k cash-out refi (75% LTV) — recoverable capital for the next deal without selling this one.
Negotiation context
- It's been on market 111 days — a 9% lower offer ($100k) is reasonable based on typical stale-listing flexibility.
Questions for the listing agent
- It's been on market 111 days. Have you received any prior offers? Is the seller open to a 9% concession, seller financing, or rate buy-down credit?
- Built in 1979 — when were the roof, HVAC, electrical panel, plumbing, and water heater last replaced?
- Why hasn't it sold? Are there any deal-killer items the seller is aware of (foundation, flood, title, zoning, code violations)?
- Is there a deadline driving the sale (1031 exchange, divorce, estate, relocation)? That informs how much negotiation room exists.
- Schools are F-rated, which usually means shorter tenancies and higher turnover. Who's the typical renter profile here, and what's been the actual vacancy rate?
- What's the average days-on-market for RENTAL listings here right now (not sales)? A rising rental-DOM trend means longer vacancies and softer asking-rent achievability than the comps imply.
- What's the recent tenant-quality profile in this submarket — average credit score on applications, eviction rate, late-payment / NSF rate, and stable-employment percentage? A property-management company in the area should have these aggregated.
- How much new for-sale + rental construction is in the pipeline within 1–3 miles? Heavy new supply typically softens prices + rents 12–24 months out; constrained supply supports both.
Investment metrics
- 1% rule
- 1.12% ✓
- Cap rate
- 8.89%
- Cash-on-cash
- 9.27%
- DSCR
- 1.41
- GRM
- 7.4
CMA / ARV
- ARV (on-the-fly)
- $227,010
- Comps found
- 1
Show comp detail 1 sale within ~0.75 mi
| Address | Dist | Beds/Ba | Sqft | Sold | Price | $/sf | Match |
|---|---|---|---|---|---|---|---|
| 318 N Barkman St | 0.49mi | 4/2.0 (+1) | 1,703 (-14%) | 20mo | $195,000 | $115 | 32 |
Match score weights: distance 35% · size 25% · config 20% · recency 20%. Top-matched comps best support the ARV.
Projected returns pro-forma
7.18% appreciation · 3.0% rent growth · sell at horizon
- IRR
- 25.5%
- Equity multiple
- 2.78×
- Total profit
- $54,761
- Equity at exit
- $77,472
- IRR
- 23.4%
- Equity multiple
- 5.80×
- Total profit
- $147,740
- Equity at exit
- $148,369
Cash invested: $30,772 (down + closing). Projections, not guarantees.
Landlord ↔ Tenant lean methodology
- Overall (STATE)
- 73 Landlord-Friendly
- State Wisconsin
- 73 Landlord-Friendly · R+2
- County
- — inherits STATE
- City
- — inherits STATE
ZIP-level market 54174
- Home prices YoY
- 2.4%
- Active inventory
- 15
- Price-to-rent
- 7.4×
Monthly cashflow live
- Estimated rent
- $1,235 medium interval (Pro) →
- Mortgage (P&I)
- −$576
- Tax from tax record
- −$115 /mo · $1,386/yr
- Insurance
- −$46
- HOA
- −$0
- Vacancy / Maint / Mgmt
- −$259
- Net cashflow
- $238
Break-even live
UW: 25.0% down · 7.5% · 30yr · 1.5% tax · 5.0% vac · 8.0% maint · 8.0% mgmt
Financing live
Cash to close
- Down payment
- $27,475
- Closing costs
- $3,297
- Reserves months
- —
- Total cash needed
- —
Loan-product check · same deal, 3 products live
Conventional
25% down · 7.5% · 30yr
- Down + closing
- —
- Monthly P&I
- —
- Monthly cashflow
- —
- DSCR
- —
- Eligible?
- —
Personal DTI + credit; lowest rate.
DSCR
20% down · 8.5% · 30yr
- Down + closing
- —
- Monthly P&I
- —
- Monthly cashflow
- —
- DSCR
- —
- Eligible?
- —
No personal income docs; deal must DSCR.
Hard money
10% down · 12.0% · 12mo
- Down + closing
- —
- Monthly P&I
- —
- Monthly cashflow
- —
- DSCR
- —
- Eligible?
- —
Short-term bridge; refi at stabilization.
Listing history 18 events
-
2026-06-18days on market $109,900 Active 111 DOM
-
2026-06-17days on market $109,900 Active 110 DOM
-
2026-06-16days on market $109,900 Active 109 DOM
-
2026-06-15days on market $109,900 Active 108 DOM
-
2026-06-15days on market $109,900 Active 107 DOM
-
2026-06-13days on market $109,900 Active 106 DOM
-
2026-06-12days on market $109,900 Active 105 DOM
-
2026-06-09days on market $109,900 Active 102 DOM
-
2026-06-08days on market $109,900 Active 101 DOM
-
2026-06-08days on market $109,900 Active 100 DOM
-
2026-06-05days on market $109,900 Active 98 DOM
-
2026-06-04days on market $109,900 Active 97 DOM
-
2026-06-03days on market $109,900 Active 96 DOM
-
2026-06-02days on market $109,900 Active 95 DOM
-
2026-06-01days on market $109,900 Active 94 DOM
-
2026-05-31days on market $109,900 Active 93 DOM
-
2026-02-27$109,900 Active
-
2025-02-17soldstatus $115,500
ⓘ Source: listings_history table (triggers on properties + properties_extension) + one-shot
backfill from property_details.listing_events for pre-trigger history.
Tax reassessment forecast WI · Partial reset (capped growth)
- Current annual tax
- $1,386 · $115/mo
- Projected year-2 tax
- $1,709 · $142/mo
- Expected delta
- +$324/yr (+$27/mo · 23.4%)
ⓘ Screening estimate from a state-policy table — verify with the county assessor before closing.
Climate risk First Street
- Flood 1/10 Low FEMA zone X (unshaded) · 0% chance over 30 yrs
- Wildfire 3/10 Moderate
- Heat 1/10 Low 7 d/yr ≥97°F today · 12 d/yr by 30 yrs out
- Wind 1/10 Low
- Air quality 2/10 Low 0 unhealthy d/yr today · 1 by 30 yrs out
Nearby sold comps map
Loading sold comps map…
Walkable amenities ~0.75 mi
Loading nearby amenities…
Taxation est. · year 1
- Rental income
- $14,816
- − Mortgage interest
- −$6,156
- − Property taxes
- −$1,386
- − Insurance
- −$550
- − Repairs & maintenance
- −$1,185
- − Management
- −$1,185
- − Depreciation
- −$3,197
- Taxable income
- $1,157
- Est. tax owed @ 24.0%
- −$278
- After-tax cash flow
- $2,576/yr
For passive investors: Depreciation is non-cash, so a rental often shows a tax loss while cash-flowing — sheltering income. Rental losses are passive: they offset passive income freely, and up to $25,000/yr can offset ordinary (W-2) income if you actively participate and your MAGI is under $100k (phasing out to $0 by $150k); unused losses carry forward. On sale, claimed depreciation is recaptured at up to 25%, and gains may owe capital-gains tax (a 1031 exchange can defer both). Figures are a year-1 estimate at your 24.0% rate — not tax advice; consult a CPA.
Schools (NCES district)
- District
- Suring Public School District
- NCES district ID
- 5514700
- Math proficiency
- 15% ▼ -10.00%
- Reading proficiency
- 25% ▼ -5.00%
- Median HH income
- $40,825
- Composite
- 20.26/100
- National rank
- #13825
- State rank
- #413 of 426 in WI
Livability — Suring
- Score
- 63/100
- State rank
- #591
- US rank
- #15184
Category grades
Schools grade is shown separately in the Schools card above.
Census & demographics
- Census place
- Suring, WI
- Population (ZIP)
- 3,124
Population outlook (Oconto County) Hauer SSP2
- Today (2025)
- 36,829 people
- By 2030
- 35,853 · -2.7%
- By 2040
- 32,932 · -10.6%
- By 2050
- 29,355 · -20.3%
- By 2075
- 22,731 · -38.3%
- By 2100
- 16,736 · -54.6%
Race, ethnicity, and origin ACS 2023
- Neighborhood character
- Predominantly White (88%)
- Race & ethnicity
- White 88% Native American 7% Two or more races 3% Hispanic / Latino 2%
- Common ancestry
- Romanian 8% Lithuanian 4% Portuguese 3%
- Foreign-born
- 1% · Canada
- Languages at home
- 98% English-only · Spanish 1%
Political lean MEDSL · Oconto
- 2024 margin
- Solid R (+43.0) · D 28.0% · R 71.0%
- 2008→2024 swing
- -49.2pp toward R · 2008: 6.2pp · 2024: -43.0pp
- All cycles
- 2024: R+43.0 2020: R+41.0 2016: R+37.0 2012: R+9.5 2008: D+6.2
Not yet ingested
- Civics
- —
Market trends
- HPI YoY
- ▲ 7.18%
- Current HPI
- 301.3247
- Rent YoY
- —
- Metro
- —
- State GDP YoY
- ▲ 2.10%
- F500 in state
- 20
Industry mix (Fortune 500 HQ in WI)
| Industry | F500 HQs | Revenue |
|---|---|---|
| Industrial Machinery | 4 | $23B |
|
||
| Industrial Technology | 2 | $36B |
|
||
| Insurance | 1 | $36B |
|
||
| Professional Services | 1 | $19B |
|
||
| Utilities | 1 | $9B |
|
||
| Consumer Goods | 1 | $3B |
|
||
Price history
-4.8% since first listed2 events — show timeline
- 2026-02-27 Listed $109,900 RANW
- 2025-02-17 Sold (Public Records) $115,500 Public Records
Property tax history
+1.6%/yrLatest (2025): $1,386 · +1.7% YoY. Source: county tax records.
Cash-flow waterfall
monthlySold comps — $/sqft
last 12 mo · ≤1 miLoading sold comps…