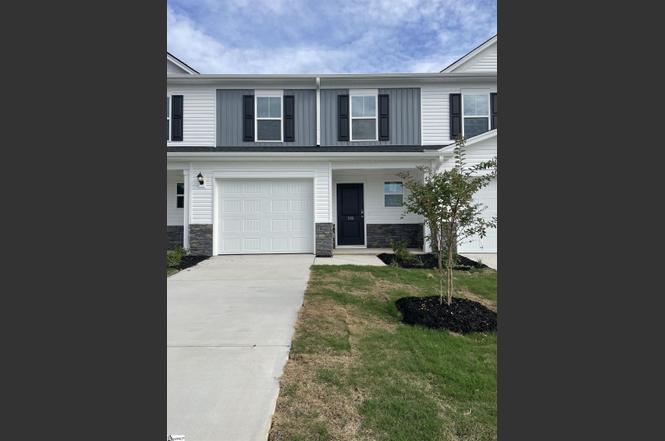
106 Mclauren Pl · Fountain Inn, SC
Flood risk No data
- FEMA flood zone
- —
- Chance of flooding over 30 yrs
- —
- Est. flood insurance / yr
- —
Fire risk No data
- Est. fire insurance / yr
- —
Heat risk No data
- Hot days now (above threshold)
- —
- Hot days in 30 yrs
- —
Wind risk No data
- Chance of severe wind over 30 yrs
- —
Air-quality risk No data
- Unhealthy air days now
- —
- Unhealthy air days in 30 yrs
- —
Risk factors via First Street. Map © Google.
Why this score? — see what drove the D- grade
The composite is a weighted blend of 9 inputs, each scored 0–100. Each bar is that input's sub-score; the figure is the points it added to the 100-point composite (weight × sub-score).
- Cash flow +10.6/30.0
- ARV discount +6.1/15.0
- Schools +4.2/10.0
- Livability +4.1/5.0
- Rent growth +3.6/5.0
- DSCR +3.1/10.0
- 1% rule +2.8/10.0
- Condition / age +2.5/5.0
- Appreciation +0.0/10.0
$229,900
🖨 Deal sheet (PDF) 📄 Offer letter ✓ Due diligence
Listing remarks
Come home to a quaint community of 51 Townhomes. Open floor plans with large kitchen for entertaining family and friends, The kitchen has lots of counter space with quartz countertops, stainless appliances to include a 5 burner gas range, dishwasher, microwave and refrigerator. You'll also love the built-in trash containers. To top this off, there is also a large walk-in pantry. White shaker style cabinets for easy decorating with your favorite accent colors. Hard surface flooring in the main living areas are easy to clean and water resistant. Design package to include pendant lighting in the kitchen with ample puck lighting and a ceiling fan in the living area. There is also a powder room
Key facts
- Quartz countertops
- Stainless appliances
- Large kitchen
Tags
Property features AI
Finance
- HOA & community: Homeowners association in place; HOA covers common area insurance and electricity, lawn maintenance, street lights, termite contract, bylaws, and restrictive covenants; Community amenities include lights, some sidewalks, lawn maintenance, private roads, and landscape maintenance
Exterior
- Parking: Attached 1-car garage with door opener; Paved concrete driveway
- Security: Smoke detectors (interior)
- Utilities: Public water; Public sewer; Public garbage pickup; Gas tankless water heater; Attached garage (power available)
- Home design: Two-story home; New construction (approximate year built 2026); Model: Stoneycree; Never lived in
- Construction: Architectural roof; Slab foundation; Built by Veranda Homes, LLC; Attic and garage provide additional storage
- Exterior features: Front porch; Patio; Stone and vinyl siding exterior; Level lot with underground utilities; Lot dimensions approximately 24 x 100
Interior
- Kitchen: Dishwasher; Disposal; Gas range (stand alone); Built-in microwave; Refrigerator; Kitchen approx. 10 x 10
- Bedrooms: Primary bedroom on 2nd level with double sink, full bath, shower only, and walk-in closet; Second bedroom approximately 10 x 13; Third bedroom approximately 10 x 12; Primary bedroom size approximately 17 x 12
- Flooring: Carpet; Laminate flooring; Vinyl; Luxury vinyl tile/plank
- Bathrooms: Two full bathrooms; One half bathroom
- Heating & cooling: Forced air heating (natural gas) with damper control; Central electric cooling with damper control
- Interior features: Attic with pull-down stairs; Cable available; Ceiling fans; Smooth ceilings; Open floor plan; Smoke detectors; Walk-in closets; Quartz countertops; Walk-in pantry; Radon mitigation system; Window treatments remain
- Laundry & utility: Laundry on 2nd floor in closet-style area; Washer connection; Electric hookup for dryer
Neighborhood map
What this means for you Summary
Snapshot
- This is a 3-bed/2.5-bath townhouse listed at $230k.
Deal economics
- At list price, monthly cash flow is $-112 ($-1k/yr) — negative.
- To cash-flow at today's rent, offer at most $210k (8.6% below list).
- To meet the 1% rule (rent ≥ 1% of price), the offer needs to be $180k (21.7% below list).
- Recommended offer: $180k (21.7% below list) — sets the bar for 1% rule.
- Cap rate 5.7% vs local median 4.2% in Fountain Inn — top-decile yield for the area; either an underpriced asset or a hidden risk that comps aren't pricing in. Stress-test before assuming the spread holds.
Location & tenants
- Location reads 82/100 on livability (#4 in SC, #1,162 nationally) — a professional / high-income tenant draw. Strengths: crime A+, cost of living A+, housing A+; Watch: commute F.
- Greenville 01 (suburban): math 44% / reading 54% proficiency, ranked #10 of 80 in SC (top 12%) — families likely to look elsewhere, expect single-tenant / working-renter base with shorter leases.
- Zoned schools: Fountain Inn Elementary (math 48% / reading 47%, grade D, #199 of 597 statewide, top 35%, 835 students, 100% FRL) — zoned schools average 100% FRL vs 42% district-wide (58 pts higher); higher-poverty schools than district average — tighter screening recommended.
- Market conditions: Rents rising fast (+4.5%/yr); 484 active listings in the ZIP; 6 comparable units currently listed for rent nearby; rentals leasing fast (median 4d on market — plan ~1-2 weeks tenant-placement turnaround); 621 units permitted in Laurens County in 2024 (0 in 5+ unit buildings).
- This rent runs 31% of the median local income ($70k/yr) — at the standard rent-burdened threshold; future hikes will face affordability resistance.
Forward outlook
- Local home prices are declining (-3.0%/yr); year-one equity from $2k of loan paydown is wiped out by about $7k of value loss. Plan a longer hold.
- Laurens County population projected to shrink 7% by 2050 — rents likely to lag national; underwrite the cash flow, not the appreciation.
Negotiation context
- Only 11 days on market — expect competitive offers; lowballing is unlikely to land.
- 2 sale attempts with the ask held roughly flat each time — persistent listings suggest the price (not the market) is what's stuck; bring a comps-based counter.
Questions for the listing agent
- What do current leases actually rent for vs. the listed asking? Can we see a recent rent roll and the last 12 months of T-12 income?
- What does the HOA fee cover, when was the last increase, and are there any pending special assessments or reserve-fund shortfalls?
- Is there a deadline driving the sale (1031 exchange, divorce, estate, relocation)? That informs how much negotiation room exists.
- The area grade is low — what's the realistic commute time and amenity access for the typical tenant pool here? Any planned neighborhood developments (good or bad) we should know about?
- What's the average days-on-market for RENTAL listings here right now (not sales)? A rising rental-DOM trend means longer vacancies and softer asking-rent achievability than the comps imply.
- What's the recent tenant-quality profile in this submarket — average credit score on applications, eviction rate, late-payment / NSF rate, and stable-employment percentage? A property-management company in the area should have these aggregated.
- How much new for-sale + rental construction is in the pipeline within 1–3 miles? Heavy new supply typically softens prices + rents 12–24 months out; constrained supply supports both.
Investment metrics
- 1% rule
- 0.78% ✗
- Cap rate
- 5.71%
- Cash-on-cash
- -2.09%
- DSCR
- 0.91
- GRM
- 10.6
CMA / ARV
- ARV (on-the-fly)
- $223,203
- Comps found
- 12
Show comp detail 12 sales within ~0.75 mi
| Address | Dist | Beds/Ba | Sqft | Sold | Price | $/sf | Match |
|---|---|---|---|---|---|---|---|
| 112 Mclauren Pl | 0.01mi | 3/2.5 | 1,593 (+1%) | 2mo | $232,710 | $146 | 96 |
| 116 Mclauren Pl | 0.02mi | 3/2.5 | 1,615 (+2%) | 1mo | $238,071 | $147 | 95 |
| 102 Mclauren Pl | 0.01mi | 3/2.5 | 1,615 (+2%) | 3mo | $225,710 | $140 | 94 |
| 108 Mclauren Pl | 0.00mi | 3/2.5 | 1,615 (+2%) | 3mo | $225,710 | $140 | 94 |
| 120 Mclauren Pl | 0.03mi | 3/2.5 | 1,615 (+2%) | 2mo | $225,710 | $140 | 93 |
| 209 Higher Ct | 0.04mi | 3/2.5 | 1,615 (+2%) | 4mo | $214,900 | $133 | 92 |
| 203 Higher Ct | 0.03mi | 3/2.5 | 1,593 (+1%) | 8mo | $225,710 | $142 | 92 |
| 128 Cillian St | 0.04mi | 3/2.5 | 1,593 (+1%) | 8mo | $221,210 | $139 | 91 |
| 132 Cillian St | 0.04mi | 3/2.5 | 1,615 (+2%) | 5mo | $210,000 | $130 | 91 |
| 129 Cillian St | 0.02mi | 3/2.5 | 1,615 (+2%) | 7mo | $227,710 | $141 | 90 |
| 124 Cillian St | 0.05mi | 3/2.5 | 1,615 (+2%) | 7mo | $227,710 | $141 | 88 |
| 123 Cillian St | 0.04mi | 3/2.5 | 1,615 (+2%) | 9mo | $237,710 | $147 | 88 |
Match score weights: distance 35% · size 25% · config 20% · recency 20%. Top-matched comps best support the ARV.
Projected returns pro-forma
-3.0% appreciation · 4.55% rent growth · sell at horizon
- IRR
- -18.1%
- Equity multiple
- 0.35×
- Total profit
- $-41,540
- Equity at exit
- $34,279
- IRR
- -7.7%
- Equity multiple
- 0.48×
- Total profit
- $-33,306
- Equity at exit
- $19,878
Cash invested: $64,372 (down + closing). Projections, not guarantees.
Landlord ↔ Tenant lean methodology
- Overall (STATE)
- 90 Strongly Landlord-Friendly
- State South Carolina
- 90 Strongly Landlord-Friendly · R+6
- County
- — inherits STATE
- City
- — inherits STATE
ZIP-level market 29644
- Home prices YoY
- -28.6%
- Rents YoY
- 4.5%
- Active inventory
- 484
- Price-to-rent
- 10.6×
Monthly cashflow live
- Estimated rent
- $1,800 high interval (Pro) →
- Mortgage (P&I)
- −$1,206
- Tax from tax record
- −$83 /mo · $991/yr
- Insurance
- −$96
- HOA
- −$150
- Vacancy / Maint / Mgmt
- −$378
- Net cashflow
- $-112
Break-even live
Sensitivity live
| Price | -10% $18 | -5% $-47 | +0% $-112 | +5% $-177 | +10% $-242 |
|---|---|---|---|---|---|
| Rent | -10% $-254 | -5% $-183 | +0% $-112 | +5% $-41 | +10% $30 |
| Rate | -1.0pp $4 | -0.5pp $-53 | base $-112 | +0.5pp $-172 | +1.0pp $-232 |
UW: 25.0% down · 7.5% · 30yr · 1.5% tax · 5.0% vac · 8.0% maint · 8.0% mgmt
Financing live
Cash to close
- Down payment
- $57,475
- Closing costs
- $6,897
- Reserves months
- —
- Total cash needed
- —
Loan-product check · same deal, 3 products live
Conventional
25% down · 7.5% · 30yr
- Down + closing
- —
- Monthly P&I
- —
- Monthly cashflow
- —
- DSCR
- —
- Eligible?
- —
Personal DTI + credit; lowest rate.
DSCR
20% down · 8.5% · 30yr
- Down + closing
- —
- Monthly P&I
- —
- Monthly cashflow
- —
- DSCR
- —
- Eligible?
- —
No personal income docs; deal must DSCR.
Hard money
10% down · 12.0% · 12mo
- Down + closing
- —
- Monthly P&I
- —
- Monthly cashflow
- —
- DSCR
- —
- Eligible?
- —
Short-term bridge; refi at stabilization.
Rent comps 6 comps
| Address | Beds | Baths | Sqft | Rent | $/sqft | DOM | Units | Dist |
|---|---|---|---|---|---|---|---|---|
| 201 Chapman Rd Fountain Inn, SC | 2.0–3.0 | 2.0 | 1236 | $1,074 | $0.87 | 4d | 1 | 0.39mi |
| 205 Chapman Rd Fountain Inn, SC | 2.0 | 1.0 | 1157 | $982 | $0.85 | 4d | 1 | 0.44mi |
| 40 Fernhill Ln Fountain Inn, SC | 3.0 | 3.0 | 1983 | $1,900 | $0.96 | 4d | 1 | 0.54mi |
| 7 Gramercy Woods Ln Fountain Inn, SC | 3.0–5.0 | 2.5–3.0 | 1967 | $2,224 | $1.13 | 4d | 13 | 0.79mi |
| 217 N Nelson Dr Fountain Inn, SC | 3.0–4.0 | 2.5–3.5 | 2115 | $2,100 | $0.99 | 4d | 12 | 1.12mi |
| 108 Forrest Dr Fountain Inn, SC | 2.0 | 2.0 | 1104 | $1,495 | $1.35 | 13d | 1 | 1.38mi |
HOA detail
- Monthly dues
- $150 · $1,800/yr
- Likely covers
- watertrashgas
Listing history 8 events
-
2026-06-22days on market $229,900 Active 11 DOM
-
2026-06-18days on market $229,900 Active 8 DOM
-
2026-06-17days on market $229,900 Active 7 DOM
-
2026-06-16days on market $229,900 Active 6 DOM
-
2026-06-15days on market $229,900 Active 5 DOM
-
2026-06-13days on market $229,900 Active 3 DOM
-
2026-06-13remarks 699-char remark
-
2026-06-13$229,900 Active 2 DOM
ⓘ Source: listings_history table (triggers on properties + properties_extension) + one-shot
backfill from property_details.listing_events for pre-trigger history.
Tax reassessment forecast SC · Resets to sale price
- Current annual tax
- $991 · $83/mo
- Projected year-2 tax
- $1,310 · $109/mo
- Expected delta
- +$319/yr (+$27/mo · 32.2%)
ⓘ Screening estimate from a state-policy table — verify with the county assessor before closing.
Nearby sold comps map
Loading sold comps map…
Walkable amenities ~0.75 mi
Loading nearby amenities…
Taxation est. · year 1
- Rental income
- $21,601
- − Mortgage interest
- −$12,878
- − Property taxes
- −$991
- − Insurance
- −$1,150
- − Repairs & maintenance
- −$1,728
- − Management
- −$1,728
- − HOA
- −$1,800
- − Depreciation
- −$6,688
- Taxable loss
- −$5,362
- Est. tax savings @ 24.0%
- +$1,287
- After-tax cash flow
- $-57/yr
For passive investors: Depreciation is non-cash, so a rental often shows a tax loss while cash-flowing — sheltering income. Rental losses are passive: they offset passive income freely, and up to $25,000/yr can offset ordinary (W-2) income if you actively participate and your MAGI is under $100k (phasing out to $0 by $150k); unused losses carry forward. On sale, claimed depreciation is recaptured at up to 25%, and gains may owe capital-gains tax (a 1031 exchange can defer both). Figures are a year-1 estimate at your 24.0% rate — not tax advice; consult a CPA.
Schools (NCES district)
- District
- Greenville 01
- NCES district ID
- 4502310
- Math proficiency
- 44% ▼ -10.00%
- Reading proficiency
- 54% ▼ -2.00%
- Median HH income
- $49,596
- Composite
- 41.88/100
- National rank
- #3370
- State rank
- #10 of 80 in SC
Livability — Fountain Inn
- Score
- 82/100
- State rank
- #4
- US rank
- #1162
Category grades
Schools grade is shown separately in the Schools card above.
Census & demographics
- Census place
- Fountain Inn, SC
- County
- Greenville County · 573,815 people
- City population
- 22,907
- Metro
- Greenville-Anderson, SC
- Population (ZIP)
- 22,907
- Household income
- $70,301
- Rent vs Own
- Severe rent burden
- 475.0
Population outlook (Laurens County) Hauer SSP2
- Today (2025)
- 66,741 people
- By 2030
- 66,454 · -0.4%
- By 2040
- 64,881 · -2.8%
- By 2050
- 61,941 · -7.2%
- By 2075
- 53,266 · -20.2%
- By 2100
- 41,495 · -37.8%
Race, ethnicity, and origin ACS 2023
- Neighborhood character
- Predominantly White (66%)
- Race & ethnicity
- White 66% Black 18% Two or more races 10% Hispanic / Latino 10%
- Hispanic origin (detail)
- Mexican 3% Puerto Rican 2%
- Common ancestry
- Slovak 3% Romanian 2% Lithuanian 2%
- Foreign-born
- 6% · Canada, Jamaica
- Languages at home
- 89% English-only · Spanish 9% Tagalog/Filipino 1%
Political lean MEDSL · Laurens
- 2024 margin
- Solid R (+40.9) · D 29.0% · R 69.9% · Other 1.1%
- 2008→2024 swing
- -22.8pp toward R · 2008: -18.1pp · 2024: -40.9pp
- All cycles
- 2024: R+40.9 2020: R+32.3 2016: R+29.9 2012: R+17.5 2008: R+18.1
Not yet ingested
- Civics
- —
Market trends
- HPI YoY
- ▼ -100.45%
- Current HPI
- 250.5271
- Rent YoY
- ▲ 4.55%
- Metro
- Greenville-Anderson, SC
- State GDP YoY
- ▲ 4.51%
- F500 in state
- 2
Industry mix (Fortune 500 HQ in SC)
| Industry | F500 HQs | Revenue |
|---|---|---|
| Packaging | 1 | $7B |
|
||
Price history
-82.8% since first listed6 events — show timeline
- 2026-06-10 Listed $229,900 Greater Greenville MLS
- 2026-03-14 Listing Removed — Greater Greenville MLS
- 2026-03-04 Price Changed $220,710 Greater Greenville MLS
- 2026-02-26 Price Changed $215,710 Greater Greenville MLS
- 2026-02-17 Listed $213,710 Greater Greenville MLS
- 2025-04-09 Sold (Public Records) $1,334,000 Public Records
Property tax history
+1.8%/yrLatest (2025): $991 · +1.8% YoY. Source: county tax records.
Cash-flow waterfall
monthlySold comps — $/sqft
last 12 mo · ≤1 miLoading sold comps…