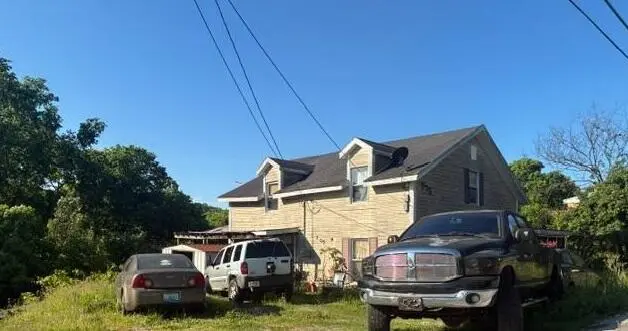
705 Hillcrest Ave · Frankfort, KY
Flood risk 1/10 · Minimal
- FEMA flood zone
- X (unshaded)
- Chance of flooding over 30 yrs
- 0.0%
- Est. flood insurance / yr
- $473 – $860
Fire risk 3/10 · Minor
- Est. fire insurance / yr
- $839 – $1,559
Heat risk 4/10 · Minor
- Hot days now (above 103°F)
- 7 days/yr
- Hot days in 30 yrs
- 19 days/yr
Wind risk 2/10 · Minimal
- Chance of severe wind over 30 yrs
- 1.0%
Air-quality risk 2/10 · Minimal
- Unhealthy air days now
- 1 days/yr
- Unhealthy air days in 30 yrs
- 2 days/yr
Risk factors via First Street. Map © Google.
Why this score? — see what drove the C grade
The composite is a weighted blend of 9 inputs, each scored 0–100. Each bar is that input's sub-score; the figure is the points it added to the 100-point composite (weight × sub-score).
- Cash flow +23.3/30.0
- DSCR +7.5/10.0
- ARV discount +7.5/15.0
- 1% rule +5.4/10.0
- Rent growth +4.1/5.0
- Livability +3.7/5.0
- Schools +2.7/10.0
- Condition / age +2.5/5.0
- Appreciation +0.0/10.0
$90,000
🖨 Deal sheet 📄 Offer letter ✓ Due diligence
Listing remarks
OWNER OCCUPIED!!!! This home is being sold at Auction!!! Lovely home with basement located in Frankfort. One and half story home with cover porch!!!! See remarks on how and where to bid on home.
Key facts
- 0.25 acre lot
- Listed 41 days
Property features AI
Finance
- Other: Lot is approximately 0.25 acres (public records)
Exterior
- Utilities: Sewer: Other
- Home design: House; One and one-half stories
- Construction: Built with vinyl siding and other materials; Block foundation; Approximately 1,400 building area
- Exterior features: Public water; Not on waterfront; No notable view
Interior
- Bedrooms: 2 total rooms (includes bedrooms and other living spaces)
- Bathrooms: 1 full bathroom
- Interior features: Unfinished basement; No fireplace
Neighborhood map
What this means for you Summary
Snapshot
- This is a 1-bed/1.0-bath single-family listed at $90k.
Deal economics
- At list price, monthly cash flow is $164 ($2k/yr) — positive.
- The deal already cash-flows at list — no discount required.
- Meets the 1% rule at list price ($935 rent vs $90k).
- Recommended offer: $87k (3.0% below list) — sets the bar for market timing.
- Cap rate 8.5% vs local median 3.3% in Frankfort — top-decile yield for the area; either an underpriced asset or a hidden risk that comps aren't pricing in. Stress-test before assuming the spread holds.
Location & tenants
- Location reads 74/100 on livability (#111 in KY, #4,772 nationally) — a middle-class / working-renter tenant base. Strengths: cost of living A+, housing A+, crime B; Watch: employment C-, amenities F, health & safety F.
- Franklin County (town): math 25% / reading 37% proficiency, ranked #89 of 165 in KY (top 54%) — families likely to look elsewhere, expect single-tenant / working-renter base with shorter leases.
- Zoned schools: Peaks Mill Elementary (math 30% / reading 36%, grade F, #338 of 676 statewide, top 50%, 410 students, 64% FRL); Elkhorn Middle School (math 17% / reading 33%, grade F, #184 of 217 statewide, top 87%, 737 students, 60% FRL); Franklin County High School (math 27% / reading 37%, grade F, #97 of 254 statewide, top 46%, 960 students, 48% FRL).
- Market conditions: Rents rising fast (+6.5%/yr); 303 active listings in the ZIP; 2 comparable units currently listed for rent nearby; 123 units permitted in Franklin County in 2024 (0 in 5+ unit buildings).
- This rent is only 17% of the median local income ($66k/yr) — well below the 30% rent-burden line; pricing power to push rent on renewal without tenant pushback.
Forward outlook
- Local home prices are declining (-3.0%/yr); year-one equity from $622 of loan paydown is wiped out by about $3k of value loss. Plan a longer hold.
- Franklin County population projected at +7% by 2050 — modest demand growth; plan on rents tracking national, not racing it.
- At projected returns (-3.0% appreciation + 6.5% rent growth), your $25k cash investment doubles in ~9 years — after that, you're playing with house money.
Negotiation context
- It's been on market 42 days — a 3% lower offer ($87k) is reasonable based on typical stale-listing flexibility.
- Current owner paid $12k; list at $90k implies a 650% gain — meaningful room to come down on a strong offer.
Questions for the listing agent
- It's been on market 42 days. Have you received any prior offers? Is the seller open to a 3% concession, seller financing, or rate buy-down credit?
- Is there a deadline driving the sale (1031 exchange, divorce, estate, relocation)? That informs how much negotiation room exists.
- Schools are D-rated, which usually means shorter tenancies and higher turnover. Who's the typical renter profile here, and what's been the actual vacancy rate?
- What's the average days-on-market for RENTAL listings here right now (not sales)? A rising rental-DOM trend means longer vacancies and softer asking-rent achievability than the comps imply.
- What's the recent tenant-quality profile in this submarket — average credit score on applications, eviction rate, late-payment / NSF rate, and stable-employment percentage? A property-management company in the area should have these aggregated.
- How much new for-sale + rental construction is in the pipeline within 1–3 miles? Heavy new supply typically softens prices + rents 12–24 months out; constrained supply supports both.
Investment metrics
- 1% rule
- 1.04% ✓
- Cap rate
- 8.48%
- Cash-on-cash
- 7.81%
- DSCR
- 1.35
- GRM
- 8.0
CMA / ARV
- ARV (on-the-fly)
- $183,400
- Comps found
- 7
Show comp detail 7 sales within ~0.75 mi
| Address | Dist | Beds/Ba | Sqft | Sold | Price | $/sf | Match |
|---|---|---|---|---|---|---|---|
| 508 Clifton Ave | 0.18mi | 2/1.5 (+1) | 1,368 (-2%) | 14mo | $194,000 | $142 | 69 |
| 164 Gayle Street St | 0.44mi | 2/1.5 (+1) | 1,376 (-2%) | 13mo | $170,000 | $124 | 59 |
| 113 Allnutt Dr | 0.60mi | 2/1.0 (+1) | 1,271 (-9%) | 0mo | $81,500 | $64 | 51 |
| 363 Holmes St | 0.51mi | 2/1.0 (+1) | 1,336 (-5%) | 15mo | $175,000 | $131 | 51 |
| 411 Noel Ave | 0.49mi | 2/1.0 (+1) | 1,581 (+13%) | 6mo | $185,000 | $117 | 46 |
| 712 Bradley St | 0.72mi | 2/1.0 (+1) | 1,243 (-11%) | 5mo | $180,000 | $145 | 39 |
| 121 Schenkelwood Dr | 0.73mi | 2/1.0 (+1) | 1,258 (-10%) | 9mo | $210,000 | $167 | 37 |
Match score weights: distance 35% · size 25% · config 20% · recency 20%. Top-matched comps best support the ARV.
Projected returns pro-forma
-3.0% appreciation · 6.55% rent growth · sell at horizon
- IRR
- -0.7%
- Equity multiple
- 0.97×
- Total profit
- $-697
- Equity at exit
- $13,419
- IRR
- 12.2%
- Equity multiple
- 2.11×
- Total profit
- $28,044
- Equity at exit
- $7,782
Cash invested: $25,200 (down + closing). Projections, not guarantees.
Landlord ↔ Tenant lean methodology
- Overall (STATE)
- 83 Strongly Landlord-Friendly
- State Kentucky
- 83 Strongly Landlord-Friendly · R+16
- County
- — inherits STATE
- City
- — inherits STATE
ZIP-level market 40601
- Home prices YoY
- -26.1%
- Rents YoY
- 6.5%
- Active inventory
- 303
- Price-to-rent
- 8.0×
Monthly cashflow live
- Estimated rent
- $935 medium interval (Pro) →
- Mortgage (P&I)
- −$472
- Tax from tax record
- −$65 /mo · $779/yr
- Insurance
- −$38
- HOA
- −$0
- Vacancy / Maint / Mgmt
- −$196
- Net cashflow
- $164
Break-even live
UW: 25.0% down · 7.5% · 30yr · 1.5% tax · 5.0% vac · 8.0% maint · 8.0% mgmt
Financing live
Cash to close
- Down payment
- $22,500
- Closing costs
- $2,700
- Reserves months
- —
- Total cash needed
- —
Loan-product check · same deal, 3 products live
Conventional
25% down · 7.5% · 30yr
- Down + closing
- —
- Monthly P&I
- —
- Monthly cashflow
- —
- DSCR
- —
- Eligible?
- —
Personal DTI + credit; lowest rate.
DSCR
20% down · 8.5% · 30yr
- Down + closing
- —
- Monthly P&I
- —
- Monthly cashflow
- —
- DSCR
- —
- Eligible?
- —
No personal income docs; deal must DSCR.
Hard money
10% down · 12.0% · 12mo
- Down + closing
- —
- Monthly P&I
- —
- Monthly cashflow
- —
- DSCR
- —
- Eligible?
- —
Short-term bridge; refi at stabilization.
Rent comps 2 comps
| Address | Beds | Baths | Sqft | Rent | $/sqft | DOM | Units | Dist |
|---|---|---|---|---|---|---|---|---|
| 565 Schenkel Ln Frankfort, KY | 2.0–3.0 | 1.0–2.0 | 987 | $877 | $0.89 | 13d | 8 | 0.82mi |
| 315 Bypass Plaza Dr Frankfort, KY | 2.0–3.0 | 1.0–2.0 | 825 | $1,049 | $1.27 | 43d | 2 | 1.00mi |
Listing history 18 events
-
2026-06-19days on market $90,000 Active 42 DOM
-
2026-06-18days on market $90,000 Active 41 DOM
-
2026-06-17days on market $90,000 Active 40 DOM
-
2026-06-16days on market $90,000 Active 39 DOM
-
2026-06-15days on market $90,000 Active 38 DOM
-
2026-06-14days on market $90,000 Active 36 DOM
-
2026-06-12days on market $90,000 Active 35 DOM
-
2026-06-09days on market $90,000 Active 32 DOM
-
2026-06-08days on market $90,000 Active 31 DOM
-
2026-06-07days on market $90,000 Active 30 DOM
-
2026-06-05days on market $90,000 Active 27 DOM
-
2026-06-03days on market $90,000 Active 26 DOM
-
2026-06-02days on market $90,000 Active 25 DOM
-
2026-06-01days on market $90,000 Active 24 DOM
-
2026-05-31days on market $90,000 Active 23 DOM
-
2026-05-30days on market $90,000 Active 22 DOM
-
2026-05-08$100,000 Active
-
1993-01-13soldstatus $12,000
ⓘ Source: listings_history table (triggers on properties + properties_extension) + one-shot
backfill from property_details.listing_events for pre-trigger history.
Tax reassessment forecast KY · Resets to sale price
- Current annual tax
- $779 · $65/mo
- Projected year-2 tax
- $779 · $65/mo
- Expected delta
- $0/yr ($0/mo · 0.0%)
ⓘ Screening estimate from a state-policy table — verify with the county assessor before closing.
Climate risk First Street
- Flood 1/10 Low FEMA zone X (unshaded) · 0% chance over 30 yrs
- Wildfire 3/10 Moderate
- Heat 4/10 Moderate 7 d/yr ≥103°F today · 19 d/yr by 30 yrs out
- Wind 2/10 Low 100% chance of damaging wind over 30 yrs
- Air quality 2/10 Low 1 unhealthy d/yr today · 2 by 30 yrs out
Nearby sold comps map
Loading sold comps map…
Walkable amenities ~0.75 mi
Loading nearby amenities…
Taxation est. · year 1
- Rental income
- $11,216
- − Mortgage interest
- −$5,041
- − Property taxes
- −$779
- − Insurance
- −$450
- − Repairs & maintenance
- −$897
- − Management
- −$897
- − Depreciation
- −$2,618
- Taxable income
- $533
- Est. tax owed @ 24.0%
- −$128
- After-tax cash flow
- $1,840/yr
For passive investors: Depreciation is non-cash, so a rental often shows a tax loss while cash-flowing — sheltering income. Rental losses are passive: they offset passive income freely, and up to $25,000/yr can offset ordinary (W-2) income if you actively participate and your MAGI is under $100k (phasing out to $0 by $150k); unused losses carry forward. On sale, claimed depreciation is recaptured at up to 25%, and gains may owe capital-gains tax (a 1031 exchange can defer both). Figures are a year-1 estimate at your 24.0% rate — not tax advice; consult a CPA.
Schools (NCES district)
- District
- Franklin County
- NCES district ID
- 2102010
- Math proficiency
- 25% ▼ -15.00%
- Reading proficiency
- 37% ▼ -14.00%
- Median HH income
- $50,879
- Composite
- 27.07/100
- National rank
- #7049
- State rank
- #89 of 165 in KY
Livability — Frankfort
- Score
- 74/100
- State rank
- #111
- US rank
- #4772
Category grades
Schools grade is shown separately in the Schools card above.
Census & demographics
- Census place
- Frankfort, KY
- County
- Franklin County · 51,893 people
- City population
- 51,893
- Metro
- Frankfort, KY
- Population (ZIP)
- 51,893
- Household income
- $65,732
- Rent vs Own
- Severe rent burden
- 1621.0
Population outlook (Franklin County) Hauer SSP2
- Today (2025)
- 52,996 people
- By 2030
- 54,049 · +2.0%
- By 2040
- 55,561 · +4.8%
- By 2050
- 56,677 · +6.9%
- By 2075
- 59,458 · +12.2%
- By 2100
- 58,885 · +11.1%
Race, ethnicity, and origin ACS 2023
- Neighborhood character
- Predominantly White (81%)
- Race & ethnicity
- White 81% Black 9% Two or more races 5% Hispanic / Latino 4% Asian 2%
- Common ancestry
- Italian 3% Slovak 2% Lithuanian 1%
- Foreign-born
- 4% · Canada
- Languages at home
- 94% English-only · Spanish 3% Other Asian/Pacific 1% Tagalog/Filipino 1%
Political lean MEDSL · Franklin
- 2024 margin
- Toss-up / Even · D 46.6% · R 51.4% · Other 2.0%
- 2008→2024 swing
- -4.2pp toward R · 2008: -0.6pp · 2024: -4.8pp
- All cycles
- 2024: R+4.8 2020: R+0.9 2016: R+4.6 2012: D+0.8 2008: R+0.6
Not yet ingested
- Civics
- —
Market trends
- HPI YoY
- ▼ -87.43%
- Current HPI
- 248.0324
- Rent YoY
- ▲ 6.55%
- Metro
- Frankfort, KY
- State GDP YoY
- ▲ 1.81%
- F500 in state
- 4
Industry mix (Fortune 500 HQ in KY)
| Industry | F500 HQs | Revenue |
|---|---|---|
| Healthcare | 1 | $118B |
|
||
| Food / Beverage | 1 | $7B |
|
||
Price history
+733.3% since first listed2 events — show timeline
- 2026-05-08 Listed $100,000 ImagineMLS
- 1993-01-13 Sold (Public Records) $12,000 Public Records
Property tax history
+4.1%/yrLatest (2025): $779 · +1.3% YoY. Source: county tax records.
Cash-flow waterfall
monthlySold comps — $/sqft
last 12 mo · ≤1 miLoading sold comps…