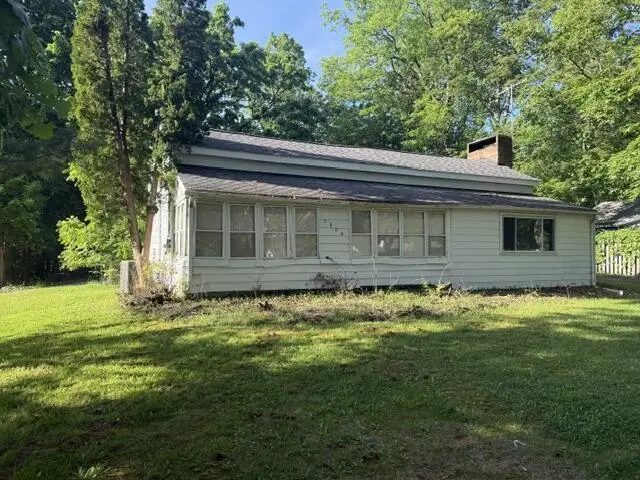
3908 Grand Prairie Rd · Westwood, MI
Flood risk 1/10 · Minimal
- FEMA flood zone
- X (unshaded)
- Chance of flooding over 30 yrs
- 0.0%
- Est. flood insurance / yr
- $473 – $860
Fire risk 1/10 · Minimal
- Est. fire insurance / yr
- $784 – $1,456
Heat risk 2/10 · Minimal
- Hot days now (above 100°F)
- 7 days/yr
- Hot days in 30 yrs
- 16 days/yr
Wind risk 2/10 · Minimal
- Chance of severe wind over 30 yrs
- —
Air-quality risk 2/10 · Minimal
- Unhealthy air days now
- 1 days/yr
- Unhealthy air days in 30 yrs
- 2 days/yr
Risk factors via First Street. Map © Google.
Why this score? — see what drove the D+ grade
The composite is a weighted blend of 9 inputs, each scored 0–100. Each bar is that input's sub-score; the figure is the points it added to the 100-point composite (weight × sub-score).
- ARV discount +15.0/15.0
- Cash flow +11.9/30.0
- Schools +4.7/10.0
- 1% rule +4.2/10.0
- Livability +4.0/5.0
- DSCR +3.5/10.0
- Rent growth +3.3/5.0
- Condition / age +2.5/5.0
- Appreciation +0.0/10.0
$159,900
🖨 Deal sheet (PDF) 📄 Offer letter ✓ Due diligence
Listing remarks MLS
Opportunity awaits with this Kalamazoo fixer-upper located in a desirable neighborhood on a corner lot shaded by mature trees. Packed with potential, this home features a kitchen, dining room, large living room with fireplace, enclosed porch, primary bedroom, and full bath on the main floor. Upstairs offers two bedrooms plus an additional walk-through room that could serve as a third bedroom, office, or flex space. Due to the short ceiling heights, the upper level is not included in the home's reported square footage. Major mechanical updates in place including a newer furnace, newer water heater, newer water softener, and updated electrical breaker panel. Bring your vision, tools, and creativity--this is your chance to build equity and make this home your own.
Key facts
- Large living room
- Enclosed porch
- Primary bedroom
Tags
Property features AI
Exterior
- Parking: Detached 2-car garage
- Utilities: Public water
- Home design: Traditional single-family residence; Built in 1875
- Construction: Aluminum siding; Composition roof; Built in 1875; Crawl space/Michigan basement
- Exterior features: Corner lot; Paved road access
Interior
- Kitchen: Oven; Refrigerator
- Bathrooms: 1 full bathroom
- Heating & cooling: Forced air heating
- Interior features: Wood-burning fireplace; 7 total rooms; Crawl space and Michigan-style basement
- Laundry & utility: Natural gas water heater
Neighborhood map
What this means for you Summary
Snapshot
- This is a 3-bed/1.0-bath single-family listed at $160k.
Deal economics
- At list price, monthly cash flow is $-42 ($-502/yr) — negative.
- To cash-flow at today's rent, offer at most $153k (4.6% below list).
- To meet the 1% rule (rent ≥ 1% of price), the offer needs to be $148k (7.5% below list).
- Recommended offer: $148k (7.5% below list) — sets the bar for 1% rule.
- Cap rate 6.0% vs local median 3.3% in Westwood — top-decile yield for the area; either an underpriced asset or a hidden risk that comps aren't pricing in. Stress-test before assuming the spread holds.
Location & tenants
- Location reads 80/100 on livability (#75 in MI, #1,649 nationally) — a professional / high-income tenant draw. Strengths: cost of living A+, housing A+, health & safety A+; Watch: amenities F, commute F.
- Kalamazoo Public Schools (urban): math 43% / reading 72% proficiency, ranked #71 of 540 in MI (top 13%) — acceptable for families but not a draw, mixed tenant base, ~2y average lease; 66% free/reduced lunch — lower-income household profile, screen leases tightly.
- Zoned schools: Kingwestwood Elementary School (math 75% / reading 75%, grade A, #34 of 1,397 statewide, top 3%, 591 students, 47% FRL); Hillside Middle School (math 75% / reading 75%, grade A, #8 of 493 statewide, top 3%, 512 students, 72% FRL); Kalamazoo Central High School (math 42% / reading 67%, grade C-, #109 of 713 statewide, top 17%, 1,612 students, 64% FRL).
- Market conditions: Rents rising (+3.4%/yr); 106 active listings in the ZIP; 9 comparable units currently listed for rent nearby; rentals at typical pace (median 16d on market — plan ~3-4 weeks tenant-placement turnaround); lower-income renter base — watch delinquency; 339 units permitted in Kalamazoo County in 2024 (22 in 5+ unit buildings).
- This rent runs 41% of the median local income ($44k/yr) — at the standard rent-burdened threshold; future hikes will face affordability resistance.
Forward outlook
- Local home prices are declining (-3.0%/yr); year-one equity from $1k of loan paydown is wiped out by about $5k of value loss. Plan a longer hold.
- Kalamazoo County population projected at +18% by 2050 — long-run rental-demand tailwind backs the buy-and-hold thesis.
Negotiation context
- Only 5 days on market — expect competitive offers; lowballing is unlikely to land.
- 11 sale attempts since 29y ago with the ask held roughly flat each time — persistent listings suggest the price (not the market) is what's stuck; bring a comps-based counter.
- Current owner paid $68k; list at $160k implies a 137% gain — meaningful room to come down on a strong offer.
Risks & watch-outs
- Watch-outs: built in 1875 — expect roof / HVAC / electrical / plumbing capex.
Questions for the listing agent
- What do current leases actually rent for vs. the listed asking? Can we see a recent rent roll and the last 12 months of T-12 income?
- Built in 1875 — when were the roof, HVAC, electrical panel, plumbing, and water heater last replaced?
- Is there a deadline driving the sale (1031 exchange, divorce, estate, relocation)? That informs how much negotiation room exists.
- Schools are A-rated — typically a magnet for longer-tenancy family renters. What's the average tenant stay here, and is there a school-zone premium baked into asking?
- The area grade is low — what's the realistic commute time and amenity access for the typical tenant pool here? Any planned neighborhood developments (good or bad) we should know about?
- What's the average days-on-market for RENTAL listings here right now (not sales)? A rising rental-DOM trend means longer vacancies and softer asking-rent achievability than the comps imply.
- What's the recent tenant-quality profile in this submarket — average credit score on applications, eviction rate, late-payment / NSF rate, and stable-employment percentage? A property-management company in the area should have these aggregated.
- How much new for-sale + rental construction is in the pipeline within 1–3 miles? Heavy new supply typically softens prices + rents 12–24 months out; constrained supply supports both.
Investment metrics
- 1% rule
- 0.92% ✗
- Cap rate
- 5.98%
- Cash-on-cash
- -1.12%
- DSCR
- 0.95
- GRM
- 9.0
CMA / ARV
- ARV (on-the-fly)
- $237,861
- Comps found
- 12
Show comp detail 12 sales within ~0.75 mi
| Address | Dist | Beds/Ba | Sqft | Sold | Price | $/sf | Match |
|---|---|---|---|---|---|---|---|
| 3908 Grand Prairie Rd | 0.00mi | 3/1.0 | 1,391 (0%) | 0mo | $135,000 | $97 | 100 |
| 1924 Seminole St | 0.11mi | 3/2.0 | 1,516 (+9%) | 10mo | $230,500 | $152 | 68 |
| 3415 Huron Ave | 0.55mi | 3/1.0 | 1,345 (-3%) | 4mo | $200,000 | $149 | 65 |
| 2413 Tamrack St | 0.29mi | 3/1.5 | 1,234 (-11%) | 4mo | $260,000 | $211 | 63 |
| 3717 Pontiac Ave | 0.16mi | 3/2.0 | 1,560 (+12%) | 10mo | $250,000 | $160 | 59 |
| 3326 Cranbrook Ave | 0.69mi | 3/1.0 | 1,302 (-6%) | 1mo | $290,000 | $223 | 56 |
| 1328 Seminole St | 0.48mi | 3/1.5 | 1,540 (+11%) | 10mo | $240,000 | $156 | 50 |
| 2424 Nichols Rd | 0.56mi | 3/1.5 | 1,200 (-14%) | 1mo | $205,000 | $171 | 48 |
| 3421 Huron Ave | 0.54mi | 3/1.0 | 1,224 (-12%) | 8mo | $185,000 | $151 | 48 |
| 1010 Northampton Rd | 0.69mi | 3/2.5 | 1,554 (+12%) | 0mo | $295,000 | $190 | 42 |
| 1335 Calhoun St | 0.69mi | 4/2.0 (+1) | 1,560 (+12%) | 2mo | $270,000 | $173 | 37 |
| 3317 Cranbrook Ave | 0.73mi | 4/2.0 (+1) | 1,560 (+12%) | 7mo | $275,000 | $176 | 31 |
Match score weights: distance 35% · size 25% · config 20% · recency 20%. Top-matched comps best support the ARV.
Projected returns pro-forma
-3.0% appreciation · 3.39% rent growth · sell at horizon
- IRR
- -17.6%
- Equity multiple
- 0.38×
- Total profit
- $-27,904
- Equity at exit
- $23,842
- IRR
- -8.8%
- Equity multiple
- 0.44×
- Total profit
- $-24,965
- Equity at exit
- $13,825
Cash invested: $44,772 (down + closing). Projections, not guarantees.
Landlord ↔ Tenant lean methodology
- Overall (STATE)
- 62 Landlord-Friendly
- State Michigan
- 62 Landlord-Friendly · EVEN
- County
- — inherits STATE
- City
- — inherits STATE
ZIP-level market 49006
- Rents YoY
- 3.4%
- Active inventory
- 106
- Price-to-rent
- 9.0×
Monthly cashflow live
- Estimated rent
- $1,479 high interval (Pro) →
- Mortgage (P&I)
- −$839
- Tax from tax record
- −$305 /mo · $3,661/yr
- Insurance
- −$67
- HOA
- −$0
- Lot rent
- −$0
- Vacancy / Maint / Mgmt
- −$311
- Net cashflow
- $-42
Break-even live
Sensitivity live
| Price | -10% $49 | -5% $3 | +0% $-42 | +5% $-87 | +10% $-132 |
|---|---|---|---|---|---|
| Rent | -10% $-159 | -5% $-100 | +0% $-42 | +5% $17 | +10% $75 |
| Rate | -1.0pp $39 | -0.5pp $-1 | base $-42 | +0.5pp $-83 | +1.0pp $-125 |
UW: 25.0% down · 7.5% · 30yr · 1.5% tax · 5.0% vac · 8.0% maint · 8.0% mgmt
Financing live
Cash to close
- Down payment
- $39,975
- Closing costs
- $4,797
- Reserves months
- —
- Total cash needed
- —
Loan-product check · same deal, 3 products live
Conventional
25% down · 7.5% · 30yr
- Down + closing
- —
- Monthly P&I
- —
- Monthly cashflow
- —
- DSCR
- —
- Eligible?
- —
Personal DTI + credit; lowest rate.
DSCR
20% down · 8.5% · 30yr
- Down + closing
- —
- Monthly P&I
- —
- Monthly cashflow
- —
- DSCR
- —
- Eligible?
- —
No personal income docs; deal must DSCR.
Hard money
10% down · 12.0% · 12mo
- Down + closing
- —
- Monthly P&I
- —
- Monthly cashflow
- —
- DSCR
- —
- Eligible?
- —
Short-term bridge; refi at stabilization.
Rent comps 9 comps
| Address | Beds | Baths | Sqft | Rent | $/sqft | DOM | Units | Dist |
|---|---|---|---|---|---|---|---|---|
| 1925 Nichols Rd Kalamazoo, MI | 2.0 | 1.0 | 1249 | $1,199 | $0.96 | 23d | 1 | 0.45mi |
| 5200 Croyden Ave Kalamazoo, MI | 1.0–4.0 | 1.0–4.0 | 1066 | $836 | $0.78 | 15d | 1 | 0.93mi |
| 3420 W Main St Kalamazoo, MI | 2.0 | 1.5–2.0 | 852 | $1,085 | $1.27 | 15d | 4 | 1.05mi |
| 3510 N Drake Rd Kalamazoo, MI | 1.0–3.0 | 1.0–1.5 | 1100 | $14,500 | $13.18 | 15d | 4 | 1.12mi |
| 318 N Sage St Kalamazoo, MI | 1.0–2.0 | 1.0 | 824 | $1,275 | $1.55 | 15d | 3 | 1.13mi |
| 207 N Kendall Ave Kalamazoo, MI | 4.0 | 2.0 | 1655 | $1,560 | $0.94 | 15d | 5 | 1.33mi |
| 210 N Kendall Ave Kalamazoo, MI | 4.0 | 2.0 | 1660 | $1,560 | $0.94 | 15d | 1 | 1.38mi |
| 124 S Kendall Ave Kalamazoo, MI | 4.0 | 2.5 | 1660 | $1,560 | $0.94 | 23d | 5 | 1.46mi |
| 105 S Kendall Ave Kalamazoo, MI | 4.0 | 2.5 | 1660 | $1,560 | $0.94 | 23d | 2 | 1.47mi |
Listing history 6 events
-
2026-06-10status $159,900 Pending 5 DOM
-
2026-06-09days on market $159,900 Active 5 DOM
-
2026-06-08days on market $159,900 Active 4 DOM
-
2026-06-07days on market $159,900 Active 3 DOM
-
2026-06-05remarks 699-char remark
-
2026-06-05$159,900 Active 1 DOM
ⓘ Source: listings_history table (triggers on properties + properties_extension) + one-shot
backfill from property_details.listing_events for pre-trigger history.
Tax reassessment forecast MI · Partial reset (capped growth)
- Current annual tax
- $3,661 · $305/mo
- Projected year-2 tax
- $3,661 · $305/mo
- Expected delta
- $0/yr ($0/mo · 0.0%)
ⓘ Screening estimate from a state-policy table — verify with the county assessor before closing.
Climate risk First Street
- Flood 1/10 Low FEMA zone X (unshaded) · 0% chance over 30 yrs
- Wildfire 1/10 Low
- Heat 2/10 Low 7 d/yr ≥100°F today · 16 d/yr by 30 yrs out
- Wind 2/10 Low
- Air quality 2/10 Low 1 unhealthy d/yr today · 2 by 30 yrs out
Nearby sold comps map
Loading sold comps map…
Walkable amenities ~0.75 mi
Loading nearby amenities…
Taxation est. · year 1
- Rental income
- $17,748
- − Mortgage interest
- −$8,957
- − Property taxes
- −$3,661
- − Insurance
- −$800
- − Repairs & maintenance
- −$1,420
- − Management
- −$1,420
- − Depreciation
- −$4,652
- Taxable loss
- −$3,161
- Est. tax savings @ 24.0%
- +$759
- After-tax cash flow
- $257/yr
For passive investors: Depreciation is non-cash, so a rental often shows a tax loss while cash-flowing — sheltering income. Rental losses are passive: they offset passive income freely, and up to $25,000/yr can offset ordinary (W-2) income if you actively participate and your MAGI is under $100k (phasing out to $0 by $150k); unused losses carry forward. On sale, claimed depreciation is recaptured at up to 25%, and gains may owe capital-gains tax (a 1031 exchange can defer both). Figures are a year-1 estimate at your 24.0% rate — not tax advice; consult a CPA.
Schools (NCES district)
- District
- Kalamazoo Public Schools
- NCES district ID
- 2619950
- Math proficiency
- 43% ▲ 13.00%
- Reading proficiency
- 72% ▲ 33.00%
- Median HH income
- $35,291
- Composite
- 47.48/100
- National rank
- #2275
- State rank
- #71 of 540 in MI
Livability — Westwood
- Score
- 80/100
- State rank
- #75
- US rank
- #1649
Category grades
Schools grade is shown separately in the Schools card above.
Census & demographics
- Census place
- Westwood, MI
- County
- Kalamazoo County · 224,317 people
- City population
- 25,888
- Metro
- Kalamazoo-Portage, MI
- Population (ZIP)
- 26,507
- Household income
- $43,639
- Rent vs Own
- Severe rent burden
- 2581.0
Population outlook (Kalamazoo County) Hauer SSP2
- Today (2025)
- 280,982 people
- By 2030
- 292,068 · +3.9%
- By 2040
- 312,191 · +11.1%
- By 2050
- 331,196 · +17.9%
- By 2075
- 379,021 · +34.9%
- By 2100
- 396,579 · +41.1%
Race, ethnicity, and origin ACS 2023
- Neighborhood character
- Diverse neighborhood (Simpson 0.55)
- Race & ethnicity
- White 65% Black 14% Two or more races 10% Hispanic / Latino 9% Asian 4%
- Hispanic origin (detail)
- Mexican 6%
- Common ancestry
- Iranian 6% Romanian 4% Italian 3%
- Foreign-born
- 9% · Canada, South Korea, China
- Languages at home
- 89% English-only · Spanish 5% Other Indo-European 2% French/Haitian/Cajun 2%
Political lean MEDSL · Kalamazoo
- 2024 margin
- D (+17.7) · D 58.0% · R 40.3% · Other 1.7%
- 2008→2024 swing
- -1.8pp toward R · 2008: 19.5pp · 2024: 17.7pp
- All cycles
- 2024: D+17.7 2020: D+18.7 2016: D+12.8 2012: D+13.3 2008: D+19.5
Not yet ingested
- Civics
- —
Market trends
- HPI YoY
- ▼ -235.52%
- Current HPI
- 243.4367
- Rent YoY
- ▲ 3.39%
- Metro
- Kalamazoo-Portage, MI
- State GDP YoY
- ▲ 1.37%
- F500 in state
- 28
Industry mix (Fortune 500 HQ in MI)
| Industry | F500 HQs | Revenue |
|---|---|---|
| Automotive Parts | 3 | $48B |
|
||
| Automotive | 2 | $372B |
|
||
| Chemicals | 1 | $45B |
|
||
| Automotive Retail | 1 | $29B |
|
||
| Healthcare / Medical Devices | 1 | $23B |
|
||
| Automotive Technology | 1 | $20B |
|
||
Price history
+113.4% since first listed23 events — show timeline
- 2026-06-04 Listed $159,900 SW Michigan MLS
- 2026-06-04 Listed $159,900 REALCOMP
- 2026-06-04 Listed $159,900 MiRealSource-MiMLS
- 2018-02-08 Sold (Public Records) $67,500 Public Records
- 2018-02-02 Sold (MLS) $67,500 SW Michigan MLS
- 2018-02-02 Sold (MLS) $67,500 REALCOMP
- 2018-01-25 Pending — SW Michigan MLS
- 2018-01-16 Price Changed $75,000 SW Michigan MLS
- 2017-11-16 Price Changed $85,000 SW Michigan MLS
- 2017-09-21 Listed $95,000 SW Michigan MLS
- 2017-09-19 Listed $75,000 REALCOMP
- 2014-09-15 Listing Removed — SW Michigan MLS
- 2000-05-31 Sold (MLS) $82,000 REALCOMP
- 2000-05-31 Sold (MLS) $82,000 SW Michigan MLS
- 2000-01-08 Listed $84,900 REALCOMP
- 2000-01-08 Listed $84,900 SW Michigan MLS
- 1999-12-24 Listing Removed — REALCOMP
- 1999-06-24 Listed $89,999 REALCOMP
- 1999-06-24 Listed $89,999 SW Michigan MLS
- 1997-06-27 Sold (MLS) $76,800 REALCOMP
- 1997-06-27 Sold (MLS) $76,800 SW Michigan MLS
- 1997-04-14 Listed $74,914 REALCOMP
- 1997-04-14 Listed $74,914 SW Michigan MLS
Property tax history
+4.4%/yrLatest (2025): $3,661 · +3.9% YoY. Source: county tax records.
Cash-flow waterfall
monthlySold comps — $/sqft
last 12 mo · ≤1 miLoading sold comps…