S77W19405 Lakewood Dr · Muskego, WI
Flood risk 1/10 · Minimal
- FEMA flood zone
- X (unshaded)
- Chance of flooding over 30 yrs
- 0.0%
- Est. flood insurance / yr
- $507 – $1,088
Fire risk 4/10 · Minor
- Est. fire insurance / yr
- $636 – $1,182
Heat risk 2/10 · Minimal
- Hot days now (above 100°F)
- 7 days/yr
- Hot days in 30 yrs
- 13 days/yr
Wind risk 2/10 · Minimal
- Chance of severe wind over 30 yrs
- —
Air-quality risk 2/10 · Minimal
- Unhealthy air days now
- 1 days/yr
- Unhealthy air days in 30 yrs
- 2 days/yr
Risk factors via First Street. Map © Google.
Why this score? — see what drove the D grade
The composite is a weighted blend of 9 inputs, each scored 0–100. Each bar is that input's sub-score; the figure is the points it added to the 100-point composite (weight × sub-score).
- Cash flow +11.7/30.0
- ARV discount +7.5/15.0
- Schools +6.0/10.0
- 1% rule +3.8/10.0
- Livability +3.6/5.0
- DSCR +3.4/10.0
- Rent growth +2.5/5.0
- Condition / age +2.5/5.0
- Appreciation +0.0/10.0
$269,900
🖨 Deal sheet (PDF) 📄 Offer letter ✓ Due diligence
Listing remarks MLS
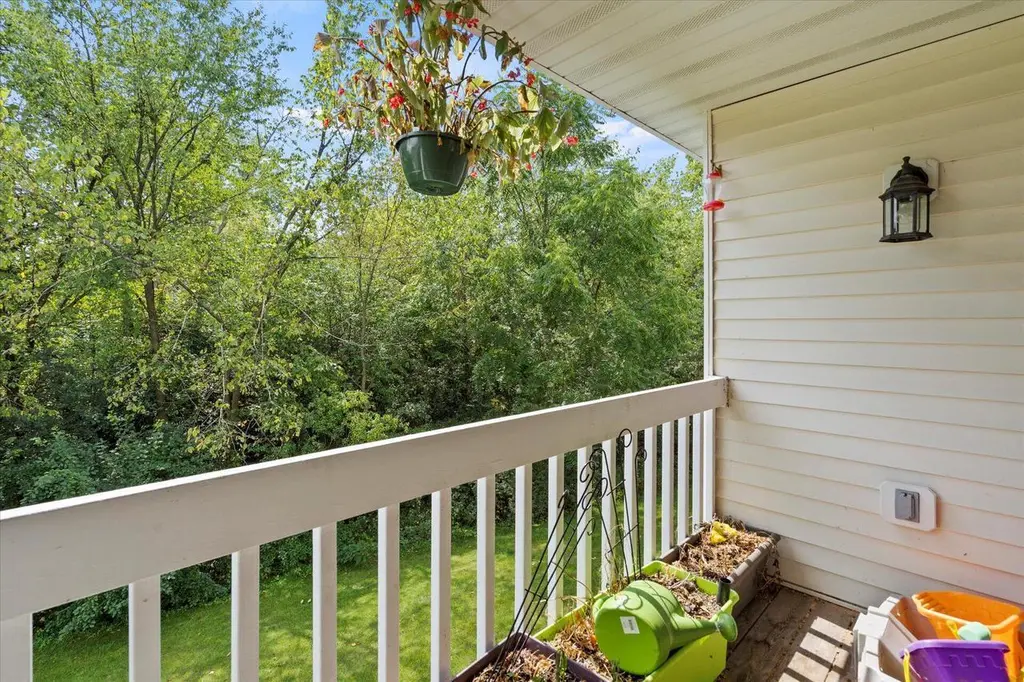
Welcome Home! This super-desirable end unit with fully open concept design and soaring cathedral ceilings is waiting for you! This upper unit features central kitchen space overlooking the dinette, living room and den/office area. Large Master BR with Master bath and walk-in closet, 2nd good-sized bedroom with ample closet space and a 2nd full bath. Wooded, private balcony with direct views of conservancy - have your cozy morning coffee or evening nightcap surrounded by the sights and sounds of nature! In-unit laundry and 1.5 car private attached garage complete this great listing. Walking distance to Little Muskego Lake, and close to all bike trails, entertainment, shopping, & freeway! Affordable Muskego living is just a call away! Don't wait!
Key facts
- $275 HOA
- Garage
- Built 2002
Neighborhood map
What this means for you Summary
Snapshot
- This is a 2-bed/2.0-bath condo listed at $270k.
Deal economics
- At list price, monthly cash flow is $-80 ($-962/yr) — negative.
- To cash-flow at today's rent, offer at most $256k (5.2% below list).
- To meet the 1% rule (rent ≥ 1% of price), the offer needs to be $238k (11.7% below list).
- Recommended offer: $238k (11.7% below list) — sets the bar for 1% rule.
- Cap rate 5.9% vs local median 1.6% in Muskego — top-decile yield for the area; either an underpriced asset or a hidden risk that comps aren't pricing in. Stress-test before assuming the spread holds.
Location & tenants
- Location reads 72/100 on livability (#228 in WI) — a middle-class / working-renter tenant base. Strengths: crime A+, employment A+, housing A+; Watch: amenities F, commute F, health & safety F.
- Muskego-Norway School District (suburban): math 73% / reading 61% proficiency, ranked #5 of 342 in WI (top 2%) — acceptable for families but not a draw, mixed tenant base, ~2y average lease; only 10% free/reduced lunch — higher-income household profile.
- Zoned schools: Mill Valley Elementary (math 89% / reading 77%, grade A+, #1 of 1,041 statewide, top 0%, 448 students, 13% FRL); Lake Denoon Middle (math 76% / reading 54%, grade A-, #8 of 383 statewide, top 2%, 724 students, 13% FRL); Muskego High (math 50% / reading 57%, grade C-, #28 of 483 statewide, top 6%, 1,686 students, 4% FRL) — zoned schools at 10% FRL track the district average.
- Market conditions: 52 active listings in the ZIP; 3 comparable units currently listed for rent nearby; rentals leasing fast (median 4d on market — plan ~1-2 weeks tenant-placement turnaround); 1,885 units permitted in Waukesha County in 2024 (696 in 5+ unit buildings).
Forward outlook
- Local home prices are declining (-3.0%/yr); year-one equity from $2k of loan paydown is wiped out by about $8k of value loss. Plan a longer hold.
Negotiation context
- It's been on market 17 days — a 2% lower offer ($266k) is reasonable based on typical stale-listing flexibility.
- 4 sale attempts since 12y ago; this cycle's ask is 35% above the opening price — seller raised mid-cycle; expect resistance to lowballs.
- Current owner paid $194k; 39% above their basis — modest negotiation headroom, anchor on the comps not their cost.
Questions for the listing agent
- What do current leases actually rent for vs. the listed asking? Can we see a recent rent roll and the last 12 months of T-12 income?
- What does the HOA fee cover, when was the last increase, and are there any pending special assessments or reserve-fund shortfalls?
- Any open or pending special assessments — roof, HVAC, plumbing, elevator, façade? What's the per-unit balance and payoff schedule, and is the seller paying it off at close or rolling it to the buyer?
- Is there a deadline driving the sale (1031 exchange, divorce, estate, relocation)? That informs how much negotiation room exists.
- Schools are A-rated — typically a magnet for longer-tenancy family renters. What's the average tenant stay here, and is there a school-zone premium baked into asking?
- The area grade is low — what's the realistic commute time and amenity access for the typical tenant pool here? Any planned neighborhood developments (good or bad) we should know about?
- What's the average days-on-market for RENTAL listings here right now (not sales)? A rising rental-DOM trend means longer vacancies and softer asking-rent achievability than the comps imply.
- What's the recent tenant-quality profile in this submarket — average credit score on applications, eviction rate, late-payment / NSF rate, and stable-employment percentage? A property-management company in the area should have these aggregated.
- How much new apartment / multifamily construction is in the pipeline within 1–3 miles? Heavy new supply (>2% of stock underway) typically softens rents 12–24 months out; light construction supports rent growth.
Investment metrics
- 1% rule
- 0.88% ✗
- Cap rate
- 5.94%
- Cash-on-cash
- -1.27%
- DSCR
- 0.94
- GRM
- 9.4
CMA / ARV
No comps found within radius.
Projected returns pro-forma
-3.0% appreciation · 3.0% rent growth · sell at horizon
- IRR
- -18.4%
- Equity multiple
- 0.36×
- Total profit
- $-48,743
- Equity at exit
- $40,243
- IRR
- -10.6%
- Equity multiple
- 0.36×
- Total profit
- $-48,627
- Equity at exit
- $23,336
Cash invested: $75,572 (down + closing). Projections, not guarantees.
Landlord ↔ Tenant lean methodology
- Overall (STATE)
- 73 Landlord-Friendly
- State Wisconsin
- 73 Landlord-Friendly · R+2
- County
- — inherits STATE
- City
- — inherits STATE
ZIP-level market 53150
- Active inventory
- 52
- Price-to-rent
- 9.4×
Monthly cashflow live
- Estimated rent
- $2,383 medium interval (Pro) →
- Mortgage (P&I)
- −$1,415
- Tax from tax record
- −$160 /mo · $1,919/yr
- Insurance
- −$112
- HOA
- −$275
- Vacancy / Maint / Mgmt
- −$500
- Net cashflow
- $-80
Break-even live
Sensitivity live
| Price | -10% $73 | -5% $-4 | +0% $-80 | +5% $-157 | +10% $-233 |
|---|---|---|---|---|---|
| Rent | -10% $-268 | -5% $-174 | +0% $-80 | +5% $14 | +10% $108 |
| Rate | -1.0pp $56 | -0.5pp $-11 | base $-80 | +0.5pp $-150 | +1.0pp $-221 |
UW: 25.0% down · 7.5% · 30yr · 1.5% tax · 5.0% vac · 8.0% maint · 8.0% mgmt
Financing live
Cash to close
- Down payment
- $67,475
- Closing costs
- $8,097
- Reserves months
- —
- Total cash needed
- —
Loan-product check · same deal, 3 products live
Conventional
25% down · 7.5% · 30yr
- Down + closing
- —
- Monthly P&I
- —
- Monthly cashflow
- —
- DSCR
- —
- Eligible?
- —
Personal DTI + credit; lowest rate.
DSCR
20% down · 8.5% · 30yr
- Down + closing
- —
- Monthly P&I
- —
- Monthly cashflow
- —
- DSCR
- —
- Eligible?
- —
No personal income docs; deal must DSCR.
Hard money
10% down · 12.0% · 12mo
- Down + closing
- —
- Monthly P&I
- —
- Monthly cashflow
- —
- DSCR
- —
- Eligible?
- —
Short-term bridge; refi at stabilization.
Rent comps 3 comps
| Address | Beds | Baths | Sqft | Rent | $/sqft | DOM | Units | Dist |
|---|---|---|---|---|---|---|---|---|
| W171S7452 Lannon Dr Muskego, WI | 1.0–2.0 | 1.5–2.5 | 1340 | $2,500 | $1.87 | 3d | 5 | 1.41mi |
| w171s7404 Lannon Dr Muskego, WI | 1.0–2.0 | 1.5–2.5 | 1277 | $2,230 | $1.75 | 45d | 2 | 1.42mi |
| W171S7390 Lannon Dr Muskego, WI | 2.0 | 2.5 | 1440 | $2,430 | $1.69 | 3d | 2 | 1.46mi |
HOA detail condo
- Monthly dues
- $275 · $3,300/yr
- Assessments
- None detected in remarks — confirm with the listing agent.
Listing history 15 events
-
2026-06-21days on market $269,900 Active 17 DOM
-
2026-06-18days on market $269,900 Active 14 DOM
-
2026-06-17days on market $269,900 Active 13 DOM
-
2026-06-16days on market $269,900 Active 12 DOM
-
2026-06-15days on market $269,900 Active 11 DOM
-
2026-06-13days on market $269,900 Active 9 DOM
-
2026-06-13days on market $269,900 Active 8 DOM
-
2026-06-09days on market $269,900 Active 5 DOM
-
2026-06-08days on market $269,900 Active 4 DOM
-
2026-06-07days on market $269,900 Active 3 DOM
-
2026-06-05statusdays on market $269,900 Active 1 DOM
-
2026-06-03days on market $269,900 Coming Soon 3 DOM
-
2026-06-02days on market $269,900 Coming Soon 2 DOM
-
2026-06-01remarks 699-char remark
-
2026-06-01$269,900 Coming Soon 1 DOM
ⓘ Source: listings_history table (triggers on properties + properties_extension) + one-shot
backfill from property_details.listing_events for pre-trigger history.
Tax reassessment forecast WI · Partial reset (capped growth)
- Current annual tax
- $1,919 · $160/mo
- Projected year-2 tax
- $3,456 · $288/mo
- Expected delta
- +$1,537/yr (+$128/mo · 80.1%)
ⓘ Screening estimate from a state-policy table — verify with the county assessor before closing.
Climate risk First Street
- Flood 1/10 Low FEMA zone X (unshaded) · 0% chance over 30 yrs
- Wildfire 4/10 Moderate
- Heat 2/10 Low 7 d/yr ≥100°F today · 13 d/yr by 30 yrs out
- Wind 2/10 Low
- Air quality 2/10 Low 1 unhealthy d/yr today · 2 by 30 yrs out
Nearby sold comps map
Loading sold comps map…
Walkable amenities ~0.75 mi
Loading nearby amenities…
Taxation est. · year 1
- Rental income
- $28,597
- − Mortgage interest
- −$15,119
- − Property taxes
- −$1,919
- − Insurance
- −$1,350
- − Repairs & maintenance
- −$2,288
- − Management
- −$2,288
- − HOA
- −$3,300
- − Depreciation
- −$7,852
- Taxable loss
- −$5,517
- Est. tax savings @ 24.0%
- +$1,324
- After-tax cash flow
- $363/yr
For passive investors: Depreciation is non-cash, so a rental often shows a tax loss while cash-flowing — sheltering income. Rental losses are passive: they offset passive income freely, and up to $25,000/yr can offset ordinary (W-2) income if you actively participate and your MAGI is under $100k (phasing out to $0 by $150k); unused losses carry forward. On sale, claimed depreciation is recaptured at up to 25%, and gains may owe capital-gains tax (a 1031 exchange can defer both). Figures are a year-1 estimate at your 24.0% rate — not tax advice; consult a CPA.
Schools (NCES district)
- District
- Muskego-Norway School District
- NCES district ID
- 5510170
- Math proficiency
- 73% ▲ 4.00%
- Reading proficiency
- 61% ▲ 1.00%
- Median HH income
- $83,673
- Composite
- 60.16/100
- National rank
- #866
- State rank
- #5 of 342 in WI
Livability — Muskego
- Score
- 72/100
- State rank
- #228
- US rank
- #6048
Category grades
Schools grade is shown separately in the Schools card above.
Census & demographics
- Census place
- Muskego, WI
- City population
- 26,142
- Population (ZIP)
- 26,142
Population outlook (Waukesha County) Hauer SSP2
- Today (2025)
- 412,798 people
- By 2030
- 418,092 · +1.3%
- By 2040
- 420,872 · +2.0%
- By 2050
- 413,862 · +0.3%
- By 2075
- 402,782 · -2.4%
- By 2100
- 365,796 · -11.4%
Race, ethnicity, and origin ACS 2023
- Neighborhood character
- Predominantly White (90%)
- Race & ethnicity
- White 90% Hispanic / Latino 5% Two or more races 4% Asian 1%
- Hispanic origin (detail)
- Mexican 4%
- Common ancestry
- Romanian 16% Portuguese 4% Lithuanian 2%
- Foreign-born
- 3% · Canada
- Languages at home
- 95% English-only · Spanish 1% Russian/Polish/Slavic 1% German/W. Germanic 1%
Political lean MEDSL · Waukesha
- 2024 margin
- R (+19.8) · D 39.5% · R 59.2% · Other 1.3%
- 2008→2024 swing
- +5.9pp toward D · 2008: -25.7pp · 2024: -19.8pp
- All cycles
- 2024: R+19.8 2020: R+20.8 2016: R+27.1 2012: R+34.8 2008: R+25.7
Not yet ingested
- Civics
- —
Market trends
- HPI YoY
- ▼ -138.25%
- Current HPI
- 248.5711
- Rent YoY
- —
- Metro
- —
- State GDP YoY
- ▲ 2.10%
- F500 in state
- 20
Industry mix (Fortune 500 HQ in WI)
| Industry | F500 HQs | Revenue |
|---|---|---|
| Industrial Machinery | 4 | $23B |
|
||
| Industrial Technology | 2 | $36B |
|
||
| Insurance | 1 | $36B |
|
||
| Professional Services | 1 | $19B |
|
||
| Utilities | 1 | $9B |
|
||
| Consumer Goods | 1 | $3B |
|
||
Price history
+64.6% since first listed15 events — show timeline
- 2026-05-31 Coming Soon $269,900 METROMLS
- 2021-11-10 Sold (Public Records) $194,500 Public Records
- 2021-11-05 Sold (MLS) $194,500 METROMLS
- 2021-09-13 Contingent — METROMLS
- 2021-09-10 Relisted — METROMLS
- 2021-09-07 Contingent — METROMLS
- 2021-09-01 Listed $200,000 METROMLS
- 2016-07-14 Listing Removed — METROMLS
- 2016-06-20 Price Changed $144,900 METROMLS
- 2016-06-03 Listed $149,000 METROMLS
- 2014-10-06 Sold (Public Records) $136,000 Public Records
- 2014-09-30 Sold (MLS) $136,000 METROMLS
- 2014-09-18 Pending — METROMLS
- 2014-09-05 Listed $142,900 METROMLS
- 2006-11-20 Sold (Public Records) $164,000 Public Records
Property tax history
-0.6%/yrLatest (2024): $1,919 · +2.2% YoY. Source: county tax records.
Cash-flow waterfall
monthlySold comps — $/sqft
last 12 mo · ≤1 miLoading sold comps…