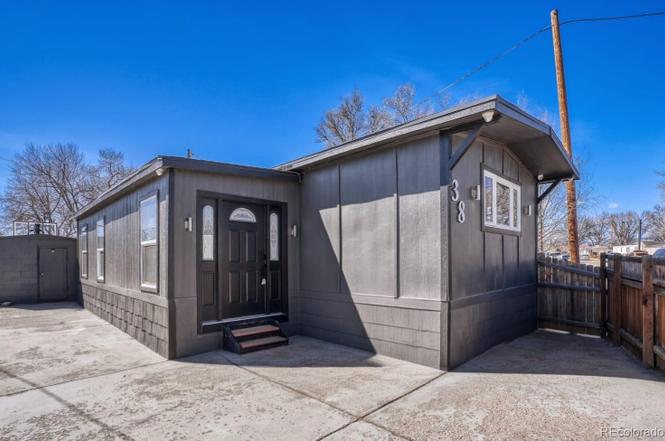
2901 W 63rd Ave · Berkley, CO
Flood risk 1/10 · Minimal
- FEMA flood zone
- X (unshaded)
- Chance of flooding over 30 yrs
- 0.0%
- Est. flood insurance / yr
- $507 – $1,088
Fire risk 1/10 · Minimal
- Est. fire insurance / yr
- $939 – $1,743
Heat risk 3/10 · Minor
- Hot days now (above 93°F)
- 7 days/yr
- Hot days in 30 yrs
- 19 days/yr
Wind risk 2/10 · Minimal
- Chance of severe wind over 30 yrs
- —
Air-quality risk 5/10 · Moderate
- Unhealthy air days now
- 9 days/yr
- Unhealthy air days in 30 yrs
- 10 days/yr
Risk factors via First Street. Map © Google.
Why this score? — see what drove the F grade
The composite is a weighted blend of 9 inputs, each scored 0–100. Each bar is that input's sub-score; the figure is the points it added to the 100-point composite (weight × sub-score).
- 1% rule +10.0/10.0
- ARV discount +7.5/15.0
- Cash flow +3.9/30.0
- Livability +3.3/5.0
- Condition / age +2.5/5.0
- Rent growth +2.4/5.0
- Schools +1.5/10.0
- DSCR +0.0/10.0
- Appreciation +0.0/10.0
$99,000
🖨 Deal sheet 📄 Offer letter ✓ Due diligence
Listing remarks MLS
Priced to sell!!! You can't miss this opportunity to own this stunning mobile home, thoughtfully upgraded and meticulously maintained, counts with a beautiful kitchen, granite counter tops, nice appliances, open space concept, 4 spacious bedroom and 2 full bathrooms, laundry room, plus a gorgeous and spacious front yard.
Key facts
- Bright kitchen
- Full bathroom
- Corner lot
Tags
Property features AI
Finance
- Other: Located in Pioneer Village Mobile Home Park; Private and paved road access; both private and public road maintenance indicated; Pets allowed (cats and dogs)
- HOA & community: Pioneer Village association (professionally managed); Monthly association/land-lease fee: $947 ($11,364 annually); Land lease in effect (expires May 31, 2026)
Exterior
- Parking: 2 off-street parking spaces; Asphalt parking surface; 2 parking spaces total
- Utilities: Public water; Public sewer; Electricity connected (110V); Natural gas connected; Cable available
- Home design: Manufactured home (in park); Faces northeast; Individual ownership; Single story (manufactured)
- Construction: Frame construction; Composition roof; 66 ft by 14 ft (mobile home size); Schult Homes
- Exterior features: Patio; Dog run; Full fencing; Corner lot
Interior
- Kitchen: Microwave; Range; Refrigerator; Breakfast bar; Stone counters
- Bedrooms: 3 bedrooms (all on main level); Primary suite
- Flooring: Wood flooring
- Bathrooms: 2 bathrooms total; 1 full bathroom (main level, primary suite); 1 three-quarter bathroom (main level)
- Heating & cooling: Forced air heating; Central air conditioning
- Interior features: Breakfast bar; Stone counters; Double-pane windows; Window coverings
- Laundry & utility: Washer; Dryer
Neighborhood map
What this means for you Summary
Snapshot
- This is a 3-bed/2.0-bath single-family listed at $99k.
Deal economics
- At list price, monthly cash flow is $-283 ($-3k/yr) — negative.
- To cash-flow at today's rent, offer at most $58k (41.4% below list).
- Meets the 1% rule at list price ($2k rent vs $99k).
- Recommended offer: $58k (41.4% below list) — sets the bar for cash-flow.
Location & tenants
- Location reads 66/100 on livability (#141 in CO) — a middle-class / working-renter tenant base. Strengths: commute A+, housing A+, employment A-; Watch: crime F, amenities F, cost of living F.
- Westminster Public Schools (suburban): math 11% / reading 22% proficiency, ranked #81 of 86 in CO (top 94%) — low school quality limits family demand, transient renter base, plan for 1-2y turnover; 72% free/reduced lunch — lower-income household profile, screen leases tightly.
- Zoned schools: Westminster High School (math 10% / reading 33%, grade F, #313 of 381 statewide, top 82%, 2,021 students, 79% FRL).
- Market conditions: Rents soft (-0.6%/yr); 160 active listings in the ZIP; 40 comparable units currently listed for rent nearby; rentals at typical pace (median 18d on market — plan ~3-4 weeks tenant-placement turnaround); solid renter incomes; 2,299 units permitted in Adams County in 2024 (343 in 5+ unit buildings).
Forward outlook
- Local home prices are declining (-3.0%/yr); year-one equity from $684 of loan paydown is wiped out by about $3k of value loss. Plan a longer hold.
- Adams County population projected at +44% by 2050 — long-run rental-demand tailwind backs the buy-and-hold thesis.
Negotiation context
- It's been on market 97 days — a 9% lower offer ($90k) is reasonable based on typical stale-listing flexibility.
- 13 sale attempts since 23y ago; this cycle's ask has dropped $10k (9%) from the opening price — seller is motivated, your offer sets the floor, not the list.
Risks & watch-outs
- Watch-outs: HOA is 55% of rent.
Questions for the listing agent
- What do current leases actually rent for vs. the listed asking? Can we see a recent rent roll and the last 12 months of T-12 income?
- It's been on market 97 days. Have you received any prior offers? Is the seller open to a 41% concession, seller financing, or rate buy-down credit?
- Built in 1979 — when were the roof, HVAC, electrical panel, plumbing, and water heater last replaced?
- What does the HOA fee cover, when was the last increase, and are there any pending special assessments or reserve-fund shortfalls?
- Why hasn't it sold? Are there any deal-killer items the seller is aware of (foundation, flood, title, zoning, code violations)?
- Is there a deadline driving the sale (1031 exchange, divorce, estate, relocation)? That informs how much negotiation room exists.
- Schools are F-rated, which usually means shorter tenancies and higher turnover. Who's the typical renter profile here, and what's been the actual vacancy rate?
- Crime grade is F in this area — have there been break-ins, vandalism, or insurance claims at this property in the last 3 years? What carrier currently insures it and at what premium?
- The area grade is low — what's the realistic commute time and amenity access for the typical tenant pool here? Any planned neighborhood developments (good or bad) we should know about?
- What's the average days-on-market for RENTAL listings here right now (not sales)? A rising rental-DOM trend means longer vacancies and softer asking-rent achievability than the comps imply.
- What's the recent tenant-quality profile in this submarket — average credit score on applications, eviction rate, late-payment / NSF rate, and stable-employment percentage? A property-management company in the area should have these aggregated.
- How much new for-sale + rental construction is in the pipeline within 1–3 miles? Heavy new supply typically softens prices + rents 12–24 months out; constrained supply supports both.
Investment metrics
- 1% rule
- 1.72% ✓
- Cap rate
- 2.86%
- Cash-on-cash
- -12.26%
- DSCR
- 0.45
- GRM
- 4.8
CMA / ARV
No comps found within radius.
Projected returns pro-forma
-3.0% appreciation · 0.0% rent growth · sell at horizon
- IRR
- -49.5%
- Equity multiple
- -0.39×
- Total profit
- $-38,470
- Equity at exit
- $14,761
- IRR
- —
- Equity multiple
- -1.65×
- Total profit
- $-73,577
- Equity at exit
- $8,560
Cash invested: $27,720 (down + closing). Projections, not guarantees.
Landlord ↔ Tenant lean methodology
- Overall (STATE)
- 38 Tenant-Leaning
- State Colorado
- 38 Tenant-Leaning · D+4
- County
- — inherits STATE
- City
- — inherits STATE
ZIP-level market 80221
- Rents YoY
- -0.6%
- Active inventory
- 160
- Price-to-rent
- 4.8×
Monthly cashflow live
- Estimated rent
- $1,706 high interval (Pro) →
- Mortgage (P&I)
- −$519
- Tax est. 1.5%
- −$124 /mo · $1,485/yr
- Insurance
- −$41
- HOA
- −$947
- Vacancy / Maint / Mgmt
- −$358
- Net cashflow
- $-283
Break-even live
UW: 25.0% down · 7.5% · 30yr · 1.5% tax · 5.0% vac · 8.0% maint · 8.0% mgmt
Financing live
Cash to close
- Down payment
- $24,750
- Closing costs
- $2,970
- Reserves months
- —
- Total cash needed
- —
Loan-product check · same deal, 3 products live
Conventional
25% down · 7.5% · 30yr
- Down + closing
- —
- Monthly P&I
- —
- Monthly cashflow
- —
- DSCR
- —
- Eligible?
- —
Personal DTI + credit; lowest rate.
DSCR
20% down · 8.5% · 30yr
- Down + closing
- —
- Monthly P&I
- —
- Monthly cashflow
- —
- DSCR
- —
- Eligible?
- —
No personal income docs; deal must DSCR.
Hard money
10% down · 12.0% · 12mo
- Down + closing
- —
- Monthly P&I
- —
- Monthly cashflow
- —
- DSCR
- —
- Eligible?
- —
Short-term bridge; refi at stabilization.
Rent comps 40 comps
| Address | Beds | Baths | Sqft | Rent | $/sqft | DOM | Units | Dist |
|---|---|---|---|---|---|---|---|---|
| 3290 W 65th Ave Denver, CO | 3.0 | 1.0 | 900 | $2,150 | $2.39 | 11d | 1 | 0.48mi |
| 6501 Irving St Denver, CO | 3.0 | 2.5 | 1399 | $2,500 | $1.79 | 5d | 1 | 0.51mi |
| 3060 W 67th Ave Denver, CO | 3.0 | 2.0 | 1200 | $2,215 | $1.85 | 24d | 1 | 0.56mi |
| 6634 Julian St Denver, CO | 3.0 | 2.0 | 1300 | $2,200 | $1.69 | 20d | 1 | 0.63mi |
| 3555 W 64th Ave Denver, CO | 1.0–2.0 | 1.0–2.0 | 806 | $1,944 | $2.41 | 3d | 11 | 0.63mi |
| 6601 Knox Ct Unit A Denver, CO | 3.0 | 1.0 | 1050 | $1,995 | $1.90 | 24d | 1 | 0.68mi |
| 3578 W 66th Ave Denver, CO | 3.0 | 3.5 | 2400 | $3,350 | $1.40 | 5d | 1 | 0.72mi |
| 3578 W 66th Ave Denver, CO | 3.0 | 3.5 | 2359 | $3,400 | $1.44 | 11d | 1 | 0.72mi |
| 3640 W 65th Ave Arvada, CO | 3.0–4.0 | 3.0 | 1567 | $3,195 | $2.04 | 2d | 36 | 0.72mi |
| 3572 W 66th Ave Denver, CO | 3.0 | 3.5 | 2400 | $3,300 | $1.38 | 11d | 1 | 0.72mi |
| 3572 W 66th Ave Denver, CO | 3.0 | 3.5 | 2380 | $3,325 | $1.40 | 3d | 1 | 0.72mi |
| 6665 Knox Ct Denver, CO | 2.0 | 1.0 | 1100 | $2,295 | $2.09 | 24d | 1 | 0.73mi |
| 6419 Meade Way Arvada, CO | 4.0 | 3.0 | 1616 | $3,708 | $2.29 | 24d | 1 | 0.74mi |
| 6427 Meade Way Arvada, CO | 4.0 | 3.0 | 1616 | $3,683 | $2.28 | 24d | 1 | 0.74mi |
| 6431 Meade Way Arvada, CO | 3.0 | 3.0 | 1589 | $3,440 | $2.16 | 24d | 1 | 0.74mi |
| 6833 Decatur St Denver, CO | 3.0 | 3.0 | 2680 | $3,400 | $1.27 | 3d | 1 | 0.74mi |
| 6441 Meade Way Arvada, CO | 3.0 | 3.0 | 1589 | $3,420 | $2.15 | 24d | 1 | 0.74mi |
| 1962 W 67th Pl Denver, CO | 4.0 | 5.0 | 3630 | $6,000 | $1.65 | 3d | 1 | 0.75mi |
| 6751 Meade Way Arvada, CO | 3.0 | 3.0 | 1589 | $3,591 | $2.26 | 20d | 1 | 0.78mi |
| 6565 Meade Way Arvada, CO | 4.0 | 3.0 | 1616 | $3,834 | $2.37 | 20d | 1 | 0.78mi |
| 2811 W 69th Ave Denver, CO | 3.0 | 2.5 | 1574 | $2,900 | $1.84 | 18d | 1 | 0.78mi |
| 2801 W 70th Ave Westminster, CO | 1.0–2.0 | 1.0 | 787 | $1,475 | $1.87 | 18d | 2 | 0.82mi |
| 2053 W 67th Pl Denver, CO | 3.0 | 2.5 | 1541 | $2,875 | $1.87 | 18d | 1 | 0.83mi |
| 6771 Raritan Dr Denver, CO | 4.0 | 4.0 | 2883 | $4,195 | $1.46 | 2d | 1 | 0.95mi |
| 3045 W 71st Ave Westminster, CO | 2.0 | 1.0 | 910 | $1,467 | $1.61 | 24d | 1 | 0.97mi |
| 1621 W 67th Cir Denver, CO | 3.0 | 2.5 | 1739 | $2,950 | $1.70 | 18d | 1 | 1.00mi |
| 3791 W 68th Ave Westminster, CO | 1.0–2.0 | 1.0 | 660 | $1,551 | $2.35 | 2d | 102 | 1.06mi |
| 5415 Alcott St Unit 5415 Denver, CO | 2.0 | 1.0 | 784 | $1,400 | $1.79 | 3d | 1 | 1.11mi |
| 5417 Alcott St Unit 5417 Denver, CO | 2.0 | 1.0 | 900 | $1,400 | $1.56 | 24d | 1 | 1.11mi |
| 7155 Hooker St Unit 304 Westminster, CO | 2.0 | 1.0 | 800 | $1,495 | $1.87 | 24d | 1 | 1.12mi |
| 7155 Hooker St Westminster, CO | 2.0 | 1.0 | 800 | $1,495 | $1.87 | 22d | 1 | 1.12mi |
| 6440 Tennyson St Arvada, CO | 2.0 | 1.5 | 1448 | $2,200 | $1.52 | 5d | 1 | 1.15mi |
| 2851 Eliot Cir Westminster, CO | 2.0 | 2.0 | 800 | $1,462 | $1.83 | 15d | 1 | 1.16mi |
| 2831 Eliot Cir Westminster, CO | 2.0 | 1.0 | 750 | $1,279 | $1.71 | 11d | 2 | 1.16mi |
| 2791 Eliot Cir Westminster, CO | 2.0 | 1.0 | — | $1,395 | — | 11d | 1 | 1.16mi |
| 2740 Eliot Cir Westminster, CO | 2.0 | 1.0 | 787 | $1,195 | $1.52 | 24d | 3 | 1.19mi |
| 2900 Eliot Cir Unit 4 Westminster, CO | 2.0 | 1.0 | 821 | $1,250 | $1.52 | 3d | 1 | 1.20mi |
| 6905 Mariposa St Unit B Denver, CO | 2.0 | 1.5 | 924 | $1,750 | $1.89 | 24d | 1 | 1.28mi |
| 7050 Pecos St Denver, CO | 1.0–2.0 | 1.0 | 645 | $1,750 | $2.71 | 2d | 27 | 1.31mi |
| 6975 Mariposa St Unit A Denver, CO | 2.0 | 1.5 | 928 | $2,100 | $2.26 | 5d | 1 | 1.32mi |
HOA detail
- Monthly dues
- $947 · $11,364/yr
Listing history 50 events
-
2026-06-18days on market $99,000 Active 97 DOM
-
2026-06-17days on market $99,000 Active 96 DOM
-
2026-06-16days on market $99,000 Active 95 DOM
-
2026-06-15days on market $99,000 Active 94 DOM
-
2026-06-13days on market $99,000 Active 92 DOM
-
2026-06-13days on market $99,000 Active 91 DOM
-
2026-06-09days on market $99,000 Active 88 DOM
-
2026-06-08days on market $99,000 Active 87 DOM
-
2026-06-07days on market $99,000 Active 86 DOM
-
2026-06-04days on market $99,000 Active 83 DOM
-
2026-06-03days on market $99,000 Active 82 DOM
-
2026-06-02days on market $99,000 Active 81 DOM
-
2026-06-01days on market $99,000 Active 80 DOM
-
2026-05-31days on market $99,000 Active 79 DOM
-
2026-04-08price $99,000
-
2026-03-13$109,000 Active
-
2025-07-10historical
-
2025-04-25soldstatus $137,100 Closed 322-char remark
Show marketing remark (322 chars)
Priced to sell!!! You can't miss this opportunity to own this stunning mobile home, thoughtfully upgraded and meticulously maintained, counts with a beautiful kitchen, granite counter tops, nice appliances, open space concept, 4 spacious bedroom and 2 full bathrooms, laundry room, plus a gorgeous and spacious front yard.
-
2025-03-22status Pending Accepting Backup Offers 322-char remark
Show marketing remark (322 chars)
Priced to sell!!! You can't miss this opportunity to own this stunning mobile home, thoughtfully upgraded and meticulously maintained, counts with a beautiful kitchen, granite counter tops, nice appliances, open space concept, 4 spacious bedroom and 2 full bathrooms, laundry room, plus a gorgeous and spacious front yard.
-
2025-03-05$159,900 Active 322-char remark
Show marketing remark (322 chars)
Priced to sell!!! You can't miss this opportunity to own this stunning mobile home, thoughtfully upgraded and meticulously maintained, counts with a beautiful kitchen, granite counter tops, nice appliances, open space concept, 4 spacious bedroom and 2 full bathrooms, laundry room, plus a gorgeous and spacious front yard.
-
2025-03-04historical $159,900 322-char remark
Show marketing remark (322 chars)
Priced to sell!!! You can't miss this opportunity to own this stunning mobile home, thoughtfully upgraded and meticulously maintained, counts with a beautiful kitchen, granite counter tops, nice appliances, open space concept, 4 spacious bedroom and 2 full bathrooms, laundry room, plus a gorgeous and spacious front yard.
-
2025-03-04price $75,000
Show marketing remark (322 chars)
Priced to sell!!! You can't miss this opportunity to own this stunning mobile home, thoughtfully upgraded and meticulously maintained, counts with a beautiful kitchen, granite counter tops, nice appliances, open space concept, 4 spacious bedroom and 2 full bathrooms, laundry room, plus a gorgeous and spacious front yard.
-
2025-02-07$95,000 Active
-
2024-07-31soldstatus $18,000 Closed
-
2024-07-23status Pending Accepting Backup Offers
-
2024-07-18price $20,000
-
2024-06-27price $22,000
-
2024-06-27$20,000 Active
-
2023-10-12soldstatus $10,500,000
-
2023-05-08historical
-
2023-05-03soldstatus $120,000 Closed
-
2023-04-20status Pending Accepting Backup Offers
-
2023-04-14status Active
-
2023-04-08status Active
-
2023-04-07historical
-
2023-03-23status Pending
-
2023-03-19price $122,000
-
2023-03-01price $124,000
-
2023-02-28price $64,900
-
2023-02-10status Active
-
2023-02-08$69,900 Active
-
2023-01-16status Pending Accepting Backup Offers
-
2023-01-11price $127,000
-
2023-01-11status Active
-
2023-01-09status Pending Accepting Backup Offers
-
2022-12-18$130,000 Active
-
2022-10-17soldstatus $102,000 Closed
-
2022-09-28status Pending Accepting Backup Offers
-
2022-09-12$107,000 Active
-
2022-08-08status Pending Accepting Backup Offers
ⓘ Source: listings_history table (triggers on properties + properties_extension) + one-shot
backfill from property_details.listing_events for pre-trigger history.
Climate risk First Street
- Flood 1/10 Low FEMA zone X (unshaded) · 0% chance over 30 yrs
- Wildfire 1/10 Low
- Heat 3/10 Moderate 7 d/yr ≥93°F today · 19 d/yr by 30 yrs out
- Wind 2/10 Low
- Air quality 5/10 Major 9 unhealthy d/yr today · 10 by 30 yrs out
Nearby sold comps map
Loading sold comps map…
Walkable amenities ~0.75 mi
Loading nearby amenities…
Taxation est. · year 1
- Rental income
- $20,476
- − Mortgage interest
- −$5,546
- − Property taxes
- −$1,485
- − Insurance
- −$495
- − Repairs & maintenance
- −$1,638
- − Management
- −$1,638
- − HOA
- −$11,364
- − Depreciation
- −$2,880
- Taxable loss
- −$4,570
- Est. tax savings @ 24.0%
- +$1,097
- After-tax cash flow
- $-2,301/yr
For passive investors: Depreciation is non-cash, so a rental often shows a tax loss while cash-flowing — sheltering income. Rental losses are passive: they offset passive income freely, and up to $25,000/yr can offset ordinary (W-2) income if you actively participate and your MAGI is under $100k (phasing out to $0 by $150k); unused losses carry forward. On sale, claimed depreciation is recaptured at up to 25%, and gains may owe capital-gains tax (a 1031 exchange can defer both). Figures are a year-1 estimate at your 24.0% rate — not tax advice; consult a CPA.
Schools (NCES district)
- District
- Westminster Public Schools
- NCES district ID
- 0807230
- Math proficiency
- 11% ▼ -5.00%
- Reading proficiency
- 22% ▼ -5.00%
- Median HH income
- $49,069
- Composite
- 14.88/100
- National rank
- #9376
- State rank
- #81 of 86 in CO
Livability — Berkley
- Score
- 66/100
- State rank
- #141
- US rank
- #11674
Category grades
Schools grade is shown separately in the Schools card above.
Census & demographics
- Census place
- Berkley, CO
- County
- Adams County · 464,133 people
- Metro
- Denver-Aurora-Lakewood, CO
- Population (ZIP)
- 39,718
- Household income
- $86,810
- Rent vs Own
- Severe rent burden
- 1276.0
Population outlook (Adams County) Hauer SSP2
- Today (2025)
- 598,184 people
- By 2030
- 651,880 · +9.0%
- By 2040
- 759,778 · +27.0%
- By 2050
- 862,889 · +44.3%
- By 2075
- 1,085,994 · +81.5%
- By 2100
- 1,211,318 · +102.5%
Race, ethnicity, and origin ACS 2023
- Neighborhood character
- Majority Hispanic (58%)
- Race & ethnicity
- Hispanic / Latino 58% White 36% Two or more races 25% Native American 2% Asian 2% Black 1%
- Hispanic origin (detail)
- Mexican 48%
- Common ancestry
- Lithuanian 1% Romanian 1% Portuguese 1%
- Foreign-born
- 16% · Canada
- Languages at home
- 62% English-only · Spanish 35% French/Haitian/Cajun 1%
Political lean MEDSL · Adams
- 2024 margin
- Lean D (+9.0) · D 53.2% · R 44.1% · Other 2.7%
- 2008→2024 swing
- -9.3pp toward R · 2008: 18.4pp · 2024: 9.0pp
- All cycles
- 2024: D+9.0 2020: D+16.3 2016: D+7.2 2012: D+15.1 2008: D+18.4
Not yet ingested
- Civics
- —
Market trends
- HPI YoY
- ▼ -257.27%
- Current HPI
- 270.4775
- Rent YoY
- ▼ -0.56%
- Metro
- Denver-Aurora-Lakewood, CO
- State GDP YoY
- ▲ 1.95%
- F500 in state
- 14
Industry mix (Fortune 500 HQ in CO)
| Industry | F500 HQs | Revenue |
|---|---|---|
| Technology Distribution | 1 | $31B |
|
||
| Food / Agriculture | 1 | $18B |
|
||
| Packaging | 1 | $14B |
|
||
| Healthcare | 1 | $13B |
|
||
| Energy | 1 | $10B |
|
||
| Technology | 1 | $4B |
|
||
Price history
+1880.0% since first listed40 events — show timeline
- 2026-04-08 Price Changed $99,000 REColorado as Distributed by MLS Grid
- 2026-03-13 Listed $109,000 REColorado as Distributed by MLS Grid
- 2025-07-10 Listing Removed — REColorado as Distributed by MLS Grid
- 2025-04-25 Sold (MLS) $137,100 REColorado as Distributed by MLS Grid
- 2025-03-22 Pending — REColorado as Distributed by MLS Grid
- 2025-03-05 Listed $159,900 REColorado as Distributed by MLS Grid
- 2025-03-04 Coming Soon $159,900 REColorado as Distributed by MLS Grid
- 2025-03-04 Price Changed $75,000 REColorado as Distributed by MLS Grid
- 2025-02-07 Listed $95,000 REColorado as Distributed by MLS Grid
- 2024-07-31 Sold (MLS) $18,000 REColorado as Distributed by MLS Grid
- 2024-07-23 Pending — REColorado as Distributed by MLS Grid
- 2024-07-18 Price Changed $20,000 REColorado as Distributed by MLS Grid
- 2024-06-27 Price Changed $22,000 REColorado as Distributed by MLS Grid
- 2024-06-27 Listed $20,000 REColorado as Distributed by MLS Grid
- 2023-10-12 Sold (Public Records) $10,500,000 Public Records
- 2023-05-08 Listing Removed — REColorado as Distributed by MLS Grid
- 2023-05-03 Sold (MLS) $120,000 REColorado as Distributed by MLS Grid
- 2023-04-20 Pending — REColorado as Distributed by MLS Grid
- 2023-04-14 Relisted — REColorado as Distributed by MLS Grid
- 2023-04-08 Relisted — REColorado as Distributed by MLS Grid
- 2023-04-07 Listing Removed — REColorado as Distributed by MLS Grid
- 2023-03-23 Pending — REColorado as Distributed by MLS Grid
- 2023-03-19 Price Changed $122,000 REColorado as Distributed by MLS Grid
- 2023-03-01 Price Changed $124,000 REColorado as Distributed by MLS Grid
- 2023-02-28 Price Changed $64,900 REColorado as Distributed by MLS Grid
- 2023-02-10 Relisted — REColorado as Distributed by MLS Grid
- 2023-02-08 Listed $69,900 REColorado as Distributed by MLS Grid
- 2023-01-16 Pending — REColorado as Distributed by MLS Grid
- 2023-01-11 Price Changed $127,000 REColorado as Distributed by MLS Grid
- 2023-01-11 Relisted — REColorado as Distributed by MLS Grid
- 2023-01-09 Pending — REColorado as Distributed by MLS Grid
- 2022-12-18 Listed $130,000 REColorado as Distributed by MLS Grid
- 2022-10-17 Sold (MLS) $102,000 REColorado as Distributed by MLS Grid
- 2022-09-28 Pending — REColorado as Distributed by MLS Grid
- 2022-09-12 Listed $107,000 REColorado as Distributed by MLS Grid
- 2022-08-08 Pending — REColorado as Distributed by MLS Grid
- 2022-08-05 Listing Removed — REColorado as Distributed by MLS Grid
- 2022-07-28 Listed $105,000 REColorado as Distributed by MLS Grid
- 2003-08-02 Listing Removed — IRES
- 2003-06-04 Listed $5,000 IRES
Property tax history
+4.6%/yrLatest (2025): $64,402 · -1.7% YoY. Source: county tax records.
Cash-flow waterfall
monthlySold comps — $/sqft
last 12 mo · ≤1 miLoading sold comps…