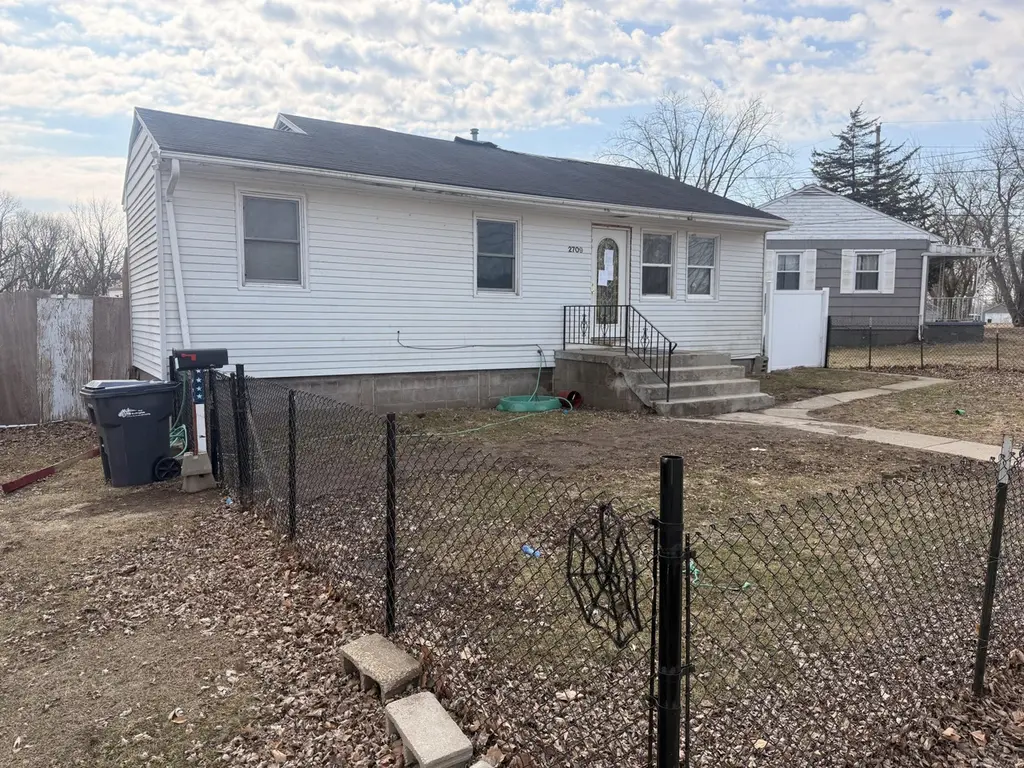
2709 Flint Hills Dr · Burlington, IA
Flood risk 3/10 · Minor
- FEMA flood zone
- X (unshaded)
- Chance of flooding over 30 yrs
- 0.2%
- Est. flood insurance / yr
- $507 – $1,088
Fire risk 1/10 · Minimal
- Est. fire insurance / yr
- $902 – $1,676
Heat risk 3/10 · Minor
- Hot days now (above 106°F)
- 7 days/yr
- Hot days in 30 yrs
- 16 days/yr
Wind risk 2/10 · Minimal
- Chance of severe wind over 30 yrs
- —
Air-quality risk 2/10 · Minimal
- Unhealthy air days now
- 0 days/yr
- Unhealthy air days in 30 yrs
- 1 days/yr
Risk factors via First Street. Map © Google.
Why this score? — see what drove the B grade
The composite is a weighted blend of 9 inputs, each scored 0–100. Each bar is that input's sub-score; the figure is the points it added to the 100-point composite (weight × sub-score).
- Cash flow +30.0/30.0
- 1% rule +10.0/10.0
- DSCR +10.0/10.0
- ARV discount +7.5/15.0
- Schools +4.0/10.0
- Livability +3.7/5.0
- Rent growth +2.5/5.0
- Condition / age +2.5/5.0
- Appreciation +0.0/10.0
$34,900
🖨 Deal sheet 📄 Offer letter ✓ Due diligence
Listing remarks MLS
Nice ranch style home in a good neighborhood. Home is being sold as -is with all contents included. Features include 3 bedrooms, 1 bath, and 1 car carport and a large yard.
Key facts
- 0.26 acre lot
- Garage
- Built 1941
Neighborhood map
What this means for you Summary
Snapshot
- This is a 3-bed/1.0-bath single-family listed at $35k.
Deal economics
- At list price, monthly cash flow is $398 ($5k/yr) — positive.
- The deal already cash-flows at list — no discount required.
- Meets the 1% rule at list price ($856 rent vs $35k).
- Recommended offer: $33k (6.0% below list) — sets the bar for market timing.
- Cap rate 20.0% vs local median 6.0% in Burlington — top-decile yield for the area; either an underpriced asset or a hidden risk that comps aren't pricing in. Stress-test before assuming the spread holds.
Location & tenants
- Location reads 73/100 on livability (#287 in IA) — a middle-class / working-renter tenant base. Strengths: cost of living A+, housing A+, health & safety A+; Watch: crime D+, employment D, amenities F.
- Burlington Community School District (town): math 42% / reading 54% proficiency, ranked #286 of 289 in IA (top 99%) — families likely to look elsewhere, expect single-tenant / working-renter base with shorter leases.
- Market conditions: 184 active listings in the ZIP; 3 comparable units currently listed for rent nearby; rentals lingering (median 44d on market — plan ~5-8 weeks vacancy on turnover, expect pricing pressure); 100% of comp listings sitting > 30 days — soft ceiling on asking rent; 53 units permitted in Des Moines County in 2024 (40 in 5+ unit buildings).
- This rent is only 17% of the median local income ($61k/yr) — well below the 30% rent-burden line; pricing power to push rent on renewal without tenant pushback.
Forward outlook
- Local home prices are declining (-3.0%/yr); year-one equity from $241 of loan paydown is wiped out by about $1k of value loss. Plan a longer hold.
- Des Moines County population projected to shrink 6% by 2050 — rents likely to lag national; underwrite the cash flow, not the appreciation.
- At projected returns (-3.0% appreciation + 3.0% rent growth), your $10k cash investment doubles in ~3 years — after that, you're playing with house money.
Negotiation context
- It's been on market 82 days — a 6% lower offer ($33k) is reasonable based on typical stale-listing flexibility.
- 2 sale attempts since 10y ago; this cycle's ask has dropped $15k (30%) from the opening price — seller is motivated, your offer sets the floor, not the list.
- Current owner paid $28k; 22% above their basis — modest negotiation headroom, anchor on the comps not their cost.
Risks & watch-outs
- Watch-outs: property tax is 2.8% of price; built in 1941 — expect roof / HVAC / electrical / plumbing capex.
Questions for the listing agent
- It's been on market 82 days. Have you received any prior offers? Is the seller open to a 6% concession, seller financing, or rate buy-down credit?
- Built in 1941 — when were the roof, HVAC, electrical panel, plumbing, and water heater last replaced?
- Property tax is high relative to price — has the assessment been appealed recently, and will the sale trigger a re-assessment?
- Why hasn't it sold? Are there any deal-killer items the seller is aware of (foundation, flood, title, zoning, code violations)?
- Is there a deadline driving the sale (1031 exchange, divorce, estate, relocation)? That informs how much negotiation room exists.
- Crime grade is D in this area — have there been break-ins, vandalism, or insurance claims at this property in the last 3 years? What carrier currently insures it and at what premium?
- What's the average days-on-market for RENTAL listings here right now (not sales)? A rising rental-DOM trend means longer vacancies and softer asking-rent achievability than the comps imply.
- What's the recent tenant-quality profile in this submarket — average credit score on applications, eviction rate, late-payment / NSF rate, and stable-employment percentage? A property-management company in the area should have these aggregated.
- How much new for-sale + rental construction is in the pipeline within 1–3 miles? Heavy new supply typically softens prices + rents 12–24 months out; constrained supply supports both.
Investment metrics
- 1% rule
- 2.45% ✓
- Cap rate
- 19.97%
- Cash-on-cash
- 48.86%
- DSCR
- 3.17
- GRM
- 3.4
CMA / ARV
- ARV (median comp)
- $199,098
- List price
- $34,900
- Delta
- -82.47%
- Verdict
- UNDERPRICED
- Comps
- 20 within 1.0 mi
Show comp detail 12 sales within ~0.75 mi
| Address | Dist | Beds/Ba | Sqft | Sold | Price | $/sf | Match |
|---|---|---|---|---|---|---|---|
| 2310 Flint Hills Dr | 0.18mi | 2/1.0 (-1) | 720 (-12%) | 4mo | $95,000 | $132 | 63 |
| 803 Melrose Ct | 0.56mi | 2/1.0 (-1) | 800 (-2%) | 8mo | $47,500 | $59 | 59 |
| 505 S Gertrude St | 0.71mi | 2/1.0 (-1) | 824 (+1%) | 2mo | $67,000 | $81 | 58 |
| 2201 Burlington Ave | 0.43mi | 2/1.0 (-1) | 720 (-12%) | 3mo | $112,000 | $156 | 53 |
| 111 Pierson Ct | 0.47mi | 2/1.0 (-1) | 912 (+12%) | 4mo | $52,000 | $57 | 50 |
| 908 Shield St | 0.71mi | 2/1.0 (-1) | 868 (+6%) | 3mo | $79,900 | $92 | 48 |
| 830 Emmett St | 0.71mi | 2/1.0 (-1) | 825 (+1%) | 15mo | $108,000 | $131 | 48 |
| 227 Grant St | 0.71mi | 2/1.0 (-1) | 878 (+8%) | 4mo | $20,000 | $23 | 46 |
| 921 Shields St | 0.72mi | 2/1.0 (-1) | 768 (-6%) | 15mo | $105,000 | $137 | 39 |
| 2503 Clearview Ave | 0.54mi | 2/1.5 (-1) | 938 (+15%) | 6mo | $155,000 | $165 | 38 |
| 524 N Plane St | 0.67mi | 3/1.0 | 931 (+14%) | 10mo | $129,000 | $139 | 36 |
| 318 S Starr Ave | 0.72mi | 2/1.0 (-1) | 745 (-9%) | 16mo | $65,000 | $87 | 33 |
Match score weights: distance 35% · size 25% · config 20% · recency 20%. Top-matched comps best support the ARV.
Projected returns pro-forma
-3.0% appreciation · 3.0% rent growth · sell at horizon
- IRR
- 46.5%
- Equity multiple
- 3.02×
- Total profit
- $19,720
- Equity at exit
- $5,204
- IRR
- 52.2%
- Equity multiple
- 6.11×
- Total profit
- $49,946
- Equity at exit
- $3,018
Cash invested: $9,772 (down + closing). Projections, not guarantees.
Landlord ↔ Tenant lean methodology
- Overall (STATE)
- 83 Strongly Landlord-Friendly
- State Iowa
- 83 Strongly Landlord-Friendly · R+6
- County
- — inherits STATE
- City
- — inherits STATE
ZIP-level market 52601
- Active inventory
- 184
- Price-to-rent
- 3.4×
Monthly cashflow live
- Estimated rent
- $856 medium interval (Pro) →
- Mortgage (P&I)
- −$183
- Tax from tax record
- −$81 /mo · $970/yr
- Insurance
- −$15
- HOA
- −$0
- Vacancy / Maint / Mgmt
- −$180
- Net cashflow
- $398
Break-even live
UW: 25.0% down · 7.5% · 30yr · 1.5% tax · 5.0% vac · 8.0% maint · 8.0% mgmt
Financing live
Cash to close
- Down payment
- $8,725
- Closing costs
- $1,047
- Reserves months
- —
- Total cash needed
- —
Loan-product check · same deal, 3 products live
Conventional
25% down · 7.5% · 30yr
- Down + closing
- —
- Monthly P&I
- —
- Monthly cashflow
- —
- DSCR
- —
- Eligible?
- —
Personal DTI + credit; lowest rate.
DSCR
20% down · 8.5% · 30yr
- Down + closing
- —
- Monthly P&I
- —
- Monthly cashflow
- —
- DSCR
- —
- Eligible?
- —
No personal income docs; deal must DSCR.
Hard money
10% down · 12.0% · 12mo
- Down + closing
- —
- Monthly P&I
- —
- Monthly cashflow
- —
- DSCR
- —
- Eligible?
- —
Short-term bridge; refi at stabilization.
Rent comps 3 comps
| Address | Beds | Baths | Sqft | Rent | $/sqft | DOM | Units | Dist |
|---|---|---|---|---|---|---|---|---|
| 2645 Newbury Cir Burlington, IA | 2.0 | 1.0 | 825 | $825 | $1.00 | 43d | 3 | 0.15mi |
| 2911 Market St Unit 2909 Burlington, IA | 2.0 | 1.0 | 720 | $625 | $0.87 | 43d | 1 | 0.16mi |
| 4051 West Ave Burlington, IA | 1.0–2.0 | 1.0 | 723 | $1,060 | $1.47 | 43d | 2 | 1.32mi |
Listing history 21 events
-
2026-06-19days on market $34,900 Active 82 DOM
-
2026-06-18days on market $34,900 Active 81 DOM
-
2026-06-17days on market $34,900 Active 80 DOM
-
2026-06-16days on market $34,900 Active 79 DOM
-
2026-06-15days on market $34,900 Active 78 DOM
-
2026-06-14days on market $34,900 Active 76 DOM
-
2026-06-12pricedays on market $34,900 Active 75 DOM
-
2026-06-09days on market $42,500 Active 72 DOM
-
2026-06-08days on market $42,500 Active 71 DOM
-
2026-06-07days on market $42,500 Active 70 DOM
-
2026-06-07days on market $42,500 Active 69 DOM
-
2026-06-03days on market $42,500 Active 66 DOM
-
2026-06-02days on market $42,500 Active 65 DOM
-
2026-06-01days on market $42,500 Active 64 DOM
-
2026-05-31days on market $42,500 Active 63 DOM
-
2026-05-30days on market $42,500 Active 62 DOM
-
2026-04-27price $42,500 172-char remark
Show marketing remark (172 chars)
Nice ranch style home in a good neighborhood. Home is being sold as -is with all contents included. Features include 3 bedrooms, 1 bath, and 1 car carport and a large yard.
-
2026-03-29$49,900 Active 172-char remark
Show marketing remark (172 chars)
Nice ranch style home in a good neighborhood. Home is being sold as -is with all contents included. Features include 3 bedrooms, 1 bath, and 1 car carport and a large yard.
-
2016-04-29soldstatus $28,500
-
2016-04-27soldstatus $24,000 50-char remark
Show marketing remark (50 chars)
2 bedroom home with a little over 850 square feet.
-
2016-03-25$34,000 50-char remark
Show marketing remark (50 chars)
2 bedroom home with a little over 850 square feet.
ⓘ Source: listings_history table (triggers on properties + properties_extension) + one-shot
backfill from property_details.listing_events for pre-trigger history.
Tax reassessment forecast IA · Partial reset (capped growth)
- Current annual tax
- $970 · $81/mo
- Projected year-2 tax
- $970 · $81/mo
- Expected delta
- $0/yr ($0/mo · 0.0%)
ⓘ Screening estimate from a state-policy table — verify with the county assessor before closing.
Climate risk First Street
- Flood 3/10 Moderate FEMA zone X (unshaded) · 20% chance over 30 yrs
- Wildfire 1/10 Low
- Heat 3/10 Moderate 7 d/yr ≥106°F today · 16 d/yr by 30 yrs out
- Wind 2/10 Low
- Air quality 2/10 Low 0 unhealthy d/yr today · 1 by 30 yrs out
Nearby sold comps map
Loading sold comps map…
Walkable amenities ~0.75 mi
Loading nearby amenities…
Taxation est. · year 1
- Rental income
- $10,272
- − Mortgage interest
- −$1,955
- − Property taxes
- −$970
- − Insurance
- −$174
- − Repairs & maintenance
- −$822
- − Management
- −$822
- − Depreciation
- −$1,015
- Taxable income
- $4,514
- Est. tax owed @ 24.0%
- −$1,083
- After-tax cash flow
- $3,691/yr
For passive investors: Depreciation is non-cash, so a rental often shows a tax loss while cash-flowing — sheltering income. Rental losses are passive: they offset passive income freely, and up to $25,000/yr can offset ordinary (W-2) income if you actively participate and your MAGI is under $100k (phasing out to $0 by $150k); unused losses carry forward. On sale, claimed depreciation is recaptured at up to 25%, and gains may owe capital-gains tax (a 1031 exchange can defer both). Figures are a year-1 estimate at your 24.0% rate — not tax advice; consult a CPA.
Schools (NCES district)
- District
- Burlington Community School District
- NCES district ID
- 1905790
- Math proficiency
- 42% ▼ -4.00%
- Reading proficiency
- 54% ▼ -1.00%
- Median HH income
- $41,833
- Composite
- 40.3/100
- National rank
- #3753
- State rank
- #286 of 289 in IA
Livability — Burlington
- Score
- 73/100
- State rank
- #287
- US rank
- #5540
Category grades
Schools grade is shown separately in the Schools card above.
Census & demographics
- Census place
- Burlington, IA
- County
- Des Moines County · 27,341 people
- City population
- 27,341
- Metro
- Burlington, IA-IL
- Population (ZIP)
- 27,341
- Household income
- $60,983
- Rent vs Own
- Severe rent burden
- 963.0
Population outlook (Des Moines County) Hauer SSP2
- Today (2025)
- 39,735 people
- By 2030
- 39,257 · -1.2%
- By 2040
- 38,090 · -4.1%
- By 2050
- 37,156 · -6.5%
- By 2075
- 36,905 · -7.1%
- By 2100
- 37,222 · -6.3%
Race, ethnicity, and origin ACS 2023
- Neighborhood character
- Predominantly White (83%)
- Race & ethnicity
- White 83% Two or more races 8% Black 5% Hispanic / Latino 4% Asian 1%
- Common ancestry
- Iranian 2% Lithuanian 2% Slovak 2%
- Foreign-born
- 3% · Canada
- Languages at home
- 95% English-only · Spanish 3% Other Asian/Pacific 1%
Political lean MEDSL · Des Moines
- 2024 margin
- R (+15.1) · D 41.8% · R 56.8% · Other 1.4%
- 2008→2024 swing
- -38.1pp toward R · 2008: 23.0pp · 2024: -15.1pp
- All cycles
- 2024: R+15.1 2020: R+8.5 2016: R+7.0 2012: D+18.5 2008: D+23.0
Not yet ingested
- Civics
- —
Market trends
- HPI YoY
- ▼ -83.48%
- Current HPI
- 149.7662
- Rent YoY
- —
- Metro
- Burlington, IA-IL
- State GDP YoY
- ▲ 2.48%
- F500 in state
- 4
Industry mix (Fortune 500 HQ in IA)
| Industry | F500 HQs | Revenue |
|---|---|---|
| Financial Services | 1 | $16B |
|
||
| Retail / Convenience | 1 | $15B |
|
||
Price history
+25.0% since first listed5 events — show timeline
- 2026-04-27 Price Changed $42,500 Muscatine BOR
- 2026-03-29 Listed $49,900 Muscatine BOR
- 2016-04-29 Sold (Public Records) $28,500 Public Records
- 2016-04-27 Sold (MLS) $24,000 IAR
- 2016-03-25 Listed $34,000 IAR
Property tax history
+1.1%/yrLatest (2025): $970 · +14.4% YoY. Source: county tax records.
Cash-flow waterfall
monthlySold comps — $/sqft
last 12 mo · ≤1 miLoading sold comps…