 6-Plex
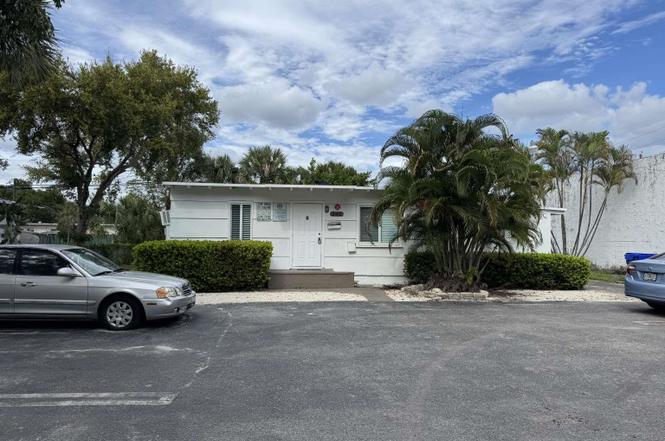
211 SW 2nd Ct · Pompano Beach, FL
Flood risk 4/10 · Minor
- FEMA flood zone
- X (shaded)
- Chance of flooding over 30 yrs
- 0.23%
- Est. flood insurance / yr
- $507 – $1,088
Fire risk 1/10 · Minimal
- Est. fire insurance / yr
- $947 – $1,759
Heat risk 10/10 · Severe
- Hot days now (above 106°F)
- 7 days/yr
- Hot days in 30 yrs
- 26 days/yr
Wind risk 10/10 · Severe
- Chance of severe wind over 30 yrs
- 99.0%
Air-quality risk 2/10 · Minimal
- Unhealthy air days now
- 1 days/yr
- Unhealthy air days in 30 yrs
- 2 days/yr
Risk factors via First Street. Map © Google.
Why this score? — see what drove the B grade
The composite is a weighted blend of 9 inputs, each scored 0–100. Each bar is that input's sub-score; the figure is the points it added to the 100-point composite (weight × sub-score).
- Cash flow +30.0/30.0
- 1% rule +10.0/10.0
- DSCR +10.0/10.0
- ARV discount +7.5/15.0
- Schools +4.1/10.0
- Livability +3.7/5.0
- Rent growth +3.0/5.0
- Condition / age +2.5/5.0
- Appreciation +0.0/10.0
$727,500
🖨 Deal sheet 📄 Offer letter ✓ Due diligence
Multi-family units
County records classify this as Multi-Family (2-4 Unit). Listing-text estimate: 6 units. estimate disagrees with records
Listing remarks
Located at 211 SW 2nd Ct in Pompano Beach, Florida, this 6-unit garden style apartment building was built in 1954, totaling 2,324 square feet. The building boasts a newer roof made of pitched composite shingle and hurricane impact windows, ensuring long-term durability and reduced insurance costs. Each unit equipped with wall unit air conditioning. The property's location is particularly advantageous due to its proximity to the dynamic developments around Pompano Beach City Hall. This area, situated less than 1 mile from the property, is undergoing significant transformation with new commercial, residential, and public projects. The ongoing redevelopment efforts include modern retail spaces
Key facts
- Newer roof
- Built 1954
- Listed 37 days
Tags
Neighborhood map
What this means for you Summary
Snapshot
- This is a 6 × 2-bed/?-bath units multifamily listed at $728k.
Deal economics
- At list price, monthly cash flow is $4k ($45k/yr) — positive. Per door: $620/mo.
- The deal already cash-flows at list — no discount required.
- Meets the 1% rule at list price ($11k rent vs $728k).
- Recommended offer: $706k (3.0% below list) — sets the bar for market timing.
- Cap rate 12.4% vs local median 3.1% in Pompano Beach — top-decile yield for the area; either an underpriced asset or a hidden risk that comps aren't pricing in. Stress-test before assuming the spread holds.
Location & tenants
- Location reads 74/100 on livability (#284 in FL, #4,541 nationally) — a middle-class / working-renter tenant base. Strengths: commute A+, housing A+, cost of living B+; Watch: employment D+, amenities F.
- Broward (suburban): math 42% / reading 53% proficiency, ranked #46 of 73 in FL (top 63%) — families likely to look elsewhere, expect single-tenant / working-renter base with shorter leases.
- Zoned schools: Cypress Elementary School (math 26% / reading 30%, grade F, #1,951 of 2,144 statewide, top 91%, 740 students, 80% FRL); Pompano Beach Middle School (math 29% / reading 40%, grade F, #421 of 571 statewide, top 74%, 1,040 students, 73% FRL); Blanche Ely High School (math 7% / reading 29%, grade F, #570 of 667 statewide, top 86%, 1,906 students, 75% FRL) — zoned schools average 76% FRL vs 51% district-wide (24 pts higher); higher-poverty schools than district average — tighter screening recommended.
- Zoned-school proficiency averages 27% at this address vs 48% district-wide (-21 pts) — the specific schools serving this property underperform the Broward average; the district grade overstates school quality for this exact location.
- Market conditions: Rents rising (+2.1%/yr); 338 active listings in the ZIP; 27 comparable units currently listed for rent nearby; rentals at typical pace (median 25d on market — plan ~3-4 weeks tenant-placement turnaround); 2,111 units permitted in Broward County in 2024 (1,265 in 5+ unit buildings).
- At $11,071/mo this rent would consume 205% of the median local household income ($65k/yr) (locally 2870% of renters already pay >50% of income on rent) — very limited rent-growth headroom before tenants either downsize or default.
Forward outlook
- Local home prices are declining (-3.0%/yr); year-one equity from $5k of loan paydown is wiped out by about $22k of value loss. Plan a longer hold.
- Broward County population projected at +34% by 2050 — long-run rental-demand tailwind backs the buy-and-hold thesis.
- At projected returns (-3.0% appreciation + 2.1% rent growth), your $204k cash investment doubles in ~6 years — after that, you're playing with house money.
Negotiation context
- It's been on market 37 days — a 3% lower offer ($706k) is reasonable based on typical stale-listing flexibility.
Risks & watch-outs
- Watch-outs: built in 1954 — expect roof / HVAC / electrical / plumbing capex.
- Climate carrying-cost: severe wind risk, 99% chance of damaging wind over 30y; extreme-heat days projected 7→26/yr by 2055 (HVAC capex compounding) — expect insurance premiums to compound above CPI over the hold.
Questions for the listing agent
- It's been on market 37 days. Have you received any prior offers? Is the seller open to a 3% concession, seller financing, or rate buy-down credit?
- Can we see the unit-by-unit rent roll, current vacancy, and any below-market leases? What's the average tenancy length?
- What capital expenditures (roof, boiler, parking lot, exteriors) have been made in the last 5 years, and what's planned in the next 2?
- Built in 1954 — when were the roof, HVAC, electrical panel, plumbing, and water heater last replaced?
- Is there a deadline driving the sale (1031 exchange, divorce, estate, relocation)? That informs how much negotiation room exists.
- Schools are D-rated, which usually means shorter tenancies and higher turnover. Who's the typical renter profile here, and what's been the actual vacancy rate?
- What's the average days-on-market for RENTAL listings here right now (not sales)? A rising rental-DOM trend means longer vacancies and softer asking-rent achievability than the comps imply.
- What's the recent tenant-quality profile in this submarket — average credit score on applications, eviction rate, late-payment / NSF rate, and stable-employment percentage? A property-management company in the area should have these aggregated.
- How much new apartment / multifamily construction is in the pipeline within 1–3 miles? Heavy new supply (>2% of stock underway) typically softens rents 12–24 months out; light construction supports rent growth.
Investment metrics
- 1% rule
- 1.52% ✓
- Cap rate
- 12.43%
- Cash-on-cash
- 21.91%
- DSCR
- 1.97
- GRM
- 5.5
CMA / ARV
No comps found within radius.
Projected returns pro-forma
-3.0% appreciation · 2.12% rent growth · sell at horizon
- IRR
- 13.6%
- Equity multiple
- 1.54×
- Total profit
- $109,396
- Equity at exit
- $108,473
- IRR
- 21.7%
- Equity multiple
- 2.78×
- Total profit
- $361,724
- Equity at exit
- $62,901
Cash invested: $203,700 (down + closing). Projections, not guarantees.
Landlord ↔ Tenant lean methodology
- Overall (STATE)
- 87 Strongly Landlord-Friendly
- State Florida
- 87 Strongly Landlord-Friendly · R+3
- County
- — inherits STATE
- City
- — inherits STATE
ZIP-level market 33060
- Home prices YoY
- -23.6%
- Rents YoY
- 2.1%
- Active inventory
- 338
- Price-to-rent
- 32.9×
Monthly cashflow live
- Estimated rent
- $11,071 medium interval (Pro) →
- Mortgage (P&I)
- −$3,815
- Tax est. 1.5%
- −$909 /mo · $10,912/yr
- Insurance
- −$303
- HOA
- −$0
- Vacancy / Maint / Mgmt
- −$2,325
- Net cashflow
- $3,719
Break-even live
6-unit breakdown (identical units grouped — click to expand)
| Units | Beds | Baths | Est. rent |
|---|---|---|---|
| 6× units | 2 | — | $11,070 |
| #1 | 2 | — | $1,845 |
| #2 | 2 | — | $1,845 |
| #3 | 2 | — | $1,845 |
| #4 | 2 | — | $1,845 |
| #5 | 2 | — | $1,845 |
| #6 | 2 | — | $1,845 |
| Total (6 units) | $11,071 | ||
UW: 25.0% down · 7.5% · 30yr · 1.5% tax · 5.0% vac · 8.0% maint · 8.0% mgmt
Financing live
Cash to close
- Down payment
- $181,875
- Closing costs
- $21,825
- Reserves months
- —
- Total cash needed
- —
Loan-product check · same deal, 3 products live
Conventional
25% down · 7.5% · 30yr
- Down + closing
- —
- Monthly P&I
- —
- Monthly cashflow
- —
- DSCR
- —
- Eligible?
- —
Personal DTI + credit; lowest rate.
DSCR
20% down · 8.5% · 30yr
- Down + closing
- —
- Monthly P&I
- —
- Monthly cashflow
- —
- DSCR
- —
- Eligible?
- —
No personal income docs; deal must DSCR.
Hard money
10% down · 12.0% · 12mo
- Down + closing
- —
- Monthly P&I
- —
- Monthly cashflow
- —
- DSCR
- —
- Eligible?
- —
Short-term bridge; refi at stabilization.
Rent comps 27 comps
| Address | Beds | Baths | Sqft | Rent | $/sqft | DOM | Units | Dist |
|---|---|---|---|---|---|---|---|---|
| 218 SW 1st Ct Pompano Beach, FL | 2.0 | 2.0 | 1912 | $2,100 | $1.10 | 24d | 1 | 0.07mi |
| 356 SW 2nd Pl Unit 1-3 Pompano Beach, FL | 2.0 | 1.0 | 2570 | $2,300 | $0.89 | 5d | 1 | 0.19mi |
| 200 NE 1st Ave Pompano Beach, FL | 2.0 | 1.0–2.5 | 1149 | $3,600 | $3.13 | 2d | 47 | 0.40mi |
| 618 SW 1st Ter Pompano Beach, FL | 3.0 | 3.0 | 1803 | $3,295 | $1.83 | 24d | 1 | 0.52mi |
| 113 SE 1st Cir Pompano Beach, FL | 3.0 | 2.5 | 2606 | $5,925 | $2.27 | 8d | 1 | 0.56mi |
| 280 SE 3rd Ct Pompano Beach, FL | 3.0 | 2.0 | 2042 | $5,900 | $2.89 | 24d | 1 | 0.57mi |
| 939 NW 3rd St Unit 939 Pompano Beach, FL | 3.0 | 2.5 | 1597 | $3,300 | $2.07 | 24d | 1 | 0.59mi |
| 161 SE 5th Ct Pompano Beach, FL | 3.0 | 2.0 | 1605 | $5,150 | $3.21 | 24d | 1 | 0.59mi |
| 720 NW 6th Ave Unit 5 Pompano Beach, FL | 2.0 | 1.0 | 2026 | $1,900 | $0.94 | 24d | 1 | 0.66mi |
| 816 NW 3rd Ter Unit 818 Pompano Beach, FL | 3.0 | 2.5 | 1597 | $3,350 | $2.10 | 24d | 1 | 0.69mi |
| 816 NW 3rd Ter Unit 818 Pompano Beach, FL | 3.0 | 2.5 | 1597 | $3,350 | $2.10 | 5d | 1 | 0.69mi |
| 844 NW 3rd Way Unit 844 Pompano Beach, FL | 3.0 | 2.5 | 1621 | $3,500 | $2.16 | 24d | 1 | 0.71mi |
| 844 NW 3rd Way Unit 844 Pompano Beach, FL | 3.0 | 2.5 | 1621 | $3,500 | $2.16 | 11d | 1 | 0.71mi |
| 170 SE 7th St #170 Pompano Beach, FL | 3.0 | 2.5 | 1798 | $3,550 | $1.97 | 10d | 1 | 0.73mi |
| 170 SE 7th St #170 Pompano Beach, FL | 3.0 | 2.5 | 1798 | $3,650 | $2.03 | 24d | 1 | 0.73mi |
| 880 NW 3rd Way Unit 880 Pompano Beach, FL | 3.0 | 2.5 | 1597 | $3,600 | $2.25 | 8d | 1 | 0.74mi |
| 880 NW 3rd Way Unit 880 Pompano Beach, FL | 3.0 | 2.5 | 1597 | $3,600 | $2.25 | 24d | 1 | 0.74mi |
| 850 SE 1st Ave Pompano Beach, FL | 3.0 | 3.0 | 1673 | $4,450 | $2.66 | 24d | 1 | 0.79mi |
| 1048 SW 1st Ter Pompano Beach, FL | 3.0 | 3.0 | 1649 | $3,800 | $2.30 | 14d | 1 | 0.89mi |
| 329 SE 12th Ave Unit 2 Pompano Beach, FL | 3.0 | 2.0 | 2280 | $4,000 | $1.75 | 22d | 1 | 1.01mi |
| 329 SE 12th Ave Unit 1 Pompano Beach, FL | 2.0 | 1.0 | 2280 | $3,000 | $1.32 | 22d | 1 | 1.01mi |
| 613 NW 15th Ave Unit 1-E Pompano Beach, FL | 2.0 | 1.0 | 2246 | $1,750 | $0.78 | 24d | 1 | 1.14mi |
| 1204 NE 7th St Pompano Beach, FL | 3.0 | 2.0 | 1747 | $6,200 | $3.55 | 24d | 1 | 1.19mi |
| 1404 NE 2nd St Pompano Beach, FL | 3.0 | 3.0 | 1931 | $4,200 | $2.18 | 21d | 1 | 1.21mi |
| 100 SW 17th St Pompano Beach, FL | 3.0 | 2.0 | 1788 | $4,500 | $2.52 | 8d | 1 | 1.40mi |
| 100 SW 17th St Pompano Beach, FL | 3.0 | 2.0 | 1788 | $4,500 | $2.52 | 24d | 1 | 1.40mi |
| 1844 SE 7th St Pompano Beach, FL | 2.0 | 2.0 | 2416 | $3,250 | $1.35 | 19d | 1 | 1.45mi |
Listing history 5 events
-
2026-06-18days on market $727,500 Active 37 DOM
-
2026-06-17statusdays on market $727,500 Active 36 DOM
-
2026-04-15status Pending
-
2026-04-15price $727,500
-
2026-02-25$775,000 Active
ⓘ Source: listings_history table (triggers on properties + properties_extension) + one-shot
backfill from property_details.listing_events for pre-trigger history.
Climate risk First Street
- Flood 4/10 Moderate FEMA zone X (shaded) · 23% chance over 30 yrs
- Wildfire 1/10 Low
- Heat 10/10 Extreme 7 d/yr ≥106°F today · 26 d/yr by 30 yrs out
- Wind 10/10 Extreme 99% chance of damaging wind over 30 yrs
- Air quality 2/10 Low 1 unhealthy d/yr today · 2 by 30 yrs out
Nearby sold comps map
Loading sold comps map…
Walkable amenities ~0.75 mi
Loading nearby amenities…
Taxation est. · year 1
- Rental income
- $132,852
- − Mortgage interest
- −$40,751
- − Property taxes
- −$10,912
- − Insurance
- −$3,638
- − Repairs & maintenance
- −$10,628
- − Management
- −$10,628
- − Depreciation
- −$21,164
- Taxable income
- $35,131
- Est. tax owed @ 24.0%
- −$8,431
- After-tax cash flow
- $36,191/yr
For passive investors: Depreciation is non-cash, so a rental often shows a tax loss while cash-flowing — sheltering income. Rental losses are passive: they offset passive income freely, and up to $25,000/yr can offset ordinary (W-2) income if you actively participate and your MAGI is under $100k (phasing out to $0 by $150k); unused losses carry forward. On sale, claimed depreciation is recaptured at up to 25%, and gains may owe capital-gains tax (a 1031 exchange can defer both). Figures are a year-1 estimate at your 24.0% rate — not tax advice; consult a CPA.
Schools (NCES district)
- District
- Broward
- NCES district ID
- 1200180
- Math proficiency
- 42% ▼ -18.00%
- Reading proficiency
- 53% ▼ -5.00%
- Median HH income
- $52,139
- Composite
- 40.88/100
- National rank
- #3621
- State rank
- #46 of 73 in FL
Livability — Pompano Beach
- Score
- 74/100
- State rank
- #284
- US rank
- #4541
Category grades
Schools grade is shown separately in the Schools card above.
Census & demographics
- Census place
- Pompano Beach, FL
- County
- Broward County · 1,963,430 people
- City population
- 155,861
- Metro
- Miami-Fort Lauderdale-Pompano Beach, FL
- Population (ZIP)
- 37,233
- Household income
- $64,819
- Rent vs Own
- Severe rent burden
- 2870.0
Population outlook (Broward County) Hauer SSP2
- Today (2025)
- 2,207,033 people
- By 2030
- 2,360,704 · +7.0%
- By 2040
- 2,661,208 · +20.6%
- By 2050
- 2,946,698 · +33.5%
- By 2075
- 3,602,273 · +63.2%
- By 2100
- 3,970,984 · +79.9%
Race, ethnicity, and origin ACS 2023
- Neighborhood character
- Diverse neighborhood (Simpson 0.69)
- Race & ethnicity
- Black 38% White 33% Hispanic / Latino 26% Two or more races 14%
- Hispanic origin (detail)
- Mexican 9% Puerto Rican 2% Cuban 3% Dominican 1%
- Common ancestry
- Hispanic 13% Romanian 2% Slovak 1%
- Foreign-born
- 31% · Canada, Jamaica
- Languages at home
- 60% English-only · Spanish 23% French/Haitian/Cajun 13% Other Indo-European 2%
Political lean MEDSL · Broward
- 2024 margin
- D (+17.0) · D 58.0% · R 41.0%
- 2008→2024 swing
- -17.8pp toward R · 2008: 34.7pp · 2024: 17.0pp
- All cycles
- 2024: D+17.0 2020: D+29.8 2016: D+35.0 2012: D+34.9 2008: D+34.7
Not yet ingested
- Civics
- —
Market trends
- HPI YoY
- ▼ -131.09%
- Current HPI
- 425.3083
- Rent YoY
- ▲ 2.12%
- Metro
- Miami-Fort Lauderdale-Pompano Beach, FL
- State GDP YoY
- ▲ 3.28%
- F500 in state
- 36
Industry mix (Fortune 500 HQ in FL)
| Industry | F500 HQs | Revenue |
|---|---|---|
| Industrial Technology | 2 | $29B |
|
||
| Insurance | 2 | $17B |
|
||
| Retail | 1 | $60B |
|
||
| Technology Distribution | 1 | $58B |
|
||
| Homebuilding | 1 | $35B |
|
||
| Technology Manufacturing | 1 | $35B |
|
||
Price history
-6.1% since first listed3 events — show timeline
- 2026-04-15 Pending — Beaches MLS
- 2026-04-15 Price Changed $727,500 Beaches MLS
- 2026-02-25 Listed $775,000 Beaches MLS
Cash-flow waterfall
monthlySold comps — $/sqft
last 12 mo · ≤1 miLoading sold comps…