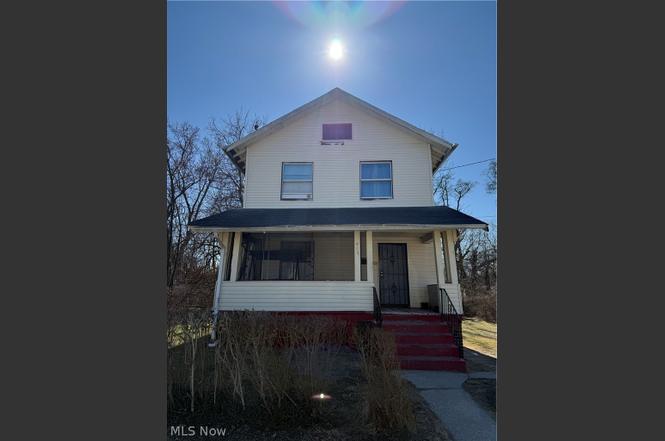
417 Kenmore Ave · Youngstown, OH
Flood risk 1/10 · Minimal
- FEMA flood zone
- X (unshaded)
- Chance of flooding over 30 yrs
- 0.0%
- Est. flood insurance / yr
- $473 – $860
Fire risk 1/10 · Minimal
- Est. fire insurance / yr
- $713 – $1,323
Heat risk 3/10 · Minor
- Hot days now (above 96°F)
- 7 days/yr
- Hot days in 30 yrs
- 17 days/yr
Wind risk 1/10 · Minimal
- Chance of severe wind over 30 yrs
- —
Air-quality risk 2/10 · Minimal
- Unhealthy air days now
- 1 days/yr
- Unhealthy air days in 30 yrs
- 2 days/yr
Risk factors via First Street. Map © Google.
Why this score? — see what drove the B grade
The composite is a weighted blend of 9 inputs, each scored 0–100. Each bar is that input's sub-score; the figure is the points it added to the 100-point composite (weight × sub-score).
- Cash flow +30.0/30.0
- ARV discount +15.0/15.0
- 1% rule +10.0/10.0
- DSCR +10.0/10.0
- Livability +4.0/5.0
- Rent growth +2.5/5.0
- Condition / age +2.5/5.0
- Schools +0.9/10.0
- Appreciation +0.0/10.0
$44,000
🖨 Deal sheet (PDF) 📄 Offer letter ✓ Due diligence
Listing remarks
Great rental. 3 Bedroom 1 bath house. Furnace 10 years. Roof 5 years. New hot water tank and electrical panel. Tenant in place, long term (8 years) pays $750.
Key facts
- New hot water tank
- Furnace 10 years
- New electrical panel
Tags
Property features AI
Finance
- Other:
- Financial info:
- HOA & community:
Exterior
- Parking:
- Security:
- Utilities: Public water; Public sewer
- Home design: 2-story house; Above-grade finished living area about 1,204 (source: assessor)
- Construction: Built per public records; Asphalt and fiberglass roof
- Exterior features: Aluminum siding; Lot approximately 0.103 acres
Interior
- Kitchen:
- Bedrooms: Total rooms: 6
- Flooring:
- Bathrooms: 1 full bathroom
- Heating & cooling: Baseboard heating; Heating present
- Interior features: Full basement
- Laundry & utility:
Neighborhood map
What this means for you Summary
Snapshot
- This is a 3-bed/1.0-bath single-family listed at $44k.
Deal economics
- At list price, monthly cash flow is $699 ($8k/yr) — positive.
- The deal already cash-flows at list — no discount required.
- Meets the 1% rule at list price ($1k rent vs $44k).
- Recommended offer: $40k (9.0% below list) — sets the bar for market timing.
- Cap rate 25.4% vs local median 6.9% in Youngstown — top-decile yield for the area; either an underpriced asset or a hidden risk that comps aren't pricing in. Stress-test before assuming the spread holds.
Location & tenants
- Location reads 81/100 on livability (#99 in OH, #1,506 nationally) — a professional / high-income tenant draw. Strengths: amenities A+, commute A+, cost of living A+; Watch: crime F, employment F.
- Youngstown City (urban): math 8% / reading 17% proficiency, ranked #649 of 656 in OH (top 99%) — low school quality limits family demand, transient renter base, plan for 1-2y turnover; 88% free/reduced lunch — lower-income household profile, screen leases tightly.
- Market conditions: 79 active listings in the ZIP; 4 comparable units currently listed for rent nearby; rentals at typical pace (median 23d on market — plan ~3-4 weeks tenant-placement turnaround); 147 units permitted in Mahoning County in 2024 (0 in 5+ unit buildings).
Forward outlook
- Local home prices are declining (-3.0%/yr); year-one equity from $304 of loan paydown is wiped out by about $1k of value loss. Plan a longer hold.
- Mahoning County population projected at -14% by 2050 — secular population decline; favor cash flow + early exit over multi-decade hold.
- At projected returns (-3.0% appreciation + 3.0% rent growth), your $12k cash investment doubles in ~2 years — after that, you're playing with house money.
Negotiation context
- It's been on market 111 days — a 9% lower offer ($40k) is reasonable based on typical stale-listing flexibility.
- 2 sale attempts with the ask held roughly flat each time — persistent listings suggest the price (not the market) is what's stuck; bring a comps-based counter.
Risks & watch-outs
- Watch-outs: built in 1914 — expect roof / HVAC / electrical / plumbing capex.
Questions for the listing agent
- It's been on market 111 days. Have you received any prior offers? Is the seller open to a 9% concession, seller financing, or rate buy-down credit?
- Built in 1914 — when were the roof, HVAC, electrical panel, plumbing, and water heater last replaced?
- Why hasn't it sold? Are there any deal-killer items the seller is aware of (foundation, flood, title, zoning, code violations)?
- Is there a deadline driving the sale (1031 exchange, divorce, estate, relocation)? That informs how much negotiation room exists.
- Crime grade is F in this area — have there been break-ins, vandalism, or insurance claims at this property in the last 3 years? What carrier currently insures it and at what premium?
- What's the average days-on-market for RENTAL listings here right now (not sales)? A rising rental-DOM trend means longer vacancies and softer asking-rent achievability than the comps imply.
- What's the recent tenant-quality profile in this submarket — average credit score on applications, eviction rate, late-payment / NSF rate, and stable-employment percentage? A property-management company in the area should have these aggregated.
- How much new for-sale + rental construction is in the pipeline within 1–3 miles? Heavy new supply typically softens prices + rents 12–24 months out; constrained supply supports both.
Investment metrics
- 1% rule
- 2.77% ✓
- Cap rate
- 25.35%
- Cash-on-cash
- 68.08%
- DSCR
- 4.03
- GRM
- 3.0
CMA / ARV
- ARV (on-the-fly)
- $52,976
- Comps found
- 6
Show comp detail 6 sales within ~0.75 mi
| Address | Dist | Beds/Ba | Sqft | Sold | Price | $/sf | Match |
|---|---|---|---|---|---|---|---|
| 408 Breaden St | 0.20mi | 3/1.0 | 1,198 (-0%) | 2mo | $98,000 | $82 | 88 |
| 519 Kenmore Ave | 0.12mi | 3/2.0 | 1,328 (+10%) | 17mo | $59,000 | $44 | 59 |
| 510 W Evergreen Ave | 0.45mi | 3/2.0 | 1,266 (+5%) | 10mo | $47,500 | $38 | 59 |
| 114 W Chalmers Ave | 0.38mi | 3/1.5 | 1,242 (+3%) | 20mo | $100,000 | $81 | 58 |
| 605 W Warren Ave | 0.46mi | 3/1.5 | 1,312 (+9%) | 5mo | $52,500 | $40 | 57 |
| 193 W Glenaven Ave | 0.54mi | 3/1.5 | 1,368 (+14%) | 17mo | $20,000 | $15 | 36 |
Match score weights: distance 35% · size 25% · config 20% · recency 20%. Top-matched comps best support the ARV.
Projected returns pro-forma
-3.0% appreciation · 3.0% rent growth · sell at horizon
- IRR
- 67.5%
- Equity multiple
- 4.03×
- Total profit
- $37,379
- Equity at exit
- $6,561
- IRR
- 71.6%
- Equity multiple
- 8.29×
- Total profit
- $89,845
- Equity at exit
- $3,804
Cash invested: $12,320 (down + closing). Projections, not guarantees.
Landlord ↔ Tenant lean methodology
- Overall (STATE)
- 73 Landlord-Friendly
- State Ohio
- 73 Landlord-Friendly · R+6
- County
- — inherits STATE
- City
- — inherits STATE
ZIP-level market 44511
- Home prices YoY
- -12.6%
- Active inventory
- 79
- Price-to-rent
- 3.0×
Monthly cashflow live
- Estimated rent
- $1,220 medium interval (Pro) →
- Mortgage (P&I)
- −$231
- Tax from tax record
- −$16 /mo · $194/yr
- Insurance
- −$18
- HOA
- −$0
- Vacancy / Maint / Mgmt
- −$256
- Net cashflow
- $699
Break-even live
Sensitivity live
| Price | -10% $724 | -5% $711 | +0% $699 | +5% $686 | +10% $674 |
|---|---|---|---|---|---|
| Rent | -10% $602 | -5% $651 | +0% $699 | +5% $747 | +10% $795 |
| Rate | -1.0pp $721 | -0.5pp $710 | base $699 | +0.5pp $688 | +1.0pp $676 |
UW: 25.0% down · 7.5% · 30yr · 1.5% tax · 5.0% vac · 8.0% maint · 8.0% mgmt
Financing live
Cash to close
- Down payment
- $11,000
- Closing costs
- $1,320
- Reserves months
- —
- Total cash needed
- —
Loan-product check · same deal, 3 products live
Conventional
25% down · 7.5% · 30yr
- Down + closing
- —
- Monthly P&I
- —
- Monthly cashflow
- —
- DSCR
- —
- Eligible?
- —
Personal DTI + credit; lowest rate.
DSCR
20% down · 8.5% · 30yr
- Down + closing
- —
- Monthly P&I
- —
- Monthly cashflow
- —
- DSCR
- —
- Eligible?
- —
No personal income docs; deal must DSCR.
Hard money
10% down · 12.0% · 12mo
- Down + closing
- —
- Monthly P&I
- —
- Monthly cashflow
- —
- DSCR
- —
- Eligible?
- —
Short-term bridge; refi at stabilization.
Rent comps 4 comps
| Address | Beds | Baths | Sqft | Rent | $/sqft | DOM | Units | Dist |
|---|---|---|---|---|---|---|---|---|
| 546 Breaden St Youngstown, OH | 3.0 | 1.0 | 1430 | $1,080 | $0.76 | 22d | 1 | 0.26mi |
| 913 Hawthorne St Youngstown, OH | 3.0 | 1.0 | 1198 | $1,080 | $0.90 | 22d | 1 | 0.56mi |
| 911 Hawthorne St Youngstown, OH | 3.0 | 1.0 | 1198 | $1,080 | $0.90 | 22d | 1 | 0.56mi |
| 35 Whitney Ave N Youngstown, OH | 3.0 | 1.0 | 1144 | $1,050 | $0.92 | 22d | 1 | 1.22mi |
Listing history 21 events
-
2026-06-21days on market $44,000 Active 111 DOM
-
2026-06-19days on market $44,000 Active 109 DOM
-
2026-06-18days on market $44,000 Active 108 DOM
-
2026-06-17days on market $44,000 Active 107 DOM
-
2026-06-16days on market $44,000 Active 106 DOM
-
2026-06-15days on market $44,000 Active 105 DOM
-
2026-06-14days on market $44,000 Active 103 DOM
-
2026-06-13days on market $44,000 Active 102 DOM
-
2026-06-10days on market $44,000 Active 100 DOM
-
2026-06-09days on market $44,000 Active 99 DOM
-
2026-06-08days on market $44,000 Active 98 DOM
-
2026-06-07days on market $44,000 Active 97 DOM
-
2026-06-03days on market $44,000 Active 93 DOM
-
2026-06-02days on market $44,000 Active 92 DOM
-
2026-06-01days on market $44,000 Active 91 DOM
-
2026-05-31days on market $44,000 Active 90 DOM
-
2026-05-30days on market $44,000 Active 89 DOM
-
2026-05-12historical Contingent
-
2026-03-13status Active
-
2026-03-05historical Contingent
-
2026-03-02$44,000 Active
ⓘ Source: listings_history table (triggers on properties + properties_extension) + one-shot
backfill from property_details.listing_events for pre-trigger history.
Tax reassessment forecast OH · Partial reset (capped growth)
- Current annual tax
- $194 · $16/mo
- Projected year-2 tax
- $440 · $37/mo
- Expected delta
- +$246/yr (+$21/mo · 127.2%)
ⓘ Screening estimate from a state-policy table — verify with the county assessor before closing.
Climate risk First Street
- Flood 1/10 Low FEMA zone X (unshaded) · 0% chance over 30 yrs
- Wildfire 1/10 Low
- Heat 3/10 Moderate 7 d/yr ≥96°F today · 17 d/yr by 30 yrs out
- Wind 1/10 Low
- Air quality 2/10 Low 1 unhealthy d/yr today · 2 by 30 yrs out
Nearby sold comps map
Loading sold comps map…
Walkable amenities ~0.75 mi
Loading nearby amenities…
Taxation est. · year 1
- Rental income
- $14,645
- − Mortgage interest
- −$2,465
- − Property taxes
- −$194
- − Insurance
- −$220
- − Repairs & maintenance
- −$1,172
- − Management
- −$1,172
- − Depreciation
- −$1,280
- Taxable income
- $8,143
- Est. tax owed @ 24.0%
- −$1,954
- After-tax cash flow
- $6,433/yr
For passive investors: Depreciation is non-cash, so a rental often shows a tax loss while cash-flowing — sheltering income. Rental losses are passive: they offset passive income freely, and up to $25,000/yr can offset ordinary (W-2) income if you actively participate and your MAGI is under $100k (phasing out to $0 by $150k); unused losses carry forward. On sale, claimed depreciation is recaptured at up to 25%, and gains may owe capital-gains tax (a 1031 exchange can defer both). Figures are a year-1 estimate at your 24.0% rate — not tax advice; consult a CPA.
Schools (NCES district)
- District
- Youngstown City
- NCES district ID
- 3904516
- Math proficiency
- 8% ▼ -15.00%
- Reading proficiency
- 17% ▼ -10.00%
- Median HH income
- $25,257
- Composite
- 9.29/100
- National rank
- #9858
- State rank
- #649 of 656 in OH
Livability — Youngstown
- Score
- 81/100
- State rank
- #99
- US rank
- #1506
Category grades
Schools grade is shown separately in the Schools card above.
Census & demographics
- Census place
- Youngstown, OH
- County
- Mahoning County · 84,956 people
- City population
- 28,503
- Metro
- Youngstown-Warren-Boardman, OH-PA
- Population (ZIP)
- 18,909
- Household income
- $56,880
- Rent vs Own
- Severe rent burden
- 336.0
Population outlook (Mahoning County) Hauer SSP2
- Today (2025)
- 223,932 people
- By 2030
- 218,387 · -2.5%
- By 2040
- 205,367 · -8.3%
- By 2050
- 193,606 · -13.5%
- By 2075
- 173,694 · -22.4%
- By 2100
- 151,147 · -32.5%
Race, ethnicity, and origin ACS 2023
- Neighborhood character
- Majority White (64%)
- Race & ethnicity
- White 64% Black 23% Hispanic / Latino 8% Two or more races 7% Native American 1%
- Hispanic origin (detail)
- Mexican 2% Puerto Rican 4%
- Common ancestry
- Romanian 5% Lithuanian 1% Slovak 1%
- Foreign-born
- 1% · Canada
- Languages at home
- 96% English-only · Spanish 3%
Political lean MEDSL · Mahoning
- 2024 margin
- Lean R (+9.4) · D 44.9% · R 54.4%
- 2008→2024 swing
- -36.1pp toward R · 2008: 26.6pp · 2024: -9.4pp
- All cycles
- 2024: R+9.4 2020: R+1.9 2016: D+3.0 2012: D+27.7 2008: D+26.6
Not yet ingested
- Civics
- —
Market trends
- HPI YoY
- ▼ -40.81%
- Current HPI
- 283.9088
- Rent YoY
- —
- Metro
- Youngstown-Warren-Boardman, OH-PA
- State GDP YoY
- ▲ 1.98%
- F500 in state
- 48
Industry mix (Fortune 500 HQ in OH)
| Industry | F500 HQs | Revenue |
|---|---|---|
| Insurance | 3 | $145B |
|
||
| Industrial Machinery | 3 | $49B |
|
||
| Financial Services | 3 | $24B |
|
||
| Consumer Goods | 2 | $93B |
|
||
| Aerospace / Defense | 2 | $47B |
|
||
| Utilities | 2 | $33B |
|
||
Price history
4 events — show timeline
- 2026-05-12 Contingent — MLSNOW
- 2026-03-13 Relisted — MLSNOW
- 2026-03-05 Contingent — MLSNOW
- 2026-03-02 Listed $44,000 MLSNOW
Property tax history
+3.7%/yrLatest (2025): $194 · -11.7% YoY. Source: county tax records.
Cash-flow waterfall
monthlySold comps — $/sqft
last 12 mo · ≤1 miLoading sold comps…