598 Blackbear Rd · Lely Resort, FL
Flood risk 9/10 · Severe
- FEMA flood zone
- AE
- Chance of flooding over 30 yrs
- 0.99%
- Est. flood insurance / yr
- $1,737 – $8,500
Fire risk 4/10 · Minor
- Est. fire insurance / yr
- $947 – $1,759
Heat risk 10/10 · Severe
- Hot days now (above 108°F)
- 7 days/yr
- Hot days in 30 yrs
- 29 days/yr
Wind risk 10/10 · Severe
- Chance of severe wind over 30 yrs
- 99.0%
Air-quality risk 2/10 · Minimal
- Unhealthy air days now
- 2 days/yr
- Unhealthy air days in 30 yrs
- 2 days/yr
Risk factors via First Street. Map © Google.
Why this score? — see what drove the B grade
The composite is a weighted blend of 9 inputs, each scored 0–100. Each bar is that input's sub-score; the figure is the points it added to the 100-point composite (weight × sub-score).
- Cash flow +30.0/30.0
- 1% rule +10.0/10.0
- DSCR +10.0/10.0
- ARV discount +7.5/15.0
- Schools +5.0/10.0
- Rent growth +3.9/5.0
- Condition / age +3.8/5.0
- Livability +3.1/5.0
- Appreciation +0.0/10.0
$117,000
🖨 Deal sheet 📄 Offer letter ✓ Due diligence
Listing remarks
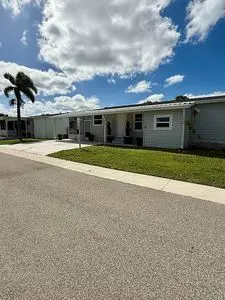
Move in ready tastefully decorated manufactured home in Tall Oaks 55+ community. 2 Bed / 2 Bath with a newly renovated kitchen. Open floorplan with dining room, livingroom and family room. Primary bedroom with private bath and large closets. Screened in lanai and storage shed. HOA includes pool, hottub, pickleball, tennis and more! Shared fully grown and producing avacado tree in the back yard. Very convenient to shopping and only 8 miles from the beach and downtown Naples! Comes fully furnished and ready to move in to today!
Key facts
- Hoa includes pool
- Storage shed
- Screened in lanai
Tags
Property features AI
Exterior
- Home design: Built in 1996; Single-family property
- Construction: Built in 1996
- Exterior features: Located in the South Naples subdivision
Neighborhood map
What this means for you Summary
Snapshot
- This is a 2-bed/2.0-bath other listed at $117k. Condition is rated good.
Deal economics
- At list price, monthly cash flow is $2k ($30k/yr) — positive.
- The deal already cash-flows at list — no discount required.
- Meets the 1% rule at list price ($5k rent vs $117k).
- Recommended offer: $115k (1.5% below list) — sets the bar for market timing.
Location & tenants
- Location reads 61/100 on livability (#786 in FL) — a middle-class / working-renter tenant base. Strengths: crime A+, employment A-; Watch: health & safety D, schools F, amenities F.
- Collier (suburban): math 60% / reading 56% proficiency, ranked #16 of 73 in FL (top 22%) — acceptable for families but not a draw, mixed tenant base, ~2y average lease.
- Market conditions: Rents rising fast (+5.6%/yr); 597 active listings in the ZIP; 40 comparable units currently listed for rent nearby; rentals at typical pace (median 23d on market — plan ~3-4 weeks tenant-placement turnaround); solid renter incomes; 3,520 units permitted in Collier County in 2024 (959 in 5+ unit buildings).
- At $4,727/mo this rent would consume 69% of the median local household income ($82k/yr) (locally 954% of renters already pay >50% of income on rent) — very limited rent-growth headroom before tenants either downsize or default.
Forward outlook
- Local home prices are declining (-3.0%/yr); year-one equity from $809 of loan paydown is wiped out by about $4k of value loss. Plan a longer hold.
- Collier County population projected at +30% by 2050 — long-run rental-demand tailwind backs the buy-and-hold thesis.
- At projected returns (-3.0% appreciation + 5.6% rent growth), your $33k cash investment doubles in ~2 years — after that, you're playing with house money.
Negotiation context
- It's been on market 15 days — a 2% lower offer ($115k) is reasonable based on typical stale-listing flexibility.
Risks & watch-outs
- Watch-outs: flood insurance adds $427/mo.
- Climate carrying-cost: in FEMA flood zone AE (mandatory federal flood insurance); severe wind risk, 99% chance of damaging wind over 30y; extreme-heat days projected 7→29/yr by 2055 (HVAC capex compounding) — expect insurance premiums to compound above CPI over the hold.
Questions for the listing agent
- What's the actual annual flood-insurance premium (NFIP or private), and is the property in a SFHA with mandatory coverage?
- Is there a deadline driving the sale (1031 exchange, divorce, estate, relocation)? That informs how much negotiation room exists.
- Schools are F-rated, which usually means shorter tenancies and higher turnover. Who's the typical renter profile here, and what's been the actual vacancy rate?
- What's the average days-on-market for RENTAL listings here right now (not sales)? A rising rental-DOM trend means longer vacancies and softer asking-rent achievability than the comps imply.
- What's the recent tenant-quality profile in this submarket — average credit score on applications, eviction rate, late-payment / NSF rate, and stable-employment percentage? A property-management company in the area should have these aggregated.
- How much new for-sale + rental construction is in the pipeline within 1–3 miles? Heavy new supply typically softens prices + rents 12–24 months out; constrained supply supports both.
Investment metrics
- 1% rule
- 4.04% ✓
- Cap rate
- 36.30%
- Cash-on-cash
- 107.17%
- DSCR
- 5.77
- GRM
- 2.1
CMA / ARV
No comps found within radius.
Projected returns pro-forma
-3.0% appreciation · 5.59% rent growth · sell at horizon
- IRR
- 95.6%
- Equity multiple
- 5.68×
- Total profit
- $153,180
- Equity at exit
- $17,445
- IRR
- 99.0%
- Equity multiple
- 13.04×
- Total profit
- $394,379
- Equity at exit
- $10,116
Cash invested: $32,760 (down + closing). Projections, not guarantees.
Landlord ↔ Tenant lean methodology
- Overall (STATE)
- 87 Strongly Landlord-Friendly
- State Florida
- 87 Strongly Landlord-Friendly · R+3
- County
- — inherits STATE
- City
- — inherits STATE
ZIP-level market 34113
- Rents YoY
- 5.6%
- Active inventory
- 597
- Price-to-rent
- 2.1×
Monthly cashflow live
- Estimated rent
- $4,727 high interval (Pro) →
- Mortgage (P&I)
- −$614
- Tax est. 1.5%
- −$146 /mo · $1,755/yr
- Insurance
- −$49
- Flood insurance flood zone
- −$427 /mo · $5,118/yr
- HOA
- −$0
- Vacancy / Maint / Mgmt
- −$993
- Net cashflow
- $2,499
Break-even live
UW: 25.0% down · 7.5% · 30yr · 1.5% tax · 5.0% vac · 8.0% maint · 8.0% mgmt
Financing live
Cash to close
- Down payment
- $29,250
- Closing costs
- $3,510
- Reserves months
- —
- Total cash needed
- —
Loan-product check · same deal, 3 products live
Conventional
25% down · 7.5% · 30yr
- Down + closing
- —
- Monthly P&I
- —
- Monthly cashflow
- —
- DSCR
- —
- Eligible?
- —
Personal DTI + credit; lowest rate.
DSCR
20% down · 8.5% · 30yr
- Down + closing
- —
- Monthly P&I
- —
- Monthly cashflow
- —
- DSCR
- —
- Eligible?
- —
No personal income docs; deal must DSCR.
Hard money
10% down · 12.0% · 12mo
- Down + closing
- —
- Monthly P&I
- —
- Monthly cashflow
- —
- DSCR
- —
- Eligible?
- —
Short-term bridge; refi at stabilization.
Rent comps 40 comps
| Address | Beds | Baths | Sqft | Rent | $/sqft | DOM | Units | Dist |
|---|---|---|---|---|---|---|---|---|
| 24 Cheyenne Trl Naples, FL | 2.0 | 2.0 | 888 | $3,500 | $3.94 | 13d | 1 | 0.36mi |
| 9175 Michael Cir #4 Naples, FL | 3.0 | 2.0 | 1639 | $3,195 | $1.95 | 13d | 1 | 0.66mi |
| 11496 Sumter Grove Cir Naples, FL | 1.0–2.0 | 1.0–2.0 | 1067 | $2,134 | $2.00 | 13d | 14 | 0.66mi |
| 1423 Santiago Cir #1702 Naples, FL | 2.0 | 2.5 | 1583 | $6,500 | $4.11 | 23d | 1 | 0.68mi |
| 1435 Santiago Cir #2003 Naples, FL | 3.0 | 2.5 | 1315 | $2,600 | $1.98 | 23d | 1 | 0.69mi |
| 9022 Michael Cir Unit 2-205 Naples, FL | 2.0 | 2.0 | 1450 | $3,500 | $2.41 | 23d | 1 | 0.75mi |
| 8540 Mystic Greens Way #305 Naples, FL | 2.0 | 2.0 | 1710 | $4,995 | $2.92 | 13d | 1 | 0.80mi |
| 1367 Artesia Dr E #302 Naples, FL | 2.0 | 2.5 | 1583 | $2,800 | $1.77 | 23d | 1 | 0.81mi |
| 22 Cypress View Dr Unit B22 Naples, FL | 2.0 | 2.0 | 1534 | $7,000 | $4.56 | 23d | 1 | 0.87mi |
| 1414 Oceania Dr S Naples, FL | 3.0 | 2.0 | 1572 | $5,000 | $3.18 | 23d | 1 | 0.90mi |
| 9844 Venezia Cir Naples, FL | 2.0 | 2.0 | 1661 | $10,250 | $6.17 | 23d | 2 | 0.93mi |
| 9832 Venezia Cir #1013 Naples, FL | 2.0 | 2.0 | 1454 | $7,000 | $4.81 | 23d | 1 | 0.96mi |
| 8468 Indian Wells Way Naples, FL | 3.0 | 2.0 | 1704 | $10,500 | $6.16 | 23d | 1 | 0.97mi |
| 8432 Indian Wells Way Naples, FL | 3.0 | 2.0 | 1746 | $3,495 | $2.00 | 13d | 1 | 1.03mi |
| 5300 Treetops Dr Unit I206 Naples, FL | 2.0 | 2.0 | 878 | $1,850 | $2.11 | 23d | 1 | 1.03mi |
| 5254 Treetops Dr Naples, FL | 2.0 | 2.0 | 878 | $1,700 | $1.94 | 23d | 1 | 1.03mi |
| 5379 Treetops Dr Unit M203 Naples, FL | 2.0 | 2.0 | 950 | $1,700 | $1.79 | 23d | 1 | 1.05mi |
| 9834 Giaveno Cir Naples, FL | 2.0 | 2.0 | 1272 | $5,225 | $4.11 | 13d | 3 | 1.06mi |
| 9834 Giaveno Cir Naples, FL | 2.0 | 2.0 | 1272 | $5,350 | $4.20 | 23d | 2 | 1.06mi |
| 5324 Treetops Dr Unit G-2 Naples, FL | 2.0 | 2.0 | 878 | $1,800 | $2.05 | 13d | 1 | 1.07mi |
| 9830 Giaveno Cir Naples, FL | 2.0 | 2.0 | 1165 | $5,100 | $4.38 | 23d | 2 | 1.07mi |
| 9815 Giaveno Ct #1234 Naples, FL | 2.0 | 2.0 | 1107 | $2,000 | $1.81 | 23d | 1 | 1.08mi |
| 8161 Twelve Oaks Cir #512 Naples, FL | 2.0 | 2.0 | 1066 | $5,000 | $4.69 | 23d | 1 | 1.10mi |
| 9826 Giaveno Cir Naples, FL | 2.0 | 2.0 | 1320 | $4,500 | $3.41 | 21d | 3 | 1.11mi |
| 9816 Giaveno Cir Naples, FL | 2.0 | 2.0 | 1213 | $3,375 | $2.78 | 23d | 2 | 1.12mi |
| 9820 Giaveno Cir Naples, FL | 2.0 | 2.0 | 1232 | $8,500 | $6.90 | 23d | 4 | 1.16mi |
| 8036 Belmont Ct Unit 1073497P Naples, FL | 3.0 | 2.0 | 1840 | $5,316 | $2.89 | 23d | 1 | 1.22mi |
| 9175 Celeste Dr Unit 105 Naples, FL | 2.0 | 2.0 | 1000 | $2,000 | $2.00 | 23d | 1 | 1.26mi |
| 9187 Celeste Dr Unit 1073494P Naples, FL | 2.0 | 2.0 | 1399 | $2,979 | $2.13 | 13d | 1 | 1.27mi |
| 7100 Falcons Glen Blvd Naples, FL | 3.0 | 2.0 | 1650 | $10,000 | $6.06 | 23d | 1 | 1.27mi |
| 9165 Celeste Dr Unit 3-303 Naples, FL | 2.0 | 2.0 | 1000 | $6,500 | $6.50 | 23d | 1 | 1.27mi |
| 7112 Falcons Glen Blvd Naples, FL | 3.0 | 2.0 | 1786 | $14,000 | $7.84 | 23d | 1 | 1.30mi |
| 6590 Beach Resort Dr Unit 305 Naples, FL | 2.0 | 2.0 | 1351 | $4,500 | $3.33 | 13d | 1 | 1.32mi |
| 6737 Bent Grass Dr Naples, FL | 3.0 | 2.0 | 1745 | $12,000 | $6.88 | 23d | 1 | 1.32mi |
| 6757 Bent Grass Dr Naples, FL | 3.0 | 2.0 | 1719 | $3,650 | $2.12 | 23d | 1 | 1.35mi |
| 9159 Delano St #9905 Naples, FL | 3.0 | 2.0 | 1770 | $4,995 | $2.82 | 23d | 1 | 1.36mi |
| 6769 Bent Grass Dr Naples, FL | 2.0 | 2.0 | 1719 | $10,500 | $6.11 | 23d | 1 | 1.37mi |
| 9155 Delano St Unit 1545913P Naples, FL | 3.0 | 2.0 | 1797 | $3,871 | $2.15 | 13d | 1 | 1.37mi |
| 6065 Divot Ct Naples, FL | 3.0 | 2.0 | 1738 | $10,000 | $5.75 | 23d | 1 | 1.38mi |
| 9151 Delano St #9702 Naples, FL | 3.0 | 2.5 | 1733 | $2,650 | $1.53 | 13d | 1 | 1.38mi |
Listing history 1 events
-
2026-05-12$117,000 Active
ⓘ Source: listings_history table (triggers on properties + properties_extension) + one-shot
backfill from property_details.listing_events for pre-trigger history.
Climate risk First Street
- Flood 9/10 Extreme FEMA zone AE · 99% chance over 30 yrs
- Wildfire 4/10 Moderate
- Heat 10/10 Extreme 7 d/yr ≥108°F today · 29 d/yr by 30 yrs out
- Wind 10/10 Extreme 99% chance of damaging wind over 30 yrs
- Air quality 2/10 Low 2 unhealthy d/yr today · 2 by 30 yrs out
Nearby sold comps map
Loading sold comps map…
Walkable amenities ~0.75 mi
Loading nearby amenities…
Taxation est. · year 1
- Rental income
- $56,722
- − Mortgage interest
- −$6,554
- − Property taxes
- −$1,755
- − Insurance
- −$5,704
- − Repairs & maintenance
- −$4,538
- − Management
- −$4,538
- − Depreciation
- −$3,404
- Taxable income
- $30,231
- Est. tax owed @ 24.0%
- −$7,255
- After-tax cash flow
- $22,734/yr
For passive investors: Depreciation is non-cash, so a rental often shows a tax loss while cash-flowing — sheltering income. Rental losses are passive: they offset passive income freely, and up to $25,000/yr can offset ordinary (W-2) income if you actively participate and your MAGI is under $100k (phasing out to $0 by $150k); unused losses carry forward. On sale, claimed depreciation is recaptured at up to 25%, and gains may owe capital-gains tax (a 1031 exchange can defer both). Figures are a year-1 estimate at your 24.0% rate — not tax advice; consult a CPA.
Condition & rehab AI · 1 photo
This move-in ready manufactured home in the Tall Oaks 55+ community is in good condition with a newly renovated kitchen. It offers a good investment opportunity with potential for modest improvements to enhance its curb appeal and value.
Value-add opportunities
- Both Landscaping improvements — Enhances curb appeal and adds value
- Both Painting exterior — Fresh paint can make the home look more appealing
- Both Landscaping improvements — Enhances curb appeal and adds value
Renovation cost estimate screening
Value-add ROI direction
- Both Landscaping improvements — Enhances curb appeal and adds value ↑
- Both Painting exterior — Fresh paint can make the home look more appealing ↑
- Both Landscaping improvements — Enhances curb appeal and adds value ↑
ⓘ Cost ranges are severity-bucket heuristics (US national rule-of-thumb). Get contractor quotes + a written scope before underwriting a rehab budget.
Schools (NCES district)
- District
- Collier
- NCES district ID
- 1200330
- Math proficiency
- 60% ▼ -4.00%
- Reading proficiency
- 56% ▼ -2.00%
- Median HH income
- $58,275
- Composite
- 50.23/100
- National rank
- #1892
- State rank
- #16 of 73 in FL
Livability — Lely Resort
- Score
- 61/100
- State rank
- #786
- US rank
- #17981
Category grades
Schools grade is shown separately in the Schools card above.
Census & demographics
- County
- Collier County · 396,295 people
- Metro
- Naples-Marco Island, FL
- Population (ZIP)
- 26,056
- Household income
- $81,674
- Rent vs Own
- Severe rent burden
- 954.0
Population outlook (Collier County) Hauer SSP2
- Today (2025)
- 420,858 people
- By 2030
- 450,054 · +6.9%
- By 2040
- 502,232 · +19.3%
- By 2050
- 544,932 · +29.5%
- By 2075
- 627,203 · +49.0%
- By 2100
- 659,015 · +56.6%
Race, ethnicity, and origin ACS 2023
- Neighborhood character
- Diverse neighborhood (Simpson 0.59)
- Race & ethnicity
- White 56% Hispanic / Latino 28% Black 12% Two or more races 11% Asian 2%
- Hispanic origin (detail)
- Mexican 17% Puerto Rican 3% Cuban 2%
- Common ancestry
- Hispanic 10% Romanian 3% Lithuanian 2%
- Foreign-born
- 26% · Canada, Jamaica, Vietnam
- Languages at home
- 63% English-only · Spanish 24% French/Haitian/Cajun 9% Other Indo-European 2%
Political lean MEDSL · Collier
- 2024 margin
- Solid R (+33.1) · D 33.1% · R 66.2%
- 2008→2024 swing
- -10.6pp toward R · 2008: -22.5pp · 2024: -33.1pp
- All cycles
- 2024: R+33.1 2020: R+24.7 2016: R+26.0 2012: R+30.1 2008: R+22.5
Not yet ingested
- Civics
- —
Market trends
- HPI YoY
- ▼ -194.86%
- Current HPI
- 279.4232
- Rent YoY
- ▲ 5.59%
- Metro
- Naples-Marco Island, FL
- State GDP YoY
- ▲ 3.28%
- F500 in state
- 36
Industry mix (Fortune 500 HQ in FL)
| Industry | F500 HQs | Revenue |
|---|---|---|
| Industrial Technology | 2 | $29B |
|
||
| Insurance | 2 | $17B |
|
||
| Retail | 1 | $60B |
|
||
| Technology Distribution | 1 | $58B |
|
||
| Homebuilding | 1 | $35B |
|
||
| Technology Manufacturing | 1 | $35B |
|
||
Price history
1 event — show timeline
- 2026-05-12 Listed $117,000 FSBO.com
Cash-flow waterfall
monthlySold comps — $/sqft
last 12 mo · ≤1 miLoading sold comps…