 Triplex
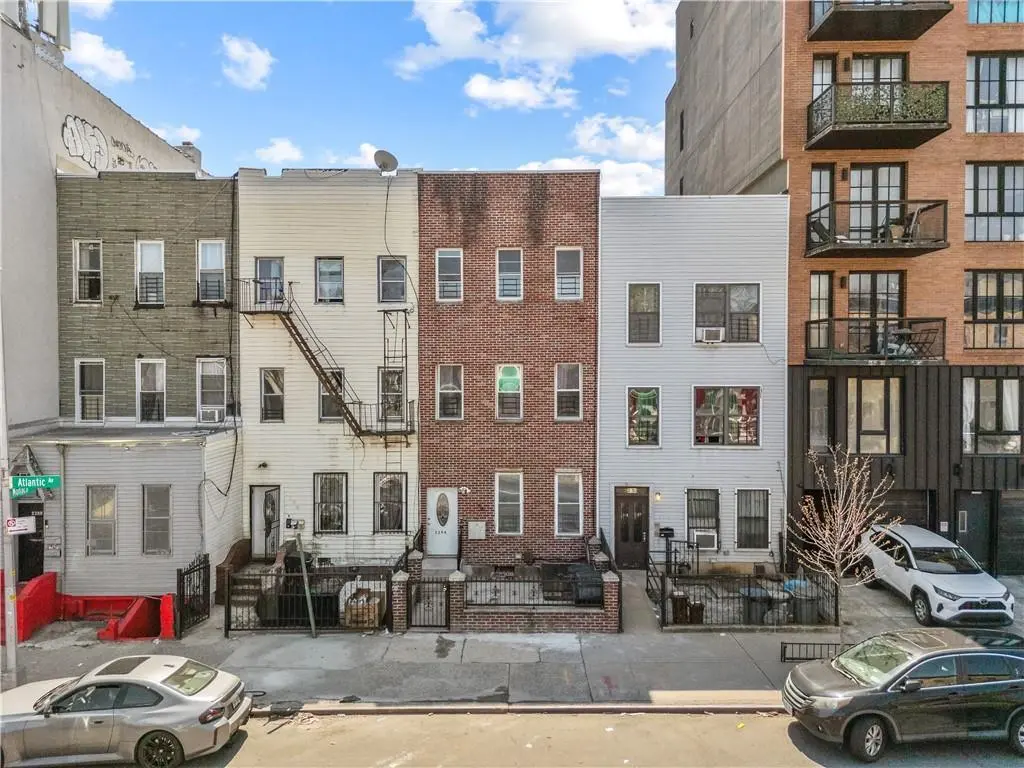
2296 Atlantic Ave · New York, NY
Flood risk 1/10 · Minimal
- FEMA flood zone
- X (unshaded)
- Chance of flooding over 30 yrs
- 0.0%
- Est. flood insurance / yr
- $507 – $1,088
Fire risk 1/10 · Minimal
- Est. fire insurance / yr
- $691 – $1,283
Heat risk 7/10 · Major
- Hot days now (above 99°F)
- 7 days/yr
- Hot days in 30 yrs
- 15 days/yr
Wind risk 6/10 · Moderate
- Chance of severe wind over 30 yrs
- 39.0%
Air-quality risk 5/10 · Moderate
- Unhealthy air days now
- 6 days/yr
- Unhealthy air days in 30 yrs
- 8 days/yr
Risk factors via First Street. Map © Google.
Why this score? — see what drove the C- grade
The composite is a weighted blend of 9 inputs, each scored 0–100. Each bar is that input's sub-score; the figure is the points it added to the 100-point composite (weight × sub-score).
- ARV discount +11.1/15.0
- Appreciation +10.0/10.0
- Cash flow +9.8/30.0
- Schools +5.0/10.0
- Rent growth +4.1/5.0
- Livability +3.8/5.0
- 1% rule +2.9/10.0
- DSCR +2.8/10.0
- Condition / age +2.5/5.0
$1,100,000
🖨 Deal sheet (PDF) 📄 Offer letter ✓ Due diligence
Multi-family units
County records classify this as Multi-Family (2-4 Unit). Listing-text estimate: 3 units. confirmed
Listing remarks MLS
CORPORATE WONED 3 FAMILY HOME BEING SOLD IN AS IS CONDITION. NO REPRESENTION. BUYER PAYS TRANSFER TAX AND STAMPS. PLEASE PROVIDE PROOF OF FUNDS TO SHOW OR VIEW AND WITH ALL OFFERS.
Key facts
- Well maintained
- Fully occupied
- 1,700 sq ft lot
Tags
Property features AI
Finance
- Other: Estimated utility expense listed
- Financial info: Financing considered: exchange, bank mortgage, or cash
Exterior
- Parking: No off-street parking
- Utilities: 110V electric; Gas service; Hot water via boiler coil
- Home design: Attached residential building; Flat roof; Building footprint approximately 765 sq ft; Building dimensions about 45.00 x 17.00; Lot number 28
- Construction: Other construction materials; Other foundation
- Exterior features: Back yard; Aluminum siding
Interior
- Flooring: Hardwood floors
- Bathrooms: 3 full bathrooms
- Heating & cooling: Gas heating; Hot water coil in boiler
- Interior features: Central A/C with three units; Hardwood floors; Cellar
Neighborhood map
What this means for you Summary
Snapshot
- This is a 3 × 2-bed/1-bath units multifamily listed at $1.10M.
Deal economics
- At list price, monthly cash flow is $-708 ($-8k/yr) — negative. Per door: $-236/mo.
- To cash-flow at today's rent, offer at most $998k (9.3% below list).
- To meet the 1% rule (rent ≥ 1% of price), the offer needs to be $873k (20.7% below list).
- Recommended offer: $873k (20.7% below list) — sets the bar for 1% rule.
- Cap rate 5.5% vs local median 2.6% in New York — top-decile yield for the area; either an underpriced asset or a hidden risk that comps aren't pricing in. Stress-test before assuming the spread holds.
Location & tenants
- Location reads 75/100 on livability (#268 in NY, #4,188 nationally) — a middle-class / working-renter tenant base. Strengths: amenities A+, commute A+, health & safety A; Watch: crime F, cost of living F.
- Zoned schools: Elm Tree Elementary School (math 27% / reading 52%, grade F, #1,444 of 2,108 statewide, top 71%, 806 students, 94% FRL); Jhs 383 Philippa Schuyler (math 32% / reading 67%, grade C, #280 of 729 statewide, top 40%, 822 students, 85% FRL); Midwood High School (math 94% / reading 96%, grade A+, #83 of 1,100 statewide, top 8%, 4,062 students, 73% FRL).
- Market conditions: Rents rising fast (+6.4%/yr); 152 active listings in the ZIP; 10,063 units permitted in Kings County in 2024 (9,789 in 5+ unit buildings).
- At $8,727/mo this rent would consume 168% of the median local household income ($62k/yr) (locally 6960% of renters already pay >50% of income on rent) — very limited rent-growth headroom before tenants either downsize or default.
Forward outlook
- In year one you build about $118k of equity ($8k loan paydown + $110k appreciation (10.0% local appreciation)).
- Kings County population projected at +13% by 2050 — modest demand growth; plan on rents tracking national, not racing it.
- By year 2, paydown + projected appreciation supports a ~$189k cash-out refi (75% LTV) — recoverable capital for the next deal without selling this one.
Negotiation context
- It's been on market 47 days — a 3% lower offer ($1.07M) is reasonable based on typical stale-listing flexibility.
- 2 sale attempts since 19y ago with the ask held roughly flat each time — persistent listings suggest the price (not the market) is what's stuck; bring a comps-based counter.
- Current owner paid $420k; list at $1.10M implies a 162% gain — meaningful room to come down on a strong offer.
Risks & watch-outs
- Watch-outs: built in 1901 — expect roof / HVAC / electrical / plumbing capex.
- Climate carrying-cost: major wind risk, 39% chance of damaging wind over 30y; extreme-heat days projected 7→15/yr by 2055 (HVAC capex compounding) — expect insurance premiums to compound above CPI over the hold.
Questions for the listing agent
- What do current leases actually rent for vs. the listed asking? Can we see a recent rent roll and the last 12 months of T-12 income?
- It's been on market 47 days. Have you received any prior offers? Is the seller open to a 21% concession, seller financing, or rate buy-down credit?
- Can we see the unit-by-unit rent roll, current vacancy, and any below-market leases? What's the average tenancy length?
- What capital expenditures (roof, boiler, parking lot, exteriors) have been made in the last 5 years, and what's planned in the next 2?
- Built in 1901 — when were the roof, HVAC, electrical panel, plumbing, and water heater last replaced?
- Is there a deadline driving the sale (1031 exchange, divorce, estate, relocation)? That informs how much negotiation room exists.
- Schools are B-rated — typically a magnet for longer-tenancy family renters. What's the average tenant stay here, and is there a school-zone premium baked into asking?
- Crime grade is F in this area — have there been break-ins, vandalism, or insurance claims at this property in the last 3 years? What carrier currently insures it and at what premium?
- What's the average days-on-market for RENTAL listings here right now (not sales)? A rising rental-DOM trend means longer vacancies and softer asking-rent achievability than the comps imply.
- What's the recent tenant-quality profile in this submarket — average credit score on applications, eviction rate, late-payment / NSF rate, and stable-employment percentage? A property-management company in the area should have these aggregated.
- How much new apartment / multifamily construction is in the pipeline within 1–3 miles? Heavy new supply (>2% of stock underway) typically softens rents 12–24 months out; light construction supports rent growth.
Investment metrics
- 1% rule
- 0.79% ✗
- Cap rate
- 5.52%
- Cash-on-cash
- -2.76%
- DSCR
- 0.88
- GRM
- 10.5
CMA / ARV
- ARV (on-the-fly)
- $1,196,640
- Comps found
- 7
Show comp detail 7 sales within ~0.75 mi
| Address | Dist | Beds/Ba | Sqft | Sold | Price | $/sf | Match |
|---|---|---|---|---|---|---|---|
| 2347 Pacific St | 0.10mi | 6/4.0 | 2,160 (0%) | 12mo | $780,000 | $361 | 66 |
| 168 Hull St | 0.25mi | 5/— | 1,942 (-10%) | 14mo | $1,375,000 | $708 | 60 |
| 443 Marion St | 0.42mi | 6/3.0 | 2,049 (-5%) | 2mo | $995,000 | $486 | 51 |
| 174 Sumpter St | 0.53mi | 5/3.0 | 2,062 (-4%) | 2mo | $1,150,000 | $558 | 46 |
| 30 Marconi Pl | 0.19mi | 6/3.0 | 2,340 (+8%) | 17mo | $1,350,000 | $577 | 43 |
| 472 Sutter Ave | 0.67mi | 6/4.0 | 2,280 (+6%) | 2mo | $999,000 | $438 | 38 |
| 235 Marion St | 0.67mi | 5/3.0 | 2,040 (-6%) | 7mo | $1,130,000 | $554 | 34 |
Match score weights: distance 35% · size 25% · config 20% · recency 20%. Top-matched comps best support the ARV.
Projected returns pro-forma
10.0% appreciation · 6.44% rent growth · sell at horizon
- IRR
- 23.4%
- Equity multiple
- 2.90×
- Total profit
- $585,405
- Equity at exit
- $990,967
- IRR
- 21.7%
- Equity multiple
- 6.95×
- Total profit
- $1,832,444
- Equity at exit
- $2,137,058
Cash invested: $308,000 (down + closing). Projections, not guarantees.
Landlord ↔ Tenant lean methodology
- Overall (CITY)
- 0 Strongly Tenant-Friendly
- State New York
- 15 Strongly Tenant-Friendly · D+10
- County
- — inherits STATE
- City New York
- 0 Strongly Tenant-Friendly · D+34
ZIP-level market 11233
- Home prices YoY
- 2.9%
- Rents YoY
- 6.4%
- Active inventory
- 152
- Price-to-rent
- 31.5×
Monthly cashflow live
- Estimated rent
- $8,727 medium interval (Pro) →
- Mortgage (P&I)
- −$5,769
- Tax est. 1.5%
- −$1,375 /mo · $16,500/yr
- Insurance
- −$458
- HOA
- −$0
- Vacancy / Maint / Mgmt
- −$1,833
- Net cashflow
- $-708
Break-even live
Sensitivity live
| Price | -10% $53 | -5% $-327 | +0% $-708 | +5% $-1,088 | +10% $-1,468 |
|---|---|---|---|---|---|
| Rent | -10% $-1,397 | -5% $-1,052 | +0% $-708 | +5% $-363 | +10% $-18 |
| Rate | -1.0pp $-154 | -0.5pp $-428 | base $-708 | +0.5pp $-993 | +1.0pp $-1,283 |
3-unit breakdown (identical units grouped — click to expand)
| Units | Beds | Baths | Est. rent |
|---|---|---|---|
| 3× units | 2 | 1 | $8,727 |
| #1 | 2 | 1 | $2,909 |
| #2 | 2 | 1 | $2,909 |
| #3 | 2 | 1 | $2,909 |
| Total (3 units) | $8,727 | ||
UW: 25.0% down · 7.5% · 30yr · 1.5% tax · 5.0% vac · 8.0% maint · 8.0% mgmt
Financing live
Cash to close
- Down payment
- $275,000
- Closing costs
- $33,000
- Reserves months
- —
- Total cash needed
- —
Loan-product check · same deal, 3 products live
Conventional
25% down · 7.5% · 30yr
- Down + closing
- —
- Monthly P&I
- —
- Monthly cashflow
- —
- DSCR
- —
- Eligible?
- —
Personal DTI + credit; lowest rate.
DSCR
20% down · 8.5% · 30yr
- Down + closing
- —
- Monthly P&I
- —
- Monthly cashflow
- —
- DSCR
- —
- Eligible?
- —
No personal income docs; deal must DSCR.
Hard money
10% down · 12.0% · 12mo
- Down + closing
- —
- Monthly P&I
- —
- Monthly cashflow
- —
- DSCR
- —
- Eligible?
- —
Short-term bridge; refi at stabilization.
Listing history 21 events
-
2026-06-21days on market $1,100,000 Active 47 DOM
-
2026-06-18days on market $1,100,000 Active 44 DOM
-
2026-06-17days on market $1,100,000 Active 43 DOM
-
2026-06-16days on market $1,100,000 Active 42 DOM
-
2026-06-15days on market $1,100,000 Active 41 DOM
-
2026-06-13days on market $1,100,000 Active 39 DOM
-
2026-06-10days on market $1,100,000 Active 35 DOM
-
2026-06-08days on market $1,100,000 Active 34 DOM
-
2026-06-08days on market $1,100,000 Active 33 DOM
-
2026-06-04days on market $1,100,000 Active 30 DOM
-
2026-06-03days on market $1,100,000 Active 29 DOM
-
2026-06-01days on market $1,100,000 Active 27 DOM
-
2026-05-31days on market $1,100,000 Active 26 DOM
-
2026-05-04$1,100,000 Active
-
2007-08-27$329,900 180-char remark
Show marketing remark (180 chars)
CORPORATE WONED 3 FAMILY HOME BEING SOLD IN AS IS CONDITION. NO REPRESENTION. BUYER PAYS TRANSFER TAX AND STAMPS. PLEASE PROVIDE PROOF OF FUNDS TO SHOW OR VIEW AND WITH ALL OFFERS.
-
2004-07-16soldstatus $420,000
-
2002-03-13soldstatus $175,000
-
2002-03-13soldstatus $361,500
-
1999-07-08soldstatus $120,000
-
1991-05-20soldstatus $37,000
-
1990-05-24soldstatus $20,000
ⓘ Source: listings_history table (triggers on properties + properties_extension) + one-shot
backfill from property_details.listing_events for pre-trigger history.
Climate risk First Street
- Flood 1/10 Low FEMA zone X (unshaded) · 0% chance over 30 yrs
- Wildfire 1/10 Low
- Heat 7/10 Severe 7 d/yr ≥99°F today · 15 d/yr by 30 yrs out
- Wind 6/10 Major 39% chance of damaging wind over 30 yrs
- Air quality 5/10 Major 6 unhealthy d/yr today · 8 by 30 yrs out
Nearby sold comps map
Loading sold comps map…
Walkable amenities ~0.75 mi
Loading nearby amenities…
Taxation est. · year 1
- Rental income
- $104,724
- − Mortgage interest
- −$61,617
- − Property taxes
- −$16,500
- − Insurance
- −$5,500
- − Repairs & maintenance
- −$8,378
- − Management
- −$8,378
- − Depreciation
- −$32,000
- Taxable loss
- −$27,649
- Est. tax savings @ 24.0%
- +$6,636
- After-tax cash flow
- $-1,855/yr
For passive investors: Depreciation is non-cash, so a rental often shows a tax loss while cash-flowing — sheltering income. Rental losses are passive: they offset passive income freely, and up to $25,000/yr can offset ordinary (W-2) income if you actively participate and your MAGI is under $100k (phasing out to $0 by $150k); unused losses carry forward. On sale, claimed depreciation is recaptured at up to 25%, and gains may owe capital-gains tax (a 1031 exchange can defer both). Figures are a year-1 estimate at your 24.0% rate — not tax advice; consult a CPA.
Schools (NCES district)
No district data.
Livability — New York
- Score
- 75/100
- State rank
- #268
- US rank
- #4188
Category grades
Schools grade is shown separately in the Schools card above.
Census & demographics
- Census place
- New York, NY
- County
- Kings County · 2,614,986 people
- City population
- 7,731,280
- Metro
- New York-Newark-Jersey City, NY-NJ-PA
- Population (ZIP)
- 81,822
- Household income
- $62,411
- Rent vs Own
- Severe rent burden
- 6960.0
Population outlook (Kings County) Hauer SSP2
- Today (2025)
- 2,847,441 people
- By 2030
- 2,937,006 · +3.1%
- By 2040
- 3,095,491 · +8.7%
- By 2050
- 3,228,968 · +13.4%
- By 2075
- 3,321,723 · +16.7%
- By 2100
- 3,111,387 · +9.3%
Race, ethnicity, and origin ACS 2023
- Neighborhood character
- Predominantly Black (65%)
- Race & ethnicity
- Black 65% Hispanic / Latino 16% White 12% Two or more races 8% Asian 2%
- Hispanic origin (detail)
- Puerto Rican 5% Dominican 5%
- Common ancestry
- Hispanic 1% Romanian 1% Lithuanian 1%
- Foreign-born
- 25% · Canada, Mexico, China
- Languages at home
- 80% English-only · Spanish 12% French/Haitian/Cajun 3% Other Indo-European 1%
Political lean MEDSL · Kings
- 2024 margin
- Solid D (+44.0) · D 72.0% · R 28.0%
- 2008→2024 swing
- -15.5pp toward R · 2008: 59.4pp · 2024: 44.0pp
- All cycles
- 2024: D+44.0 2020: D+54.8 2016: D+61.8 2012: D+63.9 2008: D+59.4
Not yet ingested
- Civics
- —
Market trends
- HPI YoY
- ▲ 18.31%
- Current HPI
- 645.4828
- Rent YoY
- ▲ 6.44%
- Metro
- New York-Newark-Jersey City, NY-NJ-PA
- State GDP YoY
- ▲ 2.60%
- F500 in state
- 92
Industry mix (Fortune 500 HQ in NY)
| Industry | F500 HQs | Revenue |
|---|---|---|
| Financial Services | 10 | $950B |
|
||
| Consumer Goods | 9 | $162B |
|
||
| Insurance | 4 | $225B |
|
||
| Telecommunications | 2 | $144B |
|
||
| Pharmaceuticals | 2 | $112B |
|
||
| Media / Entertainment | 2 | $69B |
|
||
Price history
+5400.0% since first listed8 events — show timeline
- 2026-05-04 Listed $1,100,000 BNYMLS
- 2007-08-27 Listed $329,900 BNYMLS
- 2004-07-16 Sold (Public Records) $420,000 Public Records
- 2002-03-13 Sold (Public Records) $361,500 Public Records
- 2002-03-13 Sold (Public Records) $175,000 Public Records
- 1999-07-08 Sold (Public Records) $120,000 Public Records
- 1991-05-20 Sold (Public Records) $37,000 Public Records
- 1990-05-24 Sold (Public Records) $20,000 Public Records
Property tax history
+4.7%/yrLatest (2025): $1,208 · -2.4% YoY. Source: county tax records.
Cash-flow waterfall
monthlySold comps — $/sqft
last 12 mo · ≤1 miLoading sold comps…