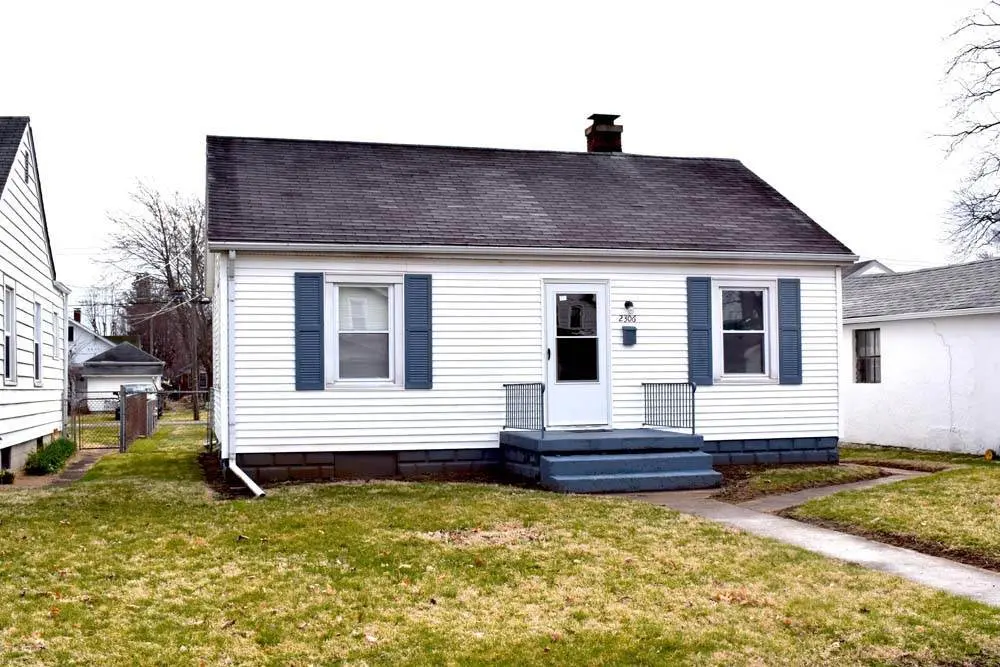
2306 Vermont Ave · Connersville, IN
Flood risk 1/10 · Minimal
- FEMA flood zone
- X (unshaded)
- Chance of flooding over 30 yrs
- 0.0%
- Est. flood insurance / yr
- $473 – $860
Fire risk 1/10 · Minimal
- Est. fire insurance / yr
- $717 – $1,331
Heat risk 3/10 · Minor
- Hot days now (above 100°F)
- 7 days/yr
- Hot days in 30 yrs
- 20 days/yr
Wind risk 2/10 · Minimal
- Chance of severe wind over 30 yrs
- 1.0%
Air-quality risk 2/10 · Minimal
- Unhealthy air days now
- 0 days/yr
- Unhealthy air days in 30 yrs
- 1 days/yr
Risk factors via First Street. Map © Google.
Why this score? — see what drove the C grade
The composite is a weighted blend of 9 inputs, each scored 0–100. Each bar is that input's sub-score; the figure is the points it added to the 100-point composite (weight × sub-score).
- Cash flow +19.2/30.0
- ARV discount +15.0/15.0
- DSCR +6.0/10.0
- 1% rule +5.4/10.0
- Livability +3.2/5.0
- Schools +2.9/10.0
- Rent growth +2.5/5.0
- Condition / age +2.5/5.0
- Appreciation +2.3/10.0
$82,500
🖨 Deal sheet (PDF) 📄 Offer letter ✓ Due diligence
Listing remarks MLS
Move-in ready! Bring the furniture -- this home is waiting on a new owner. Some of the features include detached garage and a full basement. Ready and waiting! Call today to see this cozy bungalow.
Key facts
- Full basement
- Detached garage
- 5,663 sq ft lot
Tags
Property features AI
Exterior
- Parking: Detached 1-car garage
- Utilities: Public water; Public sewer
- Home design: Single-family residence; Single-story
- Construction: Vinyl siding
- Exterior features: Shingle roof; Lot recorded as 40 x 144 (approx. 0.13 acres); Residential zoning
Interior
- Bathrooms: 1 full bathroom
- Heating & cooling: Central air conditioning; Forced air heating (natural gas)
- Interior features: Gas water heater; Total of 4 rooms
Neighborhood map
What this means for you Summary
Snapshot
- This is a 2-bed/1.0-bath single-family listed at $82k.
Deal economics
- At list price, monthly cash flow is $89 ($1k/yr) — positive.
- The deal already cash-flows at list — no discount required.
- Meets the 1% rule at list price ($858 rent vs $82k).
- Recommended offer: $81k (1.5% below list) — sets the bar for market timing.
- Cap rate 7.6% vs local median 4.9% in Connersville — top-decile yield for the area; either an underpriced asset or a hidden risk that comps aren't pricing in. Stress-test before assuming the spread holds.
Location & tenants
- Location reads 65/100 on livability (#313 in IN) — a middle-class / working-renter tenant base. Strengths: cost of living A+, housing A+; Watch: health & safety C-, crime D+, amenities F.
- Fayette County School Corporation (town): math 29% / reading 40% proficiency, ranked #206 of 301 in IN (top 68%) — families likely to look elsewhere, expect single-tenant / working-renter base with shorter leases.
- Zoned schools: Grandview Elementary School (math 27% / reading 37%, grade F, #652 of 994 statewide, top 68%, 539 students, 71% FRL); Connersville Middle School (math 21% / reading 38%, grade F, #212 of 330 statewide, top 67%, 505 students, 61% FRL); Connersville Sr High School (math 26% / reading 62%, grade F, #189 of 369 statewide, top 51%, 966 students, 55% FRL).
- Market conditions: 173 active listings in the ZIP; 20 units permitted in Fayette County in 2024 (0 in 5+ unit buildings).
Forward outlook
- Local home prices are declining (-3.0%/yr); year-one equity from $570 of loan paydown is wiped out by about $2k of value loss. Plan a longer hold.
- Fayette County population projected at -26% by 2050 — secular population decline; favor cash flow + early exit over multi-decade hold.
Negotiation context
- It's been on market 17 days — a 2% lower offer ($81k) is reasonable based on typical stale-listing flexibility.
- 3 sale attempts since 7y ago with the ask held roughly flat each time — persistent listings suggest the price (not the market) is what's stuck; bring a comps-based counter.
- Current owner paid $55k; list at $82k implies a 50% gain — meaningful room to come down on a strong offer.
Risks & watch-outs
- Watch-outs: built in 1940 — expect roof / HVAC / electrical / plumbing capex.
Questions for the listing agent
- Built in 1940 — when were the roof, HVAC, electrical panel, plumbing, and water heater last replaced?
- Is there a deadline driving the sale (1031 exchange, divorce, estate, relocation)? That informs how much negotiation room exists.
- Schools are D-rated, which usually means shorter tenancies and higher turnover. Who's the typical renter profile here, and what's been the actual vacancy rate?
- Crime grade is D in this area — have there been break-ins, vandalism, or insurance claims at this property in the last 3 years? What carrier currently insures it and at what premium?
- What's the average days-on-market for RENTAL listings here right now (not sales)? A rising rental-DOM trend means longer vacancies and softer asking-rent achievability than the comps imply.
- What's the recent tenant-quality profile in this submarket — average credit score on applications, eviction rate, late-payment / NSF rate, and stable-employment percentage? A property-management company in the area should have these aggregated.
- How much new for-sale + rental construction is in the pipeline within 1–3 miles? Heavy new supply typically softens prices + rents 12–24 months out; constrained supply supports both.
Investment metrics
- 1% rule
- 1.04% ✓
- Cap rate
- 7.58%
- Cash-on-cash
- 4.60%
- DSCR
- 1.20
- GRM
- 8.0
CMA / ARV
- ARV (on-the-fly)
- $107,280
- Comps found
- 12
Show comp detail 12 sales within ~0.75 mi
| Address | Dist | Beds/Ba | Sqft | Sold | Price | $/sf | Match |
|---|---|---|---|---|---|---|---|
| 2308 Vermont Ave | 0.01mi | 2/1.0 | 780 (+8%) | 6mo | $115,000 | $147 | 81 |
| 2250 Indiana Ave | 0.15mi | 2/1.0 | 720 (0%) | 18mo | $103,500 | $144 | 78 |
| 2320 Virginia Ave | 0.23mi | 2/1.0 | 720 (0%) | 18mo | $85,000 | $118 | 74 |
| 220 25 St | 0.31mi | 2/1.0 | 700 (-3%) | 14mo | $122,000 | $174 | 69 |
| 110 W 28th St | 0.55mi | 2/1.0 | 754 (+5%) | 1mo | $119,000 | $158 | 66 |
| 835 Scott St St | 0.48mi | 2/2.0 | 720 (0%) | 13mo | $120,500 | $167 | 63 |
| 2345 Ohio Ave | 0.29mi | 3/1.0 (+1) | 792 (+10%) | 9mo | $129,900 | $164 | 58 |
| 701 W 32nd St | 0.75mi | 2/1.0 | 744 (+3%) | 9mo | $111,000 | $149 | 52 |
| 817 Scott St | 0.44mi | 2/1.0 | 624 (-13%) | 7mo | $93,000 | $149 | 51 |
| 813 Scott St | 0.42mi | 2/1.0 | 624 (-13%) | 9mo | $70,000 | $112 | 51 |
| 619 W 18th St | 0.60mi | 2/1.0 | 815 (+13%) | 10mo | $69,900 | $86 | 41 |
| 3036 Indiana Ave | 0.68mi | 2/1.0 | 792 (+10%) | 14mo | $100,000 | $126 | 40 |
Match score weights: distance 35% · size 25% · config 20% · recency 20%. Top-matched comps best support the ARV.
Projected returns pro-forma
-3.0% appreciation · 3.0% rent growth · sell at horizon
- IRR
- -9.1%
- Equity multiple
- 0.67×
- Total profit
- $-7,700
- Equity at exit
- $12,301
- IRR
- 0.4%
- Equity multiple
- 1.03×
- Total profit
- $662
- Equity at exit
- $7,133
Cash invested: $23,100 (down + closing). Projections, not guarantees.
Landlord ↔ Tenant lean methodology
- Overall (STATE)
- 90 Strongly Landlord-Friendly
- State Indiana
- 90 Strongly Landlord-Friendly · R+11
- County
- — inherits STATE
- City
- — inherits STATE
ZIP-level market 47331
- Home prices YoY
- -2.1%
- Active inventory
- 173
- Price-to-rent
- 8.0×
Monthly cashflow live
- Estimated rent
- $858 medium interval (Pro) →
- Mortgage (P&I)
- −$433
- Tax from tax record
- −$122 /mo · $1,466/yr
- Insurance
- −$34
- HOA
- −$0
- Lot rent
- −$0
- Vacancy / Maint / Mgmt
- −$180
- Net cashflow
- $89
Break-even live
Sensitivity live
| Price | -10% $135 | -5% $112 | +0% $89 | +5% $65 | +10% $42 |
|---|---|---|---|---|---|
| Rent | -10% $21 | -5% $55 | +0% $89 | +5% $122 | +10% $156 |
| Rate | -1.0pp $130 | -0.5pp $110 | base $89 | +0.5pp $67 | +1.0pp $45 |
UW: 25.0% down · 7.5% · 30yr · 1.5% tax · 5.0% vac · 8.0% maint · 8.0% mgmt
Financing live
Cash to close
- Down payment
- $20,625
- Closing costs
- $2,475
- Reserves months
- —
- Total cash needed
- —
Loan-product check · same deal, 3 products live
Conventional
25% down · 7.5% · 30yr
- Down + closing
- —
- Monthly P&I
- —
- Monthly cashflow
- —
- DSCR
- —
- Eligible?
- —
Personal DTI + credit; lowest rate.
DSCR
20% down · 8.5% · 30yr
- Down + closing
- —
- Monthly P&I
- —
- Monthly cashflow
- —
- DSCR
- —
- Eligible?
- —
No personal income docs; deal must DSCR.
Hard money
10% down · 12.0% · 12mo
- Down + closing
- —
- Monthly P&I
- —
- Monthly cashflow
- —
- DSCR
- —
- Eligible?
- —
Short-term bridge; refi at stabilization.
Listing history 15 events
-
2026-06-22days on market $82,500 Active 17 DOM
-
2026-06-21days on market $82,500 Active 16 DOM
-
2026-06-21days on market $82,500 Active 15 DOM
-
2026-06-18price $82,500 Active 13 DOM
-
2026-06-18days on market $85,000 Active 13 DOM
-
2026-06-17days on market $85,000 Active 12 DOM
-
2026-06-16days on market $85,000 Active 11 DOM
-
2026-06-15days on market $85,000 Active 10 DOM
-
2026-06-13days on market $85,000 Active 8 DOM
-
2026-06-12days on market $85,000 Active 7 DOM
-
2026-06-09days on market $85,000 Active 4 DOM
-
2026-06-08days on market $85,000 Active 3 DOM
-
2026-06-07days on market $85,000 Active 2 DOM
-
2026-06-07remarks 658-char remark
-
2026-06-07$85,000 Active 1 DOM
ⓘ Source: listings_history table (triggers on properties + properties_extension) + one-shot
backfill from property_details.listing_events for pre-trigger history.
Tax reassessment forecast IN · Partial reset (capped growth)
- Current annual tax
- $1,466 · $122/mo
- Projected year-2 tax
- $1,466 · $122/mo
- Expected delta
- $0/yr ($0/mo · 0.0%)
ⓘ Screening estimate from a state-policy table — verify with the county assessor before closing.
Climate risk First Street
- Flood 1/10 Low FEMA zone X (unshaded) · 0% chance over 30 yrs
- Wildfire 1/10 Low
- Heat 3/10 Moderate 7 d/yr ≥100°F today · 20 d/yr by 30 yrs out
- Wind 2/10 Low 100% chance of damaging wind over 30 yrs
- Air quality 2/10 Low 0 unhealthy d/yr today · 1 by 30 yrs out
Nearby sold comps map
Loading sold comps map…
Walkable amenities ~0.75 mi
Loading nearby amenities…
Taxation est. · year 1
- Rental income
- $10,296
- − Mortgage interest
- −$4,621
- − Property taxes
- −$1,466
- − Insurance
- −$412
- − Repairs & maintenance
- −$824
- − Management
- −$824
- − Depreciation
- −$2,400
- Taxable loss
- −$252
- Est. tax savings @ 24.0%
- +$60
- After-tax cash flow
- $1,124/yr
For passive investors: Depreciation is non-cash, so a rental often shows a tax loss while cash-flowing — sheltering income. Rental losses are passive: they offset passive income freely, and up to $25,000/yr can offset ordinary (W-2) income if you actively participate and your MAGI is under $100k (phasing out to $0 by $150k); unused losses carry forward. On sale, claimed depreciation is recaptured at up to 25%, and gains may owe capital-gains tax (a 1031 exchange can defer both). Figures are a year-1 estimate at your 24.0% rate — not tax advice; consult a CPA.
Schools (NCES district)
- District
- Fayette County School Corporation
- NCES district ID
- 1803510
- Math proficiency
- 29% ▼ -11.00%
- Reading proficiency
- 40% ▼ -8.00%
- Median HH income
- $38,669
- Composite
- 28.81/100
- National rank
- #6659
- State rank
- #206 of 301 in IN
Livability — Connersville
- Score
- 65/100
- State rank
- #313
- US rank
- #12417
Category grades
Schools grade is shown separately in the Schools card above.
Census & demographics
- Census place
- Connersville, IN
- Population (ZIP)
- 22,769
Population outlook (Fayette County) Hauer SSP2
- Today (2025)
- 21,758 people
- By 2030
- 20,673 · -5.0%
- By 2040
- 18,335 · -15.7%
- By 2050
- 16,056 · -26.2%
- By 2075
- 11,030 · -49.3%
- By 2100
- 6,800 · -68.7%
Race, ethnicity, and origin ACS 2023
- Neighborhood character
- Predominantly White (94%)
- Race & ethnicity
- White 94% Two or more races 4% Hispanic / Latino 1% Black 1%
- Common ancestry
- Italian 2% Slovak 1% Lithuanian 1%
- Foreign-born
- 1% · Canada
- Languages at home
- 98% English-only · Spanish 1%
Political lean MEDSL · Fayette
- 2024 margin
- Solid R (+56.3) · D 21.2% · R 77.5% · Other 1.3%
- 2008→2024 swing
- -50.8pp toward R · 2008: -5.6pp · 2024: -56.3pp
- All cycles
- 2024: R+56.3 2020: R+54.4 2016: R+48.1 2012: R+16.9 2008: R+5.6
Not yet ingested
- Civics
- —
Market trends
- HPI YoY
- ▼ -5.33%
- Current HPI
- 252.3898
- Rent YoY
- —
- Metro
- —
- State GDP YoY
- ▲ 2.90%
- F500 in state
- 18
Industry mix (Fortune 500 HQ in IN)
| Industry | F500 HQs | Revenue |
|---|---|---|
| Industrial Machinery | 2 | $37B |
|
||
| Healthcare | 1 | $177B |
|
||
| Pharmaceuticals | 1 | $45B |
|
||
| Metals / Steel | 1 | $18B |
|
||
| Agriculture | 1 | $17B |
|
||
| Packaging | 1 | $12B |
|
||
Price history
+143.6% since first listed8 events — show timeline
- 2026-06-05 Listed $85,000 RRELMS
- 2020-03-03 Sold (Public Records) $55,000 Public Records
- 2020-03-03 Sold (Public Records) $55,000 Public Records
- 2019-05-10 Sold (Public Records) $30,000 Public Records
- 2019-05-10 Sold (MLS) $30,000 RRELMS
- 2019-05-10 Sold (MLS) $30,000 ECIAOR
- 2019-03-25 Listed $34,900 RRELMS
- 2019-03-25 Listed $34,900 ECIAOR
Property tax history
+67.7%/yrLatest (2024): $1,466 · +22.2% YoY. Source: county tax records.
Cash-flow waterfall
monthlySold comps — $/sqft
last 12 mo · ≤1 miLoading sold comps…