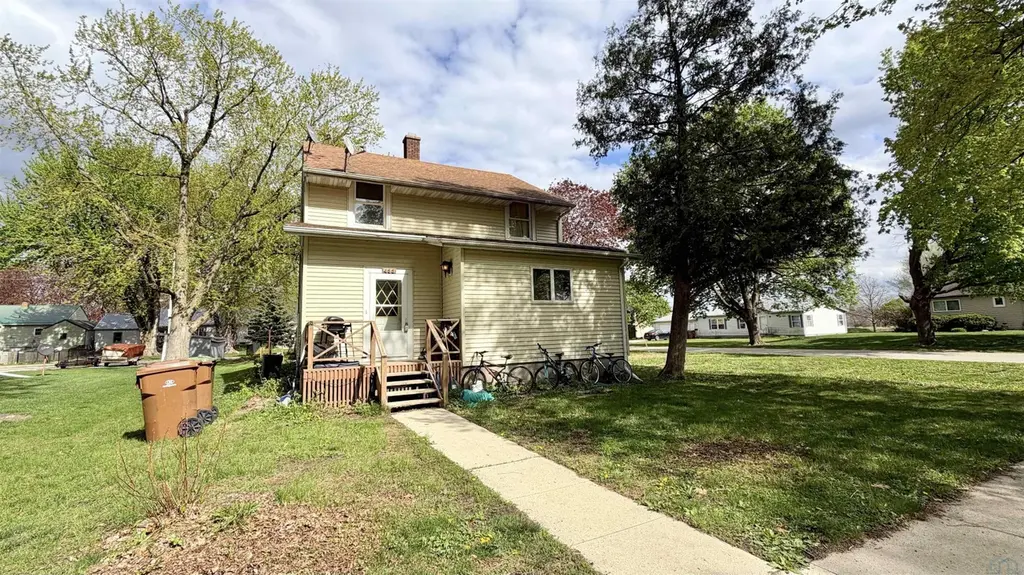
433 S Franklin St · Newell, IA
Flood risk 1/10 · Minimal
- FEMA flood zone
- X (unshaded)
- Chance of flooding over 30 yrs
- 0.0%
- Est. flood insurance / yr
- $473 – $860
Fire risk 1/10 · Minimal
- Est. fire insurance / yr
- $902 – $1,676
Heat risk 2/10 · Minimal
- Hot days now (above 101°F)
- 7 days/yr
- Hot days in 30 yrs
- 15 days/yr
Wind risk 2/10 · Minimal
- Chance of severe wind over 30 yrs
- —
Air-quality risk 1/10 · Minimal
- Unhealthy air days now
- 0 days/yr
- Unhealthy air days in 30 yrs
- 0 days/yr
Risk factors via First Street. Map © Google.
Why this score? — see what drove the B+ grade
The composite is a weighted blend of 9 inputs, each scored 0–100. Each bar is that input's sub-score; the figure is the points it added to the 100-point composite (weight × sub-score).
- Cash flow +30.0/30.0
- 1% rule +10.0/10.0
- DSCR +10.0/10.0
- ARV discount +7.5/15.0
- Appreciation +7.4/10.0
- Schools +5.6/10.0
- Livability +3.4/5.0
- Rent growth +2.5/5.0
- Condition / age +2.5/5.0
$49,900
🖨 Deal sheet 📄 Offer letter ✓ Due diligence
Listing remarks
Opportunity awaits in this spacious home offering generous room sizes and a layout full of potential. With vinyl siding and updated windows already in place, some of the big exterior items are checked off, leaving room to focus on making the interior your own. Inside, you’ll find plenty of square footage and well-sized living spaces ready for your vision. Whether you’re looking for a project to renovate, an investment property, or a home you can build equity in over time, this property offers a solid starting point. The home does require repairs and updates, including foundation work and addressing moisture-related concerns. This is reflected in the opportunity here and is best
Key facts
- 4,200 sq ft lot
- Pool
- Built 1910
Property features AI
Exterior
- Parking: No designated parking
- Utilities: Public water; Public sewer
- Home design: Single-family residence; Residential property; Fixer condition
- Construction: Vinyl siding; Shingle roof; Below-grade finished area
- Exterior features: Deck; In-ground pool; Level lot with few trees
Interior
- Bathrooms: 1 full bathroom; 1 three-quarter bathroom
- Heating & cooling: Propane forced-air heating; Central air conditioning
- Interior features: Built-in features; French doors
- Laundry & utility: Laundry on the main level
Neighborhood map
What this means for you Summary
Snapshot
- This is a 3-bed/2.0-bath single-family listed at $50k.
Deal economics
- At list price, monthly cash flow is $199 ($2k/yr) — positive.
- The deal already cash-flows at list — no discount required.
- Meets the 1% rule at list price ($800 rent vs $50k).
Location & tenants
- Location reads 68/100 on livability (#434 in IA) — a middle-class / working-renter tenant base. Strengths: cost of living A+, housing A+; Watch: health & safety D, amenities F, commute F.
- Newell-Fonda Community School District (rural): math 61% / reading 71% proficiency, ranked #186 of 289 in IA (top 64%) — acceptable for families but not a draw, mixed tenant base, ~2y average lease.
- Zoned schools: Newell-Fonda Elementary (math 67% / reading 62%, grade B, #317 of 616 statewide, top 58%, 289 students, 50% FRL); Newell-Fonda Middle Sch. (math 57% / reading 67%, grade B+, #175 of 246 statewide, top 72%, 123 students, 42% FRL); Newell-Fonda High School (math 57% / reading 77%, grade B, #192 of 336 statewide, top 59%, 166 students, 42% FRL).
- Market conditions: 9 active listings in the ZIP; 1 comparable units currently listed for rent nearby; 164 units permitted in Buena Vista County in 2024 (71 in 5+ unit buildings).
Forward outlook
- In year one you build about $3k of equity ($345 loan paydown + $2k appreciation (4.8% local appreciation)).
- Buena Vista County population projected at +12% by 2050 — modest demand growth; plan on rents tracking national, not racing it.
- At projected returns (4.8% appreciation + 3.0% rent growth), your $14k cash investment doubles in ~3 years — after that, you're playing with house money.
Negotiation context
- Only 14 days on market — expect competitive offers; lowballing is unlikely to land.
- Current owner paid $34k; 47% above their basis — modest negotiation headroom, anchor on the comps not their cost.
Risks & watch-outs
- Watch-outs: property tax is 3.6% of price; built in 1910 — expect roof / HVAC / electrical / plumbing capex.
Questions for the listing agent
- Built in 1910 — when were the roof, HVAC, electrical panel, plumbing, and water heater last replaced?
- Property tax is high relative to price — has the assessment been appealed recently, and will the sale trigger a re-assessment?
- Is there a deadline driving the sale (1031 exchange, divorce, estate, relocation)? That informs how much negotiation room exists.
- Schools are A-rated — typically a magnet for longer-tenancy family renters. What's the average tenant stay here, and is there a school-zone premium baked into asking?
- What's the average days-on-market for RENTAL listings here right now (not sales)? A rising rental-DOM trend means longer vacancies and softer asking-rent achievability than the comps imply.
- What's the recent tenant-quality profile in this submarket — average credit score on applications, eviction rate, late-payment / NSF rate, and stable-employment percentage? A property-management company in the area should have these aggregated.
- How much new for-sale + rental construction is in the pipeline within 1–3 miles? Heavy new supply typically softens prices + rents 12–24 months out; constrained supply supports both.
Investment metrics
- 1% rule
- 1.60% ✓
- Cap rate
- 11.08%
- Cash-on-cash
- 17.09%
- DSCR
- 1.76
- GRM
- 5.2
CMA / ARV
- ARV (median comp)
- $166,757
- List price
- $49,900
- Delta
- -70.08%
- Verdict
- UNDERPRICED
- Comps
- 13 within 1.0 mi
Show comp detail 2 sales within ~0.75 mi
| Address | Dist | Beds/Ba | Sqft | Sold | Price | $/sf | Match |
|---|---|---|---|---|---|---|---|
| 532 E 5th St | 0.11mi | 3/2.0 | 1,544 (-8%) | 23mo | $160,000 | $104 | 62 |
| 441 W Jensen St | 0.69mi | 4/1.5 (+1) | 1,905 (+14%) | 23mo | $145,000 | $76 | 19 |
Match score weights: distance 35% · size 25% · config 20% · recency 20%. Top-matched comps best support the ARV.
Projected returns pro-forma
4.75% appreciation · 3.0% rent growth · sell at horizon
- IRR
- 27.2%
- Equity multiple
- 2.68×
- Total profit
- $23,540
- Equity at exit
- $27,529
- IRR
- 26.4%
- Equity multiple
- 5.34×
- Total profit
- $60,680
- Equity at exit
- $46,903
Cash invested: $13,972 (down + closing). Projections, not guarantees.
Landlord ↔ Tenant lean methodology
- Overall (STATE)
- 83 Strongly Landlord-Friendly
- State Iowa
- 83 Strongly Landlord-Friendly · R+6
- County
- — inherits STATE
- City
- — inherits STATE
ZIP-level market 50568
- Home prices YoY
- 1.9%
- Active inventory
- 9
- Price-to-rent
- 5.2×
Monthly cashflow live
- Estimated rent
- $800 medium interval (Pro) →
- Mortgage (P&I)
- −$262
- Tax from tax record
- −$150 /mo · $1,806/yr
- Insurance
- −$21
- HOA
- −$0
- Vacancy / Maint / Mgmt
- −$168
- Net cashflow
- $199
Break-even live
UW: 25.0% down · 7.5% · 30yr · 1.5% tax · 5.0% vac · 8.0% maint · 8.0% mgmt
Financing live
Cash to close
- Down payment
- $12,475
- Closing costs
- $1,497
- Reserves months
- —
- Total cash needed
- —
Loan-product check · same deal, 3 products live
Conventional
25% down · 7.5% · 30yr
- Down + closing
- —
- Monthly P&I
- —
- Monthly cashflow
- —
- DSCR
- —
- Eligible?
- —
Personal DTI + credit; lowest rate.
DSCR
20% down · 8.5% · 30yr
- Down + closing
- —
- Monthly P&I
- —
- Monthly cashflow
- —
- DSCR
- —
- Eligible?
- —
No personal income docs; deal must DSCR.
Hard money
10% down · 12.0% · 12mo
- Down + closing
- —
- Monthly P&I
- —
- Monthly cashflow
- —
- DSCR
- —
- Eligible?
- —
Short-term bridge; refi at stabilization.
Rent comps 1 comps
| Address | Beds | Baths | Sqft | Rent | $/sqft | DOM | Units | Dist |
|---|---|---|---|---|---|---|---|---|
| 302 S Fulton St Unit 3 Newell, IA | 2.0 | 1.0 | 1235 | $800 | $0.65 | 43d | 1 | 0.18mi |
Listing history 3 events
-
2026-05-15status Pending 862-char remark
-
2026-05-12price $49,900 862-char remark
-
2026-05-01$59,900 Active 862-char remark
ⓘ Source: listings_history table (triggers on properties + properties_extension) + one-shot
backfill from property_details.listing_events for pre-trigger history.
Tax reassessment forecast IA · Partial reset (capped growth)
- Current annual tax
- $1,806 · $150/mo
- Projected year-2 tax
- $1,806 · $150/mo
- Expected delta
- $0/yr ($0/mo · 0.0%)
ⓘ Screening estimate from a state-policy table — verify with the county assessor before closing.
Climate risk First Street
- Flood 1/10 Low FEMA zone X (unshaded) · 0% chance over 30 yrs
- Wildfire 1/10 Low
- Heat 2/10 Low 7 d/yr ≥101°F today · 15 d/yr by 30 yrs out
- Wind 2/10 Low
- Air quality 1/10 Low 0 unhealthy d/yr today · 0 by 30 yrs out
Nearby sold comps map
Loading sold comps map…
Walkable amenities ~0.75 mi
Loading nearby amenities…
Taxation est. · year 1
- Rental income
- $9,600
- − Mortgage interest
- −$2,795
- − Property taxes
- −$1,806
- − Insurance
- −$250
- − Repairs & maintenance
- −$768
- − Management
- −$768
- − Depreciation
- −$1,452
- Taxable income
- $1,762
- Est. tax owed @ 24.0%
- −$423
- After-tax cash flow
- $1,966/yr
For passive investors: Depreciation is non-cash, so a rental often shows a tax loss while cash-flowing — sheltering income. Rental losses are passive: they offset passive income freely, and up to $25,000/yr can offset ordinary (W-2) income if you actively participate and your MAGI is under $100k (phasing out to $0 by $150k); unused losses carry forward. On sale, claimed depreciation is recaptured at up to 25%, and gains may owe capital-gains tax (a 1031 exchange can defer both). Figures are a year-1 estimate at your 24.0% rate — not tax advice; consult a CPA.
Schools (NCES district)
- District
- Newell-Fonda Community School District
- NCES district ID
- 1920580
- Math proficiency
- 61% ▼ -9.00%
- Reading proficiency
- 71% ▲ 5.00%
- Median HH income
- $49,274
- Composite
- 55.95/100
- National rank
- #1197
- State rank
- #186 of 289 in IA
Livability — Newell
- Score
- 68/100
- State rank
- #434
- US rank
- #9354
Category grades
Schools grade is shown separately in the Schools card above.
Census & demographics
- Census place
- Newell, IA
- Population (ZIP)
- 1,364
Population outlook (Buena Vista County) Hauer SSP2
- Today (2025)
- 20,775 people
- By 2030
- 21,101 · +1.6%
- By 2040
- 21,955 · +5.7%
- By 2050
- 23,202 · +11.7%
- By 2075
- 27,159 · +30.7%
- By 2100
- 29,578 · +42.4%
Race, ethnicity, and origin ACS 2023
- Neighborhood character
- Predominantly White (90%)
- Race & ethnicity
- White 90% Hispanic / Latino 4% Two or more races 3% Black 2% Pacific Islander 2%
- Common ancestry
- Iranian 3% Portuguese 3% Slovak 1%
- Foreign-born
- 2% · Canada
- Languages at home
- 95% English-only · Spanish 3% Russian/Polish/Slavic 1% Other Asian/Pacific 1%
Political lean MEDSL · Buena Vista
- 2024 margin
- Solid R (+33.3) · D 32.8% · R 66.0% · Other 1.2%
- 2008→2024 swing
- -31.5pp toward R · 2008: -1.8pp · 2024: -33.3pp
- All cycles
- 2024: R+33.3 2020: R+25.6 2016: R+25.0 2012: R+10.4 2008: R+1.8
Not yet ingested
- Civics
- —
Market trends
- HPI YoY
- ▲ 4.75%
- Current HPI
- 252.4888
- Rent YoY
- —
- Metro
- —
- State GDP YoY
- ▲ 2.48%
- F500 in state
- 4
Industry mix (Fortune 500 HQ in IA)
| Industry | F500 HQs | Revenue |
|---|---|---|
| Financial Services | 1 | $16B |
|
||
| Retail / Convenience | 1 | $15B |
|
||
Price history
-43.2% since first listed4 events — show timeline
- 2026-06-15 Sold (MLS) $34,000 NWIA
- 2026-05-15 Pending — NWIA
- 2026-05-12 Price Changed $49,900 NWIA
- 2026-05-01 Listed $59,900 NWIA
Property tax history
+6.5%/yrLatest (2025): $1,806 · +2.3% YoY. Source: county tax records.
Cash-flow waterfall
monthlySold comps — $/sqft
last 12 mo · ≤1 miLoading sold comps…