4826 Chesnee Hwy · Mayo, SC
Flood risk 1/10 · Minimal
- FEMA flood zone
- X (unshaded)
- Chance of flooding over 30 yrs
- 0.0%
- Est. flood insurance / yr
- $507 – $1,088
Fire risk 4/10 · Minor
- Est. fire insurance / yr
- $783 – $1,453
Heat risk 6/10 · Moderate
- Hot days now (above 105°F)
- 7 days/yr
- Hot days in 30 yrs
- 17 days/yr
Wind risk 2/10 · Minimal
- Chance of severe wind over 30 yrs
- 3.0%
Air-quality risk 3/10 · Minor
- Unhealthy air days now
- 3 days/yr
- Unhealthy air days in 30 yrs
- 3 days/yr
Risk factors via First Street. Map © Google.
Why this score? — see what drove the B grade
The composite is a weighted blend of 9 inputs, each scored 0–100. Each bar is that input's sub-score; the figure is the points it added to the 100-point composite (weight × sub-score).
- Cash flow +30.0/30.0
- 1% rule +10.0/10.0
- DSCR +10.0/10.0
- ARV discount +7.5/15.0
- Schools +4.5/10.0
- Livability +3.2/5.0
- Rent growth +2.5/5.0
- Condition / age +2.5/5.0
- Appreciation +0.0/10.0
$100,000
🖨 Deal sheet 📄 Offer letter ✓ Due diligence
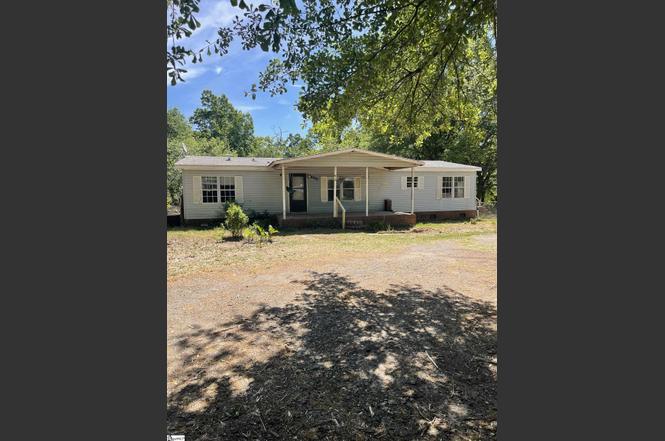
Listing remarks
If you are looking for an opportunity to make something yours, this is it! This is a spacious 3 bedroom 2 bathroom double wide mobile home that has a fenced in back yard and wrap around drive way in the front yard. It has a large front porch for sitting and entertaining. Priced to sell and ready to go. Come and tour this home today and call it yours! This is being sold AS IS.
Key facts
- Large front porch
- Fenced in back yard
- 1 acre lot
Tags
Property features AI
Finance
- HOA & community: No HOA; No community amenities
Exterior
- Parking: Driveway with gravel parking
- Utilities: Public water; Septic sewer; Electric water heater; Electric power; No garbage pickup specified; No garage
- Home design: Single-story home; Built in 1997; Crawl space foundation; Vinyl siding; Architectural roof
- Construction: Vinyl exterior; Architectural shingle roof; Crawl space foundation; Built in 1997
- Exterior features: Front porch; Patio; Fenced, level yard
Interior
- Kitchen: Kitchen approximately 9 x 10; Dishwasher; Electric cooktop; Electric oven
- Bedrooms: 3 bedrooms on the main level; Primary bedroom on main level (approximately 12 x 12); Second bedroom approximately 9 x 11; Third bedroom approximately 10 x 11
- Flooring: Laminate flooring; Vinyl flooring
- Bathrooms: 2 full bathrooms (both on the main level)
- Heating & cooling: Electric heating; Electric cooling
- Interior features: Laminate countertops; No fireplace; Attic
- Laundry & utility: Washer connection; Electric dryer hookup
Neighborhood map
What this means for you Summary
Snapshot
- This is a 3-bed/2.0-bath manufactured listed at $100k.
Deal economics
- At list price, monthly cash flow is $557 ($7k/yr) — positive.
- The deal already cash-flows at list — no discount required.
- Meets the 1% rule at list price ($2k rent vs $100k).
- Recommended offer: $91k (9.0% below list) — sets the bar for market timing.
- Cap rate 13.0% vs local median 2.7% in Mayo — top-decile yield for the area; either an underpriced asset or a hidden risk that comps aren't pricing in. Stress-test before assuming the spread holds.
Location & tenants
- Location reads 64/100 on livability (#151 in SC) — a middle-class / working-renter tenant base. Strengths: cost of living A+, housing A+, crime A; Watch: employment D+, amenities F, commute F.
- Spartanburg 02 (suburban): math 49% / reading 56% proficiency, ranked #6 of 80 in SC (top 8%) — acceptable for families but not a draw, mixed tenant base, ~2y average lease.
- Zoned schools: Mayo Elementary (math 52% / reading 47%, grade D, #168 of 597 statewide, top 31%, 338 students, 71% FRL) — zoned schools average 71% FRL vs 44% district-wide (27 pts higher); higher-poverty schools than district average — tighter screening recommended.
- Market conditions: 308 active listings in the ZIP; 3,129 units permitted in Spartanburg County in 2024 (40 in 5+ unit buildings).
Forward outlook
- Local home prices are declining (-3.0%/yr); year-one equity from $691 of loan paydown is wiped out by about $3k of value loss. Plan a longer hold.
- Spartanburg County population projected at +18% by 2050 — long-run rental-demand tailwind backs the buy-and-hold thesis.
- At projected returns (-3.0% appreciation + 3.0% rent growth), your $28k cash investment doubles in ~6 years — after that, you're playing with house money.
Negotiation context
- It's been on market 105 days — a 9% lower offer ($91k) is reasonable based on typical stale-listing flexibility.
- 2 sale attempts; this cycle's ask has dropped $35k (26%) from the opening price — seller is motivated, your offer sets the floor, not the list.
Risks & watch-outs
- Climate carrying-cost: extreme-heat days projected 7→17/yr by 2055 (HVAC capex compounding) — expect insurance premiums to compound above CPI over the hold.
Questions for the listing agent
- It's been on market 105 days. Have you received any prior offers? Is the seller open to a 9% concession, seller financing, or rate buy-down credit?
- Why hasn't it sold? Are there any deal-killer items the seller is aware of (foundation, flood, title, zoning, code violations)?
- Is there a deadline driving the sale (1031 exchange, divorce, estate, relocation)? That informs how much negotiation room exists.
- What's the average days-on-market for RENTAL listings here right now (not sales)? A rising rental-DOM trend means longer vacancies and softer asking-rent achievability than the comps imply.
- What's the recent tenant-quality profile in this submarket — average credit score on applications, eviction rate, late-payment / NSF rate, and stable-employment percentage? A property-management company in the area should have these aggregated.
- How much new for-sale + rental construction is in the pipeline within 1–3 miles? Heavy new supply typically softens prices + rents 12–24 months out; constrained supply supports both.
Investment metrics
- 1% rule
- 1.58% ✓
- Cap rate
- 12.97%
- Cash-on-cash
- 23.86%
- DSCR
- 2.06
- GRM
- 5.3
CMA / ARV
No comps found within radius.
Projected returns pro-forma
-3.0% appreciation · 3.0% rent growth · sell at horizon
- IRR
- 17.1%
- Equity multiple
- 1.69×
- Total profit
- $19,275
- Equity at exit
- $14,910
- IRR
- 25.6%
- Equity multiple
- 3.23×
- Total profit
- $62,535
- Equity at exit
- $8,646
Cash invested: $28,000 (down + closing). Projections, not guarantees.
Landlord ↔ Tenant lean methodology
- Overall (STATE)
- 90 Strongly Landlord-Friendly
- State South Carolina
- 90 Strongly Landlord-Friendly · R+6
- County
- — inherits STATE
- City
- — inherits STATE
ZIP-level market 29323
- Home prices YoY
- -8.0%
- Active inventory
- 308
- Price-to-rent
- 5.3×
Monthly cashflow live
- Estimated rent
- $1,579 medium interval (Pro) →
- Mortgage (P&I)
- −$524
- Tax est. 1.5%
- −$125 /mo · $1,500/yr
- Insurance
- −$42
- HOA
- −$0
- Vacancy / Maint / Mgmt
- −$332
- Net cashflow
- $557
Break-even live
UW: 25.0% down · 7.5% · 30yr · 1.5% tax · 5.0% vac · 8.0% maint · 8.0% mgmt
Financing live
Cash to close
- Down payment
- $25,000
- Closing costs
- $3,000
- Reserves months
- —
- Total cash needed
- —
Loan-product check · same deal, 3 products live
Conventional
25% down · 7.5% · 30yr
- Down + closing
- —
- Monthly P&I
- —
- Monthly cashflow
- —
- DSCR
- —
- Eligible?
- —
Personal DTI + credit; lowest rate.
DSCR
20% down · 8.5% · 30yr
- Down + closing
- —
- Monthly P&I
- —
- Monthly cashflow
- —
- DSCR
- —
- Eligible?
- —
No personal income docs; deal must DSCR.
Hard money
10% down · 12.0% · 12mo
- Down + closing
- —
- Monthly P&I
- —
- Monthly cashflow
- —
- DSCR
- —
- Eligible?
- —
Short-term bridge; refi at stabilization.
Listing history 5 events
-
2026-05-20status Pending
-
2026-04-21status Active
-
2026-03-23status Pending
-
2026-01-19price $100,000
-
2026-01-05$135,000 Active
ⓘ Source: listings_history table (triggers on properties + properties_extension) + one-shot
backfill from property_details.listing_events for pre-trigger history.
Climate risk First Street
- Flood 1/10 Low FEMA zone X (unshaded) · 0% chance over 30 yrs
- Wildfire 4/10 Moderate
- Heat 6/10 Major 7 d/yr ≥105°F today · 17 d/yr by 30 yrs out
- Wind 2/10 Low 3% chance of damaging wind over 30 yrs
- Air quality 3/10 Moderate 3 unhealthy d/yr today · 3 by 30 yrs out
Nearby sold comps map
Loading sold comps map…
Walkable amenities ~0.75 mi
Loading nearby amenities…
Taxation est. · year 1
- Rental income
- $18,953
- − Mortgage interest
- −$5,602
- − Property taxes
- −$1,500
- − Insurance
- −$500
- − Repairs & maintenance
- −$1,516
- − Management
- −$1,516
- − Depreciation
- −$2,909
- Taxable income
- $5,410
- Est. tax owed @ 24.0%
- −$1,298
- After-tax cash flow
- $5,382/yr
For passive investors: Depreciation is non-cash, so a rental often shows a tax loss while cash-flowing — sheltering income. Rental losses are passive: they offset passive income freely, and up to $25,000/yr can offset ordinary (W-2) income if you actively participate and your MAGI is under $100k (phasing out to $0 by $150k); unused losses carry forward. On sale, claimed depreciation is recaptured at up to 25%, and gains may owe capital-gains tax (a 1031 exchange can defer both). Figures are a year-1 estimate at your 24.0% rate — not tax advice; consult a CPA.
Schools (NCES district)
- District
- Spartanburg 02
- NCES district ID
- 4503510
- Math proficiency
- 49% ▼ -7.00%
- Reading proficiency
- 56% ▲ 2.00%
- Median HH income
- $49,591
- Composite
- 44.79/100
- National rank
- #2742
- State rank
- #6 of 80 in SC
Livability — Mayo
- Score
- 64/100
- State rank
- #151
- US rank
- #14285
Category grades
Schools grade is shown separately in the Schools card above.
Census & demographics
- Census place
- Mayo, SC
- City population
- 347
- Population (ZIP)
- 15,087
Population outlook (Spartanburg County) Hauer SSP2
- Today (2025)
- 325,495 people
- By 2030
- 338,800 · +4.1%
- By 2040
- 363,471 · +11.7%
- By 2050
- 384,156 · +18.0%
- By 2075
- 430,137 · +32.1%
- By 2100
- 442,733 · +36.0%
Race, ethnicity, and origin ACS 2023
- Neighborhood character
- Predominantly White (82%)
- Race & ethnicity
- White 82% Hispanic / Latino 7% Black 5% Two or more races 4% Asian 3%
- Hispanic origin (detail)
- Mexican 6%
- Common ancestry
- Slovak 4% Romanian 2% Serbian 2%
- Foreign-born
- 6% · Canada, Jamaica
- Languages at home
- 90% English-only · Spanish 5% Russian/Polish/Slavic 3% Other Asian/Pacific 2%
Political lean MEDSL · Spartanburg
- 2024 margin
- Solid R (+33.6) · D 32.6% · R 66.2% · Other 1.2%
- 2008→2024 swing
- -12.0pp toward R · 2008: -21.6pp · 2024: -33.6pp
- All cycles
- 2024: R+33.6 2020: R+27.3 2016: R+30.0 2012: R+23.1 2008: R+21.6
Not yet ingested
- Civics
- —
Market trends
- HPI YoY
- ▼ -25.81%
- Current HPI
- 297.6589
- Rent YoY
- —
- Metro
- —
- State GDP YoY
- ▲ 4.51%
- F500 in state
- 2
Industry mix (Fortune 500 HQ in SC)
| Industry | F500 HQs | Revenue |
|---|---|---|
| Packaging | 1 | $7B |
|
||
Price history
-25.9% since first listed5 events — show timeline
- 2026-05-20 Pending — Greater Greenville MLS
- 2026-04-21 Relisted — Greater Greenville MLS
- 2026-03-23 Pending — Greater Greenville MLS
- 2026-01-19 Price Changed $100,000 Greater Greenville MLS
- 2026-01-05 Listed $135,000 Greater Greenville MLS
Cash-flow waterfall
monthlySold comps — $/sqft
last 12 mo · ≤1 miLoading sold comps…