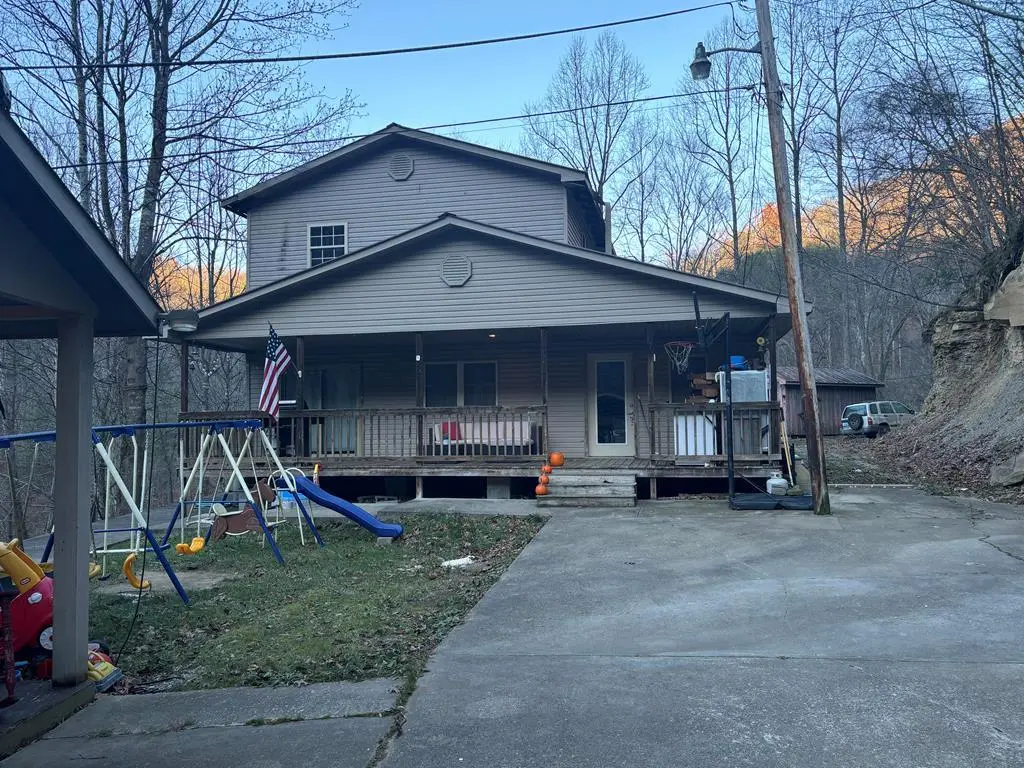
95 Nashville Dr · Millstone, KY
Flood risk 1/10 · Minimal
- FEMA flood zone
- X (unshaded)
- Chance of flooding over 30 yrs
- 0.0%
- Est. flood insurance / yr
- $473 – $860
Fire risk 6/10 · Moderate
- Est. fire insurance / yr
- $839 – $1,559
Heat risk 3/10 · Minor
- Hot days now (above 97°F)
- 7 days/yr
- Hot days in 30 yrs
- 19 days/yr
Wind risk 2/10 · Minimal
- Chance of severe wind over 30 yrs
- 1.0%
Air-quality risk 1/10 · Minimal
- Unhealthy air days now
- 0 days/yr
- Unhealthy air days in 30 yrs
- 0 days/yr
Risk factors via First Street. Map © Google.
Why this score? — see what drove the C+ grade
The composite is a weighted blend of 9 inputs, each scored 0–100. Each bar is that input's sub-score; the figure is the points it added to the 100-point composite (weight × sub-score).
- Cash flow +28.0/30.0
- DSCR +10.0/10.0
- ARV discount +7.5/15.0
- 1% rule +6.4/10.0
- Appreciation +2.7/10.0
- Rent growth +2.5/5.0
- Condition / age +2.5/5.0
- Schools +2.3/10.0
- Livability +2.2/5.0
$84,900
🖨 Deal sheet 📄 Offer letter ✓ Due diligence
Listing remarks
Fixer upper with plenty of room and tons of potential. This home is located out of the flood zone and features 4 bedrooms, a large front porch, concrete driveway, and exterior storage. Don't miss out on this one. This property is being sold AS-IS.
Key facts
- Exterior storage
- Front porch
- Concrete driveway
Tags
Property features AI
Exterior
- Utilities: Public water; Septic tank
- Home design: Single family residence; Single-story
- Construction: Vinyl siding; Shingle roof
- Exterior features: Garden; Storage structure
Interior
- Kitchen: Refrigerator; Cooktop
- Flooring: Carpet; Laminate; Vinyl
- Heating & cooling: Central air; Electric heat
- Interior features: Walk-in closet(s)
Neighborhood map
What this means for you Summary
Snapshot
- This is a 4-bed/1.5-bath single-family listed at $85k.
Deal economics
- At list price, monthly cash flow is $265 ($3k/yr) — positive.
- The deal already cash-flows at list — no discount required.
- Meets the 1% rule at list price ($970 rent vs $85k).
Location & tenants
- Location reads 44/100 on livability (#523 in KY) — a working-class tenant base; expect higher turnover. Strengths: cost of living A+, crime A; Watch: amenities F, commute F, employment F.
- Letcher County (rural): math 19% / reading 38% proficiency, ranked #127 of 165 in KY (top 77%) — low school quality limits family demand, transient renter base, plan for 1-2y turnover.
- Zoned schools: Letcher County Central High School (math 17% / reading 42%, grade F, #127 of 254 statewide, top 58%, 779 students, 62% FRL) — zoned schools at 62% FRL track the district average.
- Market conditions: 2 active listings in the ZIP.
Forward outlook
- Local home prices are declining (-3.0%/yr); year-one equity from $587 of loan paydown is wiped out by about $3k of value loss. Plan a longer hold.
- Letcher County population projected at -39% by 2050 — secular population decline; favor cash flow + early exit over multi-decade hold.
- At projected returns (-3.0% appreciation + 3.0% rent growth), your $24k cash investment doubles in ~9 years — after that, you're playing with house money.
Negotiation context
- Only 13 days on market — expect competitive offers; lowballing is unlikely to land.
Risks & watch-outs
- Climate carrying-cost: major wildfire risk — expect insurance premiums to compound above CPI over the hold.
Questions for the listing agent
- Is there a deadline driving the sale (1031 exchange, divorce, estate, relocation)? That informs how much negotiation room exists.
- What's the average days-on-market for RENTAL listings here right now (not sales)? A rising rental-DOM trend means longer vacancies and softer asking-rent achievability than the comps imply.
- What's the recent tenant-quality profile in this submarket — average credit score on applications, eviction rate, late-payment / NSF rate, and stable-employment percentage? A property-management company in the area should have these aggregated.
- How much new for-sale + rental construction is in the pipeline within 1–3 miles? Heavy new supply typically softens prices + rents 12–24 months out; constrained supply supports both.
Investment metrics
- 1% rule
- 1.14% ✓
- Cap rate
- 10.04%
- Cash-on-cash
- 13.39%
- DSCR
- 1.60
- GRM
- 7.3
CMA / ARV
No comps found within radius.
Projected returns pro-forma
-3.0% appreciation · 3.0% rent growth · sell at horizon
- IRR
- 3.4%
- Equity multiple
- 1.13×
- Total profit
- $3,094
- Equity at exit
- $12,659
- IRR
- 12.9%
- Equity multiple
- 2.02×
- Total profit
- $24,287
- Equity at exit
- $7,341
Cash invested: $23,772 (down + closing). Projections, not guarantees.
Landlord ↔ Tenant lean methodology
- Overall (STATE)
- 83 Strongly Landlord-Friendly
- State Kentucky
- 83 Strongly Landlord-Friendly · R+16
- County
- — inherits STATE
- City
- — inherits STATE
ZIP-level market 41855
- Home prices YoY
- -3.3%
- Active inventory
- 2
- Price-to-rent
- 7.3×
Monthly cashflow live
- Estimated rent
- $970 medium interval (Pro) →
- Mortgage (P&I)
- −$445
- Tax from tax record
- −$20 /mo · $243/yr
- Insurance
- −$35
- HOA
- −$0
- Vacancy / Maint / Mgmt
- −$204
- Net cashflow
- $265
Break-even live
UW: 25.0% down · 7.5% · 30yr · 1.5% tax · 5.0% vac · 8.0% maint · 8.0% mgmt
Financing live
Cash to close
- Down payment
- $21,225
- Closing costs
- $2,547
- Reserves months
- —
- Total cash needed
- —
Loan-product check · same deal, 3 products live
Conventional
25% down · 7.5% · 30yr
- Down + closing
- —
- Monthly P&I
- —
- Monthly cashflow
- —
- DSCR
- —
- Eligible?
- —
Personal DTI + credit; lowest rate.
DSCR
20% down · 8.5% · 30yr
- Down + closing
- —
- Monthly P&I
- —
- Monthly cashflow
- —
- DSCR
- —
- Eligible?
- —
No personal income docs; deal must DSCR.
Hard money
10% down · 12.0% · 12mo
- Down + closing
- —
- Monthly P&I
- —
- Monthly cashflow
- —
- DSCR
- —
- Eligible?
- —
Short-term bridge; refi at stabilization.
Listing history 12 events
-
2026-06-18days on market $84,900 Active 13 DOM
-
2026-06-17price $84,900 Active 12 DOM
-
2026-06-17days on market $94,900 Active 12 DOM
-
2026-06-16days on market $94,900 Active 11 DOM
-
2026-06-15days on market $94,900 Active 10 DOM
-
2026-06-13days on market $94,900 Active 8 DOM
-
2026-06-12days on market $94,900 Active 7 DOM
-
2026-06-09days on market $94,900 Active 4 DOM
-
2026-06-08days on market $94,900 Active 3 DOM
-
2026-06-07days on market $94,900 Active 2 DOM
-
2026-06-07remarks 247-char remark
-
2026-06-07$94,900 Active 1 DOM
ⓘ Source: listings_history table (triggers on properties + properties_extension) + one-shot
backfill from property_details.listing_events for pre-trigger history.
Tax reassessment forecast KY · Resets to sale price
- Current annual tax
- $243 · $20/mo
- Projected year-2 tax
- $730 · $61/mo
- Expected delta
- +$487/yr (+$41/mo · 200.6%)
ⓘ Screening estimate from a state-policy table — verify with the county assessor before closing.
Climate risk First Street
- Flood 1/10 Low FEMA zone X (unshaded) · 0% chance over 30 yrs
- Wildfire 6/10 Major
- Heat 3/10 Moderate 7 d/yr ≥97°F today · 19 d/yr by 30 yrs out
- Wind 2/10 Low 100% chance of damaging wind over 30 yrs
- Air quality 1/10 Low 0 unhealthy d/yr today · 0 by 30 yrs out
Nearby sold comps map
Loading sold comps map…
Walkable amenities ~0.75 mi
Loading nearby amenities…
Taxation est. · year 1
- Rental income
- $11,636
- − Mortgage interest
- −$4,756
- − Property taxes
- −$243
- − Insurance
- −$424
- − Repairs & maintenance
- −$931
- − Management
- −$931
- − Depreciation
- −$2,470
- Taxable income
- $1,881
- Est. tax owed @ 24.0%
- −$451
- After-tax cash flow
- $2,731/yr
For passive investors: Depreciation is non-cash, so a rental often shows a tax loss while cash-flowing — sheltering income. Rental losses are passive: they offset passive income freely, and up to $25,000/yr can offset ordinary (W-2) income if you actively participate and your MAGI is under $100k (phasing out to $0 by $150k); unused losses carry forward. On sale, claimed depreciation is recaptured at up to 25%, and gains may owe capital-gains tax (a 1031 exchange can defer both). Figures are a year-1 estimate at your 24.0% rate — not tax advice; consult a CPA.
Schools (NCES district)
- District
- Letcher County
- NCES district ID
- 2103360
- Math proficiency
- 19% ▼ -25.00%
- Reading proficiency
- 38% ▼ -19.00%
- Median HH income
- $30,727
- Composite
- 23.04/100
- National rank
- #7972
- State rank
- #127 of 165 in KY
Livability — Millstone
- Score
- 44/100
- State rank
- #523
- US rank
- #26777
Category grades
Schools grade is shown separately in the Schools card above.
Census & demographics
- Population (ZIP)
- 751
Population outlook (Letcher County) Hauer SSP2
- Today (2025)
- 19,961 people
- By 2030
- 18,236 · -8.6%
- By 2040
- 14,928 · -25.2%
- By 2050
- 12,156 · -39.1%
- By 2075
- 7,638 · -61.7%
- By 2100
- 5,470 · -72.6%
Race, ethnicity, and origin ACS 2023
- Neighborhood character
- Predominantly White (98%)
- Race & ethnicity
- White 98% Two or more races 2%
- Common ancestry
- Lithuanian 3% Serbian 1%
Political lean MEDSL · Letcher
- 2024 margin
- Solid R (+64.0) · D 17.3% · R 81.2% · Other 1.5%
- 2008→2024 swing
- -30.6pp toward R · 2008: -33.3pp · 2024: -64.0pp
- All cycles
- 2024: R+64.0 2020: R+59.4 2016: R+63.0 2012: R+58.3 2008: R+33.3
Not yet ingested
- Civics
- —
Market trends
- HPI YoY
- ▼ -4.62%
- Current HPI
- 137.1924
- Rent YoY
- —
- Metro
- —
- State GDP YoY
- ▲ 1.81%
- F500 in state
- 4
Industry mix (Fortune 500 HQ in KY)
| Industry | F500 HQs | Revenue |
|---|---|---|
| Healthcare | 1 | $118B |
|
||
| Food / Beverage | 1 | $7B |
|
||
Price history
1 event — show timeline
- 2026-06-05 Listed $94,900 EKAR
Property tax history
+5.8%/yrLatest (2019): $243 · +4.2% YoY. Source: county tax records.
Cash-flow waterfall
monthlySold comps — $/sqft
last 12 mo · ≤1 miLoading sold comps…