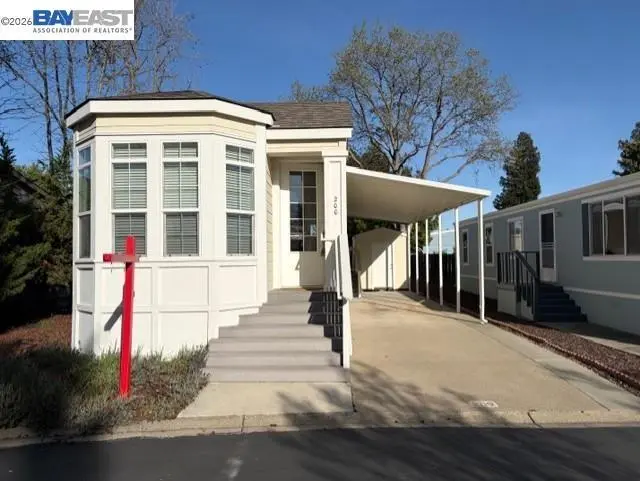
3263 Vineyard Ave #200 · Pleasanton, CA
Flood risk 1/10 · Minimal
- FEMA flood zone
- X (unshaded)
- Chance of flooding over 30 yrs
- 0.0%
- Est. flood insurance / yr
- $507 – $1,088
Fire risk 6/10 · Moderate
- Est. fire insurance / yr
- $659 – $1,223
Heat risk 4/10 · Minor
- Hot days now (above 97°F)
- 7 days/yr
- Hot days in 30 yrs
- 14 days/yr
Wind risk 1/10 · Minimal
- Chance of severe wind over 30 yrs
- —
Air-quality risk 9/10 · Severe
- Unhealthy air days now
- 19 days/yr
- Unhealthy air days in 30 yrs
- 21 days/yr
Risk factors via First Street. Map © Google.
Why this score? — see what drove the B+ grade
The composite is a weighted blend of 9 inputs, each scored 0–100. Each bar is that input's sub-score; the figure is the points it added to the 100-point composite (weight × sub-score).
- Cash flow +30.0/30.0
- 1% rule +10.0/10.0
- DSCR +10.0/10.0
- ARV discount +7.5/15.0
- Schools +7.3/10.0
- Livability +4.2/5.0
- Rent growth +4.0/5.0
- Condition / age +2.5/5.0
- Appreciation +0.0/10.0
$194,900
🖨 Deal sheet (PDF) 📄 Offer letter ✓ Due diligence
Listing remarks MLS
Adorable singlewide available in Pleasanton's Vineyard Estates (55+ community). This home has 2 opposite end bedrooms; kitchen with solid surface countertops and black finish appliances; LTV flooring; laundry closet with stackable washer & dryer; large shed; long driveway; great location overlooking creek; energy star certified & more. Ready for move in.
Key facts
- Ltv flooring
- Laundry closet
- Long driveway
Tags
Neighborhood map
What this means for you Summary
Snapshot
- This is a 2-bed/2.0-bath manufactured listed at $195k.
Deal economics
- At list price, monthly cash flow is $1k ($15k/yr) — positive.
- The deal already cash-flows at list — no discount required.
- Meets the 1% rule at list price ($3k rent vs $195k).
- Recommended offer: $177k (9.0% below list) — sets the bar for market timing.
- Cap rate 14.0% vs local median 1.3% in Pleasanton — top-decile yield for the area; either an underpriced asset or a hidden risk that comps aren't pricing in. Stress-test before assuming the spread holds.
Location & tenants
- Location reads 84/100 on livability (#17 in CA, #655 nationally) — a professional / high-income tenant draw. Strengths: amenities A+, commute A+, employment A+; Watch: cost of living F.
- Pleasanton Unified (urban): math 75% / reading 79% proficiency, ranked #43 of 1,400 in CA (top 3%) — strong family-tenant draw, lease renewals of 3-5y typical; only 6% free/reduced lunch — higher-income household profile.
- Zoned schools: Vintage Hills Elementary (538 students, 5% FRL); Pleasanton Middle (1,050 students, 12% FRL); Amador Valley High (2,665 students, 7% FRL) — zoned schools at 8% FRL track the district average.
- Market conditions: Rents rising fast (+6.0%/yr); 159 active listings in the ZIP; 7 comparable units currently listed for rent nearby; rentals at typical pace (median 18d on market — plan ~3-4 weeks tenant-placement turnaround); high-income renter base; 1,742 units permitted in Alameda County in 2024 (856 in 5+ unit buildings).
Forward outlook
- Local home prices are declining (-3.0%/yr); year-one equity from $1k of loan paydown is wiped out by about $6k of value loss. Plan a longer hold.
- Alameda County population projected at +34% by 2050 — long-run rental-demand tailwind backs the buy-and-hold thesis.
- At projected returns (-3.0% appreciation + 6.0% rent growth), your $55k cash investment doubles in ~5 years — after that, you're playing with house money.
Negotiation context
- It's been on market 94 days — a 9% lower offer ($177k) is reasonable based on typical stale-listing flexibility.
Risks & watch-outs
- Climate carrying-cost: major wildfire risk — expect insurance premiums to compound above CPI over the hold.
Questions for the listing agent
- It's been on market 94 days. Have you received any prior offers? Is the seller open to a 9% concession, seller financing, or rate buy-down credit?
- Why hasn't it sold? Are there any deal-killer items the seller is aware of (foundation, flood, title, zoning, code violations)?
- Is there a deadline driving the sale (1031 exchange, divorce, estate, relocation)? That informs how much negotiation room exists.
- Schools are A-rated — typically a magnet for longer-tenancy family renters. What's the average tenant stay here, and is there a school-zone premium baked into asking?
- What's the average days-on-market for RENTAL listings here right now (not sales)? A rising rental-DOM trend means longer vacancies and softer asking-rent achievability than the comps imply.
- What's the recent tenant-quality profile in this submarket — average credit score on applications, eviction rate, late-payment / NSF rate, and stable-employment percentage? A property-management company in the area should have these aggregated.
- How much new for-sale + rental construction is in the pipeline within 1–3 miles? Heavy new supply typically softens prices + rents 12–24 months out; constrained supply supports both.
Investment metrics
- 1% rule
- 1.59% ✓
- Cap rate
- 14.00%
- Cash-on-cash
- 27.52%
- DSCR
- 2.22
- GRM
- 5.2
CMA / ARV
- ARV (median comp)
- $105,500
- List price
- $194,900
- Delta
- 84.74%
- Verdict
- OVERPRICED
- Comps
- 2 within 1.0 mi
Show comp detail 2 sales within ~0.75 mi
| Address | Dist | Beds/Ba | Sqft | Sold | Price | $/sf | Match |
|---|---|---|---|---|---|---|---|
| 3231 Vineyard Ave #126 | 0.15mi | 2/2.0 | 880 (-2%) | 5mo | $52,000 | $59 | 85 |
| 3231 Vineyard Ave., #83 #83 | 0.23mi | 2/2.0 | 960 (+7%) | 24mo | $88,000 | $92 | 58 |
Match score weights: distance 35% · size 25% · config 20% · recency 20%. Top-matched comps best support the ARV.
Projected returns pro-forma
-3.0% appreciation · 6.04% rent growth · sell at horizon
- IRR
- 24.8%
- Equity multiple
- 2.06×
- Total profit
- $57,822
- Equity at exit
- $29,060
- IRR
- 34.3%
- Equity multiple
- 4.58×
- Total profit
- $195,375
- Equity at exit
- $16,851
Cash invested: $54,572 (down + closing). Projections, not guarantees.
Landlord ↔ Tenant lean methodology
- Overall (STATE)
- 18 Strongly Tenant-Friendly
- State California
- 18 Strongly Tenant-Friendly · D+13
- County
- — inherits STATE
- City
- — inherits STATE
ZIP-level market 94566
- Rents YoY
- 6.0%
- Active inventory
- 159
- Price-to-rent
- 5.2×
Monthly cashflow live
- Estimated rent
- $3,094 high interval (Pro) →
- Mortgage (P&I)
- −$1,022
- Tax from tax record
- −$89 /mo · $1,072/yr
- Insurance
- −$81
- HOA
- −$0
- Vacancy / Maint / Mgmt
- −$650
- Net cashflow
- $1,251
Break-even live
Sensitivity live
| Price | -10% $1,362 | -5% $1,307 | +0% $1,251 | +5% $1,196 | +10% $1,141 |
|---|---|---|---|---|---|
| Rent | -10% $1,007 | -5% $1,129 | +0% $1,251 | +5% $1,374 | +10% $1,496 |
| Rate | -1.0pp $1,350 | -0.5pp $1,301 | base $1,251 | +0.5pp $1,201 | +1.0pp $1,150 |
UW: 25.0% down · 7.5% · 30yr · 1.5% tax · 5.0% vac · 8.0% maint · 8.0% mgmt
Financing live
Cash to close
- Down payment
- $48,725
- Closing costs
- $5,847
- Reserves months
- —
- Total cash needed
- —
Loan-product check · same deal, 3 products live
Conventional
25% down · 7.5% · 30yr
- Down + closing
- —
- Monthly P&I
- —
- Monthly cashflow
- —
- DSCR
- —
- Eligible?
- —
Personal DTI + credit; lowest rate.
DSCR
20% down · 8.5% · 30yr
- Down + closing
- —
- Monthly P&I
- —
- Monthly cashflow
- —
- DSCR
- —
- Eligible?
- —
No personal income docs; deal must DSCR.
Hard money
10% down · 12.0% · 12mo
- Down + closing
- —
- Monthly P&I
- —
- Monthly cashflow
- —
- DSCR
- —
- Eligible?
- —
Short-term bridge; refi at stabilization.
Rent comps 7 comps
| Address | Beds | Baths | Sqft | Rent | $/sqft | DOM | Units | Dist |
|---|---|---|---|---|---|---|---|---|
| 3819 Vineyard Ave Pleasanton, CA | 1.0–3.0 | 1.0–1.5 | 863 | $2,940 | $3.40 | 0d | 14 | 0.71mi |
| 835 Palomino Dr Unit 2 Pleasanton, CA | 2.0 | 1.5 | 1080 | $2,850 | $2.64 | 22d | 1 | 0.72mi |
| 3849 Vineyard Ave Unit B Pleasanton, CA | 1.0 | 1.0 | 611 | $2,500 | $4.09 | 45d | 1 | 0.75mi |
| 3847 Vineyard Ave Pleasanton, CA | 2.0 | 2.0 | 900 | $2,700 | $3.00 | 18d | 1 | 0.75mi |
| 3851 Vineyard Ave Unit D Pleasanton, CA | 1.0 | 1.0 | 600 | $1,995 | $3.33 | 45d | 1 | 0.77mi |
| 3955 Vineyard Ave Pleasanton, CA | 1.0–2.0 | 1.0–2.0 | 829 | $5,000 | $6.03 | 0d | 5 | 0.85mi |
| 4320 Valley Ave Pleasanton, CA | 2.0 | 2.0 | 1073 | $3,474 | $3.24 | 4d | 2 | 1.41mi |
Listing history 16 events
-
2026-06-21days on market $194,900 Active 94 DOM
-
2026-06-18days on market $194,900 Active 91 DOM
-
2026-06-17days on market $194,900 Active 90 DOM
-
2026-06-16days on market $194,900 Active 89 DOM
-
2026-06-15days on market $194,900 Active 88 DOM
-
2026-06-13days on market $194,900 Active 86 DOM
-
2026-06-13days on market $194,900 Active 85 DOM
-
2026-06-09days on market $194,900 Active 82 DOM
-
2026-06-08days on market $194,900 Active 81 DOM
-
2026-06-07pricedays on market $194,900 Active 80 DOM
-
2026-06-04days on market $199,900 Active 77 DOM
-
2026-06-03days on market $199,900 Active 76 DOM
-
2026-06-02days on market $199,900 Active 75 DOM
-
2026-06-01days on market $199,900 Active 74 DOM
-
2026-05-31days on market $199,900 Active 73 DOM
-
2026-03-19$199,900 Active 365-char remark
Show marketing remark (365 chars)
Adorable singlewide available in Pleasanton's Vineyard Estates (55+ community). This home has 2 opposite end bedrooms; kitchen with solid surface countertops and black finish appliances; LTV flooring; laundry closet with stackable washer & dryer; large shed; long driveway; great location overlooking creek; energy star certified & more. Ready for move in.
ⓘ Source: listings_history table (triggers on properties + properties_extension) + one-shot
backfill from property_details.listing_events for pre-trigger history.
Tax reassessment forecast CA · Resets to sale price
- Current annual tax
- $1,072 · $89/mo
- Projected year-2 tax
- $1,481 · $123/mo
- Expected delta
- +$409/yr (+$34/mo · 38.2%)
ⓘ Screening estimate from a state-policy table — verify with the county assessor before closing.
Climate risk First Street
- Flood 1/10 Low FEMA zone X (unshaded) · 0% chance over 30 yrs
- Wildfire 6/10 Major
- Heat 4/10 Moderate 7 d/yr ≥97°F today · 14 d/yr by 30 yrs out
- Wind 1/10 Low
- Air quality 9/10 Extreme 19 unhealthy d/yr today · 21 by 30 yrs out
Nearby sold comps map
Loading sold comps map…
Walkable amenities ~0.75 mi
Loading nearby amenities…
Taxation est. · year 1
- Rental income
- $37,124
- − Mortgage interest
- −$10,917
- − Property taxes
- −$1,072
- − Insurance
- −$974
- − Repairs & maintenance
- −$2,970
- − Management
- −$2,970
- − Depreciation
- −$5,670
- Taxable income
- $12,551
- Est. tax owed @ 24.0%
- −$3,012
- After-tax cash flow
- $12,005/yr
For passive investors: Depreciation is non-cash, so a rental often shows a tax loss while cash-flowing — sheltering income. Rental losses are passive: they offset passive income freely, and up to $25,000/yr can offset ordinary (W-2) income if you actively participate and your MAGI is under $100k (phasing out to $0 by $150k); unused losses carry forward. On sale, claimed depreciation is recaptured at up to 25%, and gains may owe capital-gains tax (a 1031 exchange can defer both). Figures are a year-1 estimate at your 24.0% rate — not tax advice; consult a CPA.
Schools (NCES district)
- District
- Pleasanton Unified
- NCES district ID
- 0600020
- Math proficiency
- 75% ▼ -1.00%
- Reading proficiency
- 79% ▼ -1.00%
- Median HH income
- $123,770
- Composite
- 73.12/100
- National rank
- #351
- State rank
- #43 of 1400 in CA
Livability — Pleasanton
- Score
- 84/100
- State rank
- #17
- US rank
- #655
Category grades
Schools grade is shown separately in the Schools card above.
Census & demographics
- Census place
- Pleasanton, CA
- County
- Alameda County · 1,614,355 people
- City population
- 78,550
- Metro
- San Francisco-Oakland-Berkeley, CA
- Population (ZIP)
- 44,222
- Household income
- $191,155
- Rent vs Own
- Severe rent burden
- 1190.0
Population outlook (Alameda County) Hauer SSP2
- Today (2025)
- 1,928,884 people
- By 2030
- 2,069,146 · +7.3%
- By 2040
- 2,338,405 · +21.2%
- By 2050
- 2,586,608 · +34.1%
- By 2075
- 3,061,911 · +58.7%
- By 2100
- 3,234,133 · +67.7%
Race, ethnicity, and origin ACS 2023
- Neighborhood character
- Diverse neighborhood (Simpson 0.66)
- Race & ethnicity
- White 42% Asian 38% Hispanic / Latino 13% Two or more races 10%
- Hispanic origin (detail)
- Mexican 9%
- Common ancestry
- Italian 3% Russian 3% Romanian 2%
- Foreign-born
- 33% · China, Canada, South Korea
- Languages at home
- 59% English-only · Other Indo-European 10% Chinese 10% Spanish 8%
Political lean MEDSL · Alameda
- 2024 margin
- Solid D (+53.6) · D 74.6% · R 21.0% · Other 4.4%
- 2008→2024 swing
- -5.9pp toward R · 2008: 59.5pp · 2024: 53.6pp
- All cycles
- 2024: D+53.6 2020: D+62.5 2016: D+64.4 2012: D+59.8 2008: D+59.5
Not yet ingested
- Civics
- —
Market trends
- HPI YoY
- ▼ -841.68%
- Current HPI
- 308.8324
- Rent YoY
- ▲ 6.04%
- Metro
- San Francisco-Oakland-Berkeley, CA
- State GDP YoY
- ▲ 3.21%
- F500 in state
- 116
Industry mix (Fortune 500 HQ in CA)
| Industry | F500 HQs | Revenue |
|---|---|---|
| Technology | 27 | $1,492B |
|
||
| Financial Services | 3 | $174B |
|
||
| Retail | 3 | $44B |
|
||
| Insurance | 3 | $26B |
|
||
| Media / Entertainment | 2 | $115B |
|
||
| Pharmaceuticals / Biotech | 2 | $62B |
|
||
Price history
1 event — show timeline
- 2026-03-19 Listed $199,900 bridgeMLS, Bay East AOR, or Contra Costa AOR
Property tax history
+1.6%/yrLatest (2025): $1,072 · -0.4% YoY. Source: county tax records.
Cash-flow waterfall
monthlySold comps — $/sqft
last 12 mo · ≤1 miLoading sold comps…