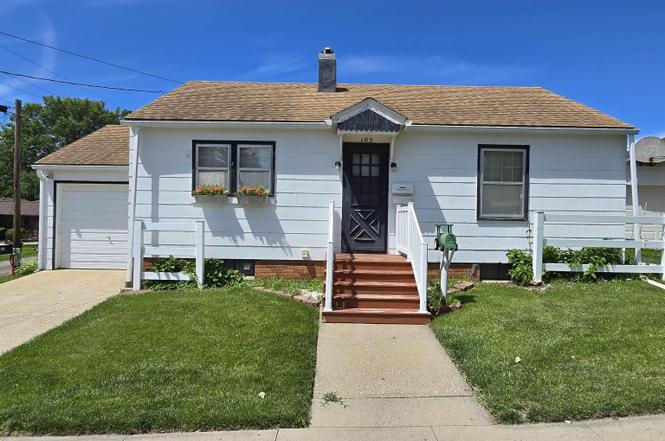
105 E Howard St · Creston, IA
Flood risk 1/10 · Minimal
- FEMA flood zone
- X (unshaded)
- Chance of flooding over 30 yrs
- 0.0%
- Est. flood insurance / yr
- $473 – $860
Fire risk 3/10 · Minor
- Est. fire insurance / yr
- $902 – $1,676
Heat risk 3/10 · Minor
- Hot days now (above 103°F)
- 7 days/yr
- Hot days in 30 yrs
- 15 days/yr
Wind risk 2/10 · Minimal
- Chance of severe wind over 30 yrs
- —
Air-quality risk 2/10 · Minimal
- Unhealthy air days now
- 0 days/yr
- Unhealthy air days in 30 yrs
- 1 days/yr
Risk factors via First Street. Map © Google.
Why this score? — see what drove the C grade
The composite is a weighted blend of 9 inputs, each scored 0–100. Each bar is that input's sub-score; the figure is the points it added to the 100-point composite (weight × sub-score).
- Cash flow +24.0/30.0
- DSCR +7.7/10.0
- ARV discount +7.5/15.0
- 1% rule +5.8/10.0
- Schools +5.5/10.0
- Livability +4.0/5.0
- Rent growth +2.5/5.0
- Condition / age +2.5/5.0
- Appreciation +0.0/10.0
$82,500
🖨 Deal sheet (PDF) 📄 Offer letter ✓ Due diligence
Listing remarks
Conveniently located close to downtown Creston, this well-maintained 2-bedroom, 1-bath ranch home offers comfortable living with plenty of potential. Features include an oak kitchen with ample cabinet space, a full basement providing excellent storage, and an attached one-car garage for added convenience. Whether you're a first-time buyer, looking to downsize, or seeking an investment opportunity, this home offers a great location and practical layout. Don't miss your chance to make it yours!
Key facts
- Oak kitchen
- Attached garage
- Great location
Tags
Property features AI
Exterior
- Parking: Attached 1-car garage
- Utilities: Public water; Public sewer; Electric service with circuit breakers
- Home design: Single-family residential property
- Construction: Other construction materials
- Exterior features: Shingle roof; Public maintained road access; City street frontage; Lot roughly 0.08 acres (60 x 60)
Interior
- Flooring: Carpet; Linoleum
- Bathrooms: 1 full bathroom
- Heating & cooling: Central air conditioning; Forced air heating
- Interior features: Blinds; Window screens; Basement
Neighborhood map
What this means for you Summary
Snapshot
- This is a 2-bed/1.0-bath single-family listed at $82k.
Deal economics
- At list price, monthly cash flow is $161 ($2k/yr) — positive.
- The deal already cash-flows at list — no discount required.
- Meets the 1% rule at list price ($894 rent vs $82k).
- Cap rate 8.6% vs local median 4.6% in Creston — top-decile yield for the area; either an underpriced asset or a hidden risk that comps aren't pricing in. Stress-test before assuming the spread holds.
Location & tenants
- Location reads 81/100 on livability (#76 in IA, #1,607 nationally) — a professional / high-income tenant draw. Strengths: cost of living A+, housing A+, health & safety A+; Watch: employment C-, amenities F.
- Creston Community School District (town): math 63% / reading 69% proficiency, ranked #195 of 289 in IA (top 68%) — acceptable for families but not a draw, mixed tenant base, ~2y average lease.
- Zoned schools: Creston Elementary School (math 60% / reading 49%, grade C, #462 of 616 statewide, top 79%, 410 students, 55% FRL); Creston Middle School (math 65% / reading 74%, grade A, #113 of 246 statewide, top 49%, 291 students, 60% FRL); Creston High School (math 63% / reading 78%, grade B+, #140 of 336 statewide, top 43%, 532 students, 46% FRL).
- Market conditions: 78 active listings in the ZIP; 5 units permitted in Union County in 2024 (0 in 5+ unit buildings).
Forward outlook
- Local home prices are declining (-3.0%/yr); year-one equity from $570 of loan paydown is wiped out by about $2k of value loss. Plan a longer hold.
Negotiation context
- Only 6 days on market — expect competitive offers; lowballing is unlikely to land.
Risks & watch-outs
- Watch-outs: built in 1949 — expect roof / HVAC / electrical / plumbing capex.
Questions for the listing agent
- Built in 1949 — when were the roof, HVAC, electrical panel, plumbing, and water heater last replaced?
- Is there a deadline driving the sale (1031 exchange, divorce, estate, relocation)? That informs how much negotiation room exists.
- Schools are B-rated — typically a magnet for longer-tenancy family renters. What's the average tenant stay here, and is there a school-zone premium baked into asking?
- What's the average days-on-market for RENTAL listings here right now (not sales)? A rising rental-DOM trend means longer vacancies and softer asking-rent achievability than the comps imply.
- What's the recent tenant-quality profile in this submarket — average credit score on applications, eviction rate, late-payment / NSF rate, and stable-employment percentage? A property-management company in the area should have these aggregated.
- How much new for-sale + rental construction is in the pipeline within 1–3 miles? Heavy new supply typically softens prices + rents 12–24 months out; constrained supply supports both.
Investment metrics
- 1% rule
- 1.08% ✓
- Cap rate
- 8.63%
- Cash-on-cash
- 8.36%
- DSCR
- 1.37
- GRM
- 7.7
CMA / ARV
- ARV (on-the-fly)
- $49,920
- Comps found
- 12
Show comp detail 12 sales within ~0.75 mi
| Address | Dist | Beds/Ba | Sqft | Sold | Price | $/sf | Match |
|---|---|---|---|---|---|---|---|
| 509 N Elm St | 0.20mi | 2/1.0 | 762 (-1%) | 15mo | $35,000 | $46 | 77 |
| 713 N Elm St | 0.33mi | 2/1.0 | 768 (0%) | 11mo | $50,000 | $65 | 76 |
| 307 N Birch St | 0.12mi | 2/1.0 | 688 (-10%) | 3mo | $65,950 | $96 | 75 |
| 304 N Birch St | 0.10mi | 2/1.0 | 880 (+15%) | 2mo | $20,000 | $23 | 69 |
| 405 S Vine St | 0.56mi | 2/1.0 | 826 (+8%) | 3mo | $86,000 | $104 | 59 |
| 409 S Vine St | 0.58mi | 2/1.0 | 812 (+6%) | 9mo | $53,000 | $65 | 56 |
| 408 S Elm St | 0.59mi | 2/1.0 | 852 (+11%) | 2mo | $68,000 | $80 | 52 |
| 711 N Elm St | 0.32mi | 2/1.0 | 882 (+15%) | 11mo | $48,000 | $54 | 52 |
| 903 W Montgomery St | 0.67mi | 2/1.0 | 824 (+7%) | 11mo | $18,500 | $22 | 48 |
| 800 N Sycamore St | 0.47mi | 2/1.5 | 864 (+12%) | 9mo | $35,000 | $41 | 47 |
| 901 W Adair St | 0.67mi | 3/1.0 (+1) | 864 (+12%) | 2mo | $30,000 | $35 | 41 |
| 103 S Spruce St | 0.55mi | 2/1.0 | 880 (+15%) | 12mo | $115,000 | $131 | 40 |
Match score weights: distance 35% · size 25% · config 20% · recency 20%. Top-matched comps best support the ARV.
Projected returns pro-forma
-3.0% appreciation · 3.0% rent growth · sell at horizon
- IRR
- -3.6%
- Equity multiple
- 0.87×
- Total profit
- $-3,117
- Equity at exit
- $12,301
- IRR
- 6.1%
- Equity multiple
- 1.45×
- Total profit
- $10,482
- Equity at exit
- $7,133
Cash invested: $23,100 (down + closing). Projections, not guarantees.
Landlord ↔ Tenant lean methodology
- Overall (STATE)
- 83 Strongly Landlord-Friendly
- State Iowa
- 83 Strongly Landlord-Friendly · R+6
- County
- — inherits STATE
- City
- — inherits STATE
ZIP-level market 50801
- Home prices YoY
- -5.9%
- Active inventory
- 78
- Price-to-rent
- 7.7×
Monthly cashflow live
- Estimated rent
- $894 medium interval (Pro) →
- Mortgage (P&I)
- −$433
- Tax from tax record
- −$78 /mo · $942/yr
- Insurance
- −$34
- HOA
- −$0
- Lot rent
- −$0
- Vacancy / Maint / Mgmt
- −$188
- Net cashflow
- $161
Break-even live
Sensitivity live
| Price | -10% $208 | -5% $184 | +0% $161 | +5% $138 | +10% $114 |
|---|---|---|---|---|---|
| Rent | -10% $90 | -5% $126 | +0% $161 | +5% $196 | +10% $232 |
| Rate | -1.0pp $203 | -0.5pp $182 | base $161 | +0.5pp $140 | +1.0pp $118 |
UW: 25.0% down · 7.5% · 30yr · 1.5% tax · 5.0% vac · 8.0% maint · 8.0% mgmt
Financing live
Cash to close
- Down payment
- $20,625
- Closing costs
- $2,475
- Reserves months
- —
- Total cash needed
- —
Loan-product check · same deal, 3 products live
Conventional
25% down · 7.5% · 30yr
- Down + closing
- —
- Monthly P&I
- —
- Monthly cashflow
- —
- DSCR
- —
- Eligible?
- —
Personal DTI + credit; lowest rate.
DSCR
20% down · 8.5% · 30yr
- Down + closing
- —
- Monthly P&I
- —
- Monthly cashflow
- —
- DSCR
- —
- Eligible?
- —
No personal income docs; deal must DSCR.
Hard money
10% down · 12.0% · 12mo
- Down + closing
- —
- Monthly P&I
- —
- Monthly cashflow
- —
- DSCR
- —
- Eligible?
- —
Short-term bridge; refi at stabilization.
Listing history 6 events
-
2026-06-22days on market $82,500 Active 6 DOM
-
2026-06-21days on market $82,500 Active 5 DOM
-
2026-06-21days on market $82,500 Active 4 DOM
-
2026-06-18days on market $82,500 Active 2 DOM
-
2026-06-17remarks 497-char remark
-
2026-06-17$82,500 Active 1 DOM
ⓘ Source: listings_history table (triggers on properties + properties_extension) + one-shot
backfill from property_details.listing_events for pre-trigger history.
Tax reassessment forecast IA · Partial reset (capped growth)
- Current annual tax
- $942 · $78/mo
- Projected year-2 tax
- $1,119 · $93/mo
- Expected delta
- +$177/yr (+$15/mo · 18.8%)
ⓘ Screening estimate from a state-policy table — verify with the county assessor before closing.
Climate risk First Street
- Flood 1/10 Low FEMA zone X (unshaded) · 0% chance over 30 yrs
- Wildfire 3/10 Moderate
- Heat 3/10 Moderate 7 d/yr ≥103°F today · 15 d/yr by 30 yrs out
- Wind 2/10 Low
- Air quality 2/10 Low 0 unhealthy d/yr today · 1 by 30 yrs out
Nearby sold comps map
Loading sold comps map…
Walkable amenities ~0.75 mi
Loading nearby amenities…
Taxation est. · year 1
- Rental income
- $10,732
- − Mortgage interest
- −$4,621
- − Property taxes
- −$942
- − Insurance
- −$412
- − Repairs & maintenance
- −$859
- − Management
- −$859
- − Depreciation
- −$2,400
- Taxable income
- $639
- Est. tax owed @ 24.0%
- −$153
- After-tax cash flow
- $1,778/yr
For passive investors: Depreciation is non-cash, so a rental often shows a tax loss while cash-flowing — sheltering income. Rental losses are passive: they offset passive income freely, and up to $25,000/yr can offset ordinary (W-2) income if you actively participate and your MAGI is under $100k (phasing out to $0 by $150k); unused losses carry forward. On sale, claimed depreciation is recaptured at up to 25%, and gains may owe capital-gains tax (a 1031 exchange can defer both). Figures are a year-1 estimate at your 24.0% rate — not tax advice; consult a CPA.
Schools (NCES district)
- District
- Creston Community School District
- NCES district ID
- 1908310
- Math proficiency
- 63% ▬ 0.00%
- Reading proficiency
- 69% ▲ 4.00%
- Median HH income
- $42,292
- Composite
- 55.29/100
- National rank
- #1263
- State rank
- #195 of 289 in IA
Livability — Creston
- Score
- 81/100
- State rank
- #76
- US rank
- #1607
Category grades
Schools grade is shown separately in the Schools card above.
Census & demographics
- Census place
- Creston, IA
- Population (ZIP)
- 9,027
Population outlook (Union County) Hauer SSP2
- Today (2025)
- 12,536 people
- By 2030
- 12,561 · +0.2%
- By 2040
- 12,583 · +0.4%
- By 2050
- 12,543 · +0.1%
- By 2075
- 12,816 · +2.2%
- By 2100
- 12,754 · +1.7%
Race, ethnicity, and origin ACS 2023
- Neighborhood character
- Predominantly White (94%)
- Race & ethnicity
- White 94% Two or more races 3% Hispanic / Latino 2%
- Common ancestry
- Romanian 3% Slovak 2% Portuguese 2%
- Foreign-born
- 0%
- Languages at home
- 98% English-only · Spanish 1% German/W. Germanic 1%
Political lean MEDSL · Union
- 2024 margin
- Solid R (+36.2) · D 31.2% · R 67.4% · Other 1.3%
- 2008→2024 swing
- -39.9pp toward R · 2008: 3.7pp · 2024: -36.2pp
- All cycles
- 2024: R+36.2 2020: R+31.5 2016: R+27.8 2012: D+3.9 2008: D+3.7
Not yet ingested
- Civics
- —
Market trends
- HPI YoY
- ▼ -13.71%
- Current HPI
- 217.2057
- Rent YoY
- —
- Metro
- —
- State GDP YoY
- ▲ 2.48%
- F500 in state
- 4
Industry mix (Fortune 500 HQ in IA)
| Industry | F500 HQs | Revenue |
|---|---|---|
| Financial Services | 1 | $16B |
|
||
| Retail / Convenience | 1 | $15B |
|
||
Price history
1 event — show timeline
- 2026-06-16 Listed $82,500 IAR
Property tax history
+1.0%/yrLatest (2025): $942 · -13.1% YoY. Source: county tax records.
Cash-flow waterfall
monthlySold comps — $/sqft
last 12 mo · ≤1 miLoading sold comps…