 Duplex
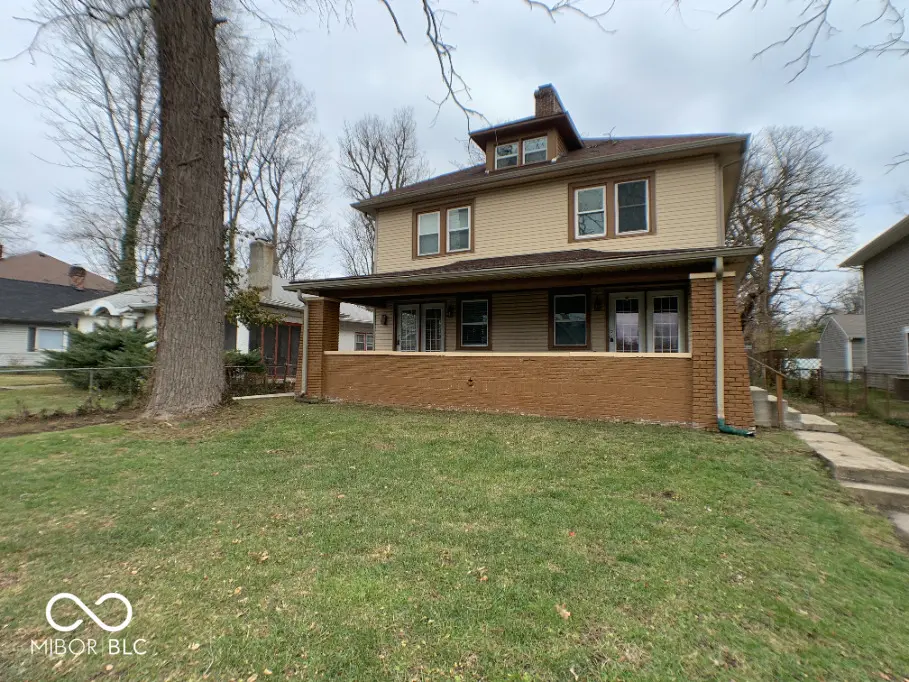
3329 Carrollton Ave · Indianapolis city (balance), IN
Flood risk 6/10 · Moderate
- FEMA flood zone
- X (unshaded)
- Chance of flooding over 30 yrs
- 0.75%
- Est. flood insurance / yr
- $473 – $860
Fire risk 1/10 · Minimal
- Est. fire insurance / yr
- $717 – $1,331
Heat risk 3/10 · Minor
- Hot days now (above 101°F)
- 7 days/yr
- Hot days in 30 yrs
- 19 days/yr
Wind risk 2/10 · Minimal
- Chance of severe wind over 30 yrs
- 0.0%
Air-quality risk 4/10 · Minor
- Unhealthy air days now
- 5 days/yr
- Unhealthy air days in 30 yrs
- 7 days/yr
Risk factors via First Street. Map © Google.
Why this score? — see what drove the D grade
The composite is a weighted blend of 9 inputs, each scored 0–100. Each bar is that input's sub-score; the figure is the points it added to the 100-point composite (weight × sub-score).
- ARV discount +15.0/15.0
- Cash flow +11.9/30.0
- Rent growth +4.1/5.0
- 1% rule +3.8/10.0
- DSCR +3.5/10.0
- Livability +2.5/5.0
- Condition / age +2.5/5.0
- Schools +1.4/10.0
- Appreciation +0.0/10.0
$315,000
🖨 Deal sheet (PDF) 📄 Offer letter ✓ Due diligence
Multi-family units
County records classify this as Multi-Family (2-4 Unit). Listing-text estimate: 2 units. confirmed
Listing remarks MLS
Location!Location!Location! Excellent Retal income opportunity! Side by Side duplex. You can live one side and rent the other.Roof windows wiring, plumbing,HVAC all 2013. New waterproofing system in the basement. Each side has 3 bedrooms 1 1/2bath plus basement. Front porch and Back deck on both side. right side is currently has tenant, You are welcome to check the left side of the Duplex.
Key facts
- Covered front porch
- Decorative fireplace
- Private rear deck
Tags
Property features AI
Finance
- Other: Each unit reports utilities including central air, electric fuel, and gas fuel; Sample monthly rents listed: Unit 1 $1,480; Unit 2 $1,400
- Financial info: Owner pays taxes; Gross income listed as 0; Expenses listed as 0; Property configured as 2 units with a total of 6 bedrooms and 14 rooms
Exterior
- Parking: On-street parking; Alley access; Other parking
- Security: Smoke detector(s)
- Utilities: Solid waste service not indicated
- Home design: Duplex (residential income property); Two stories
- Construction: Vinyl siding; Block foundation
- Exterior features: Sidewalks; Mature trees; Low-maintenance yard not indicated
Interior
- Kitchen: Each unit has a kitchen (listed size 12 x 15)
- Bedrooms: Two 3-bedroom units (each unit listed as 3 Bedroom)
- Heating & cooling: Forced air heating; Central air conditioning
- Interior features: Unfinished basement; Central air; Forced air heating; Smoke detectors
- Laundry & utility: Laundry in basement
Neighborhood map
What this means for you Summary
Snapshot
- This is a 2 × 3.0-bed/1.5-bath units multifamily listed at $315k.
Deal economics
- At list price, monthly cash flow is $-83 ($-993/yr) — negative. Per door: $-41/mo.
- To cash-flow at today's rent, offer at most $300k (4.6% below list).
- To meet the 1% rule (rent ≥ 1% of price), the offer needs to be $277k (12.0% below list).
- Recommended offer: $277k (12.0% below list) — sets the bar for 1% rule.
- Cap rate 6.0% vs local median 4.4% in Indianapolis city (balance) — top-decile yield for the area; either an underpriced asset or a hidden risk that comps aren't pricing in. Stress-test before assuming the spread holds.
Location & tenants
- Location reads: area grade D — affects rentability + tenant quality, not the cash-flow math above.
- Indianapolis Public Schools (urban): math 14% / reading 20% proficiency, ranked #286 of 301 in IN (top 95%) — low school quality limits family demand, transient renter base, plan for 1-2y turnover; 77% free/reduced lunch — lower-income household profile, screen leases tightly.
- Zoned schools: Center For Inquiry School 27 (math 25% / reading 29%, grade F, #737 of 994 statewide, top 76%, 525 students, 51% FRL); H L Harshman Middle School (math 3% / reading 16%, grade F, #316 of 330 statewide, top 96%, 549 students, 84% FRL); Arsenal Technical High School (math 6% / reading 27%, grade F, #353 of 369 statewide, top 96%, 2,366 students, 74% FRL).
- Market conditions: Rents rising fast (+6.2%/yr); 317 active listings in the ZIP; 40 comparable units currently listed for rent nearby; rentals at typical pace (median 26d on market — plan ~3-4 weeks tenant-placement turnaround); 1,906 units permitted in Marion County in 2024 (621 in 5+ unit buildings).
- At $2,772/mo this rent would consume 46% of the median local household income ($72k/yr) (locally 1149% of renters already pay >50% of income on rent) — very limited rent-growth headroom before tenants either downsize or default.
Forward outlook
- Local home prices are declining (-3.0%/yr); year-one equity from $2k of loan paydown is wiped out by about $9k of value loss. Plan a longer hold.
- Marion County population projected at +18% by 2050 — long-run rental-demand tailwind backs the buy-and-hold thesis.
Negotiation context
- It's been on market 29 days — a 2% lower offer ($310k) is reasonable based on typical stale-listing flexibility.
- 10 sale attempts since 21y ago with the ask held roughly flat each time — persistent listings suggest the price (not the market) is what's stuck; bring a comps-based counter.
- Current owner paid $215k; 47% above their basis — modest negotiation headroom, anchor on the comps not their cost.
Risks & watch-outs
- Watch-outs: built in 1923 — expect roof / HVAC / electrical / plumbing capex.
- Climate carrying-cost: major flood risk — expect insurance premiums to compound above CPI over the hold.
Questions for the listing agent
- What do current leases actually rent for vs. the listed asking? Can we see a recent rent roll and the last 12 months of T-12 income?
- Can we see the unit-by-unit rent roll, current vacancy, and any below-market leases? What's the average tenancy length?
- What capital expenditures (roof, boiler, parking lot, exteriors) have been made in the last 5 years, and what's planned in the next 2?
- Built in 1923 — when were the roof, HVAC, electrical panel, plumbing, and water heater last replaced?
- Is there a deadline driving the sale (1031 exchange, divorce, estate, relocation)? That informs how much negotiation room exists.
- The area grade is low — what's the realistic commute time and amenity access for the typical tenant pool here? Any planned neighborhood developments (good or bad) we should know about?
- What's the average days-on-market for RENTAL listings here right now (not sales)? A rising rental-DOM trend means longer vacancies and softer asking-rent achievability than the comps imply.
- What's the recent tenant-quality profile in this submarket — average credit score on applications, eviction rate, late-payment / NSF rate, and stable-employment percentage? A property-management company in the area should have these aggregated.
- How much new apartment / multifamily construction is in the pipeline within 1–3 miles? Heavy new supply (>2% of stock underway) typically softens rents 12–24 months out; light construction supports rent growth.
Investment metrics
- 1% rule
- 0.88% ✗
- Cap rate
- 5.98%
- Cash-on-cash
- -1.13%
- DSCR
- 0.95
- GRM
- 9.5
CMA / ARV
- ARV (median comp)
- $392,974
- List price
- $315,000
- Delta
- -19.84%
- Verdict
- UNDERPRICED
- Comps
- 10 within 1.0 mi
Projected returns pro-forma
-3.0% appreciation · 6.21% rent growth · sell at horizon
- IRR
- -14.4%
- Equity multiple
- 0.47×
- Total profit
- $-46,974
- Equity at exit
- $46,968
- IRR
- -1.0%
- Equity multiple
- 0.92×
- Total profit
- $-6,776
- Equity at exit
- $27,235
Cash invested: $88,200 (down + closing). Projections, not guarantees.
Landlord ↔ Tenant lean methodology
- Overall (STATE)
- 90 Strongly Landlord-Friendly
- State Indiana
- 90 Strongly Landlord-Friendly · R+11
- County
- — inherits STATE
- City
- — inherits STATE
ZIP-level market 46205
- Rents YoY
- 6.2%
- Active inventory
- 317
- Price-to-rent
- 18.9×
Monthly cashflow live
- Estimated rent
- $2,772 high interval (Pro) →
- Mortgage (P&I)
- −$1,652
- Tax from tax record
- −$490 /mo · $5,874/yr
- Insurance
- −$131
- HOA
- −$0
- Vacancy / Maint / Mgmt
- −$582
- Net cashflow
- $-83
Break-even live
Sensitivity live
| Price | -10% $96 | -5% $6 | +0% $-83 | +5% $-172 | +10% $-261 |
|---|---|---|---|---|---|
| Rent | -10% $-302 | -5% $-192 | +0% $-83 | +5% $27 | +10% $136 |
| Rate | -1.0pp $76 | -0.5pp $-3 | base $-83 | +0.5pp $-164 | +1.0pp $-247 |
2-unit breakdown (identical units grouped — click to expand)
| Units | Beds | Baths | Est. rent |
|---|---|---|---|
| 2× units | 3.0 | 1.5 | $2,772 |
| #1 | 3.0 | 1.5 | $1,386 |
| #2 | 3.0 | 1.5 | $1,386 |
| Total (2 units) | $2,772 | ||
UW: 25.0% down · 7.5% · 30yr · 1.5% tax · 5.0% vac · 8.0% maint · 8.0% mgmt
Financing live
Cash to close
- Down payment
- $78,750
- Closing costs
- $9,450
- Reserves months
- —
- Total cash needed
- —
Loan-product check · same deal, 3 products live
Conventional
25% down · 7.5% · 30yr
- Down + closing
- —
- Monthly P&I
- —
- Monthly cashflow
- —
- DSCR
- —
- Eligible?
- —
Personal DTI + credit; lowest rate.
DSCR
20% down · 8.5% · 30yr
- Down + closing
- —
- Monthly P&I
- —
- Monthly cashflow
- —
- DSCR
- —
- Eligible?
- —
No personal income docs; deal must DSCR.
Hard money
10% down · 12.0% · 12mo
- Down + closing
- —
- Monthly P&I
- —
- Monthly cashflow
- —
- DSCR
- —
- Eligible?
- —
Short-term bridge; refi at stabilization.
Rent comps 40 comps
| Address | Beds | Baths | Sqft | Rent | $/sqft | DOM | Units | Dist |
|---|---|---|---|---|---|---|---|---|
| 728 E 34th St Indianapolis, IN | 3.0 | 1.0 | 1491 | $1,400 | $0.94 | 6d | 1 | 0.07mi |
| 728 E 34th St Indianapolis, IN | 3.0 | 1.0 | 1491 | $1,400 | $0.94 | 21d | 1 | 0.07mi |
| 3359 N College Ave Indianapolis, IN | 2.0 | 1.5 | 1450 | $1,795 | $1.24 | 12d | 1 | 0.09mi |
| 3359 N College Ave Unit 3359 Indianapolis, IN | 2.0 | 1.5 | 1082 | $1,895 | $1.75 | 25d | 1 | 0.09mi |
| 3370 N College Ave Indianapolis, IN | 3.0 | 1.0 | 1680 | $1,275 | $0.76 | 4d | 1 | 0.13mi |
| 3365 Broadway St Indianapolis, IN | 3.0 | 2.0 | 1300 | $1,700 | $1.31 | 45d | 1 | 0.15mi |
| 3509 Guilford Ave Indianapolis, IN | 3.0 | 1.5 | 1351 | $1,445 | $1.07 | 16d | 1 | 0.21mi |
| 3530 Guilford Ave Indianapolis, IN | 3.0 | 2.0 | 1426 | $1,500 | $1.05 | 0d | 1 | 0.23mi |
| 3476 Birchwood Ave Indianapolis, IN | 3.0 | 1.5 | 1420 | $1,625 | $1.14 | 25d | 1 | 0.27mi |
| 3203 Sutherland Ave Unit 1310761P Indianapolis, IN | 2.0 | 1.0 | 1097 | $3,668 | $3.34 | 4d | 1 | 0.28mi |
| 3544 N College Ave Unit 2 Cozy Suite Indianapolis, IN | 3.0 | 2.0 | 1540 | $1,300 | $0.84 | 0d | 1 | 0.28mi |
| 3208 Guilford Ave Indianapolis, IN | 3.0 | 3.0 | 1800 | $1,700 | $0.94 | 14d | 1 | 0.30mi |
| 3141 N Park Ave Indianapolis, IN | 3.0 | 1.0 | 1390 | $1,000 | $0.72 | 45d | 1 | 0.33mi |
| 514 E 33rd St Indianapolis, IN | 3.0 | 1.0 | 1208 | $1,200 | $0.99 | 25d | 1 | 0.33mi |
| 3139 Guilford Ave Indianapolis, IN | 3.0 | 1.0 | 1068 | $1,345 | $1.26 | 45d | 1 | 0.33mi |
| 512 E 33rd St Indianapolis, IN | 3.0 | 1.0 | 1208 | $1,200 | $0.99 | 25d | 1 | 0.34mi |
| 3106 N College Ave Indianapolis, IN | 3.0 | 1.5 | 1400 | $1,700 | $1.21 | 9d | 1 | 0.34mi |
| 3541 Birchwood Ave Indianapolis, IN | 3.0 | 1.0 | 1400 | $1,549 | $1.11 | 14d | 1 | 0.36mi |
| 3110 Guilford Ave Indianapolis, IN | 3.0 | 1.5 | 1250 | $1,295 | $1.04 | 25d | 1 | 0.36mi |
| 3132 Dr Andrew J Brown Ave Indianapolis, IN | 2.0 | 1.0–2.0 | 791 | $2,120 | $2.68 | 3d | 46 | 0.44mi |
| 3558 Central Ave Indianapolis, IN | 3.0 | 1.0 | 1215 | $2,100 | $1.73 | 25d | 1 | 0.46mi |
| 3716 N College Ave Unit 3 Indianapolis, IN | 2.0 | 2.0 | 1100 | $1,450 | $1.32 | 45d | 1 | 0.49mi |
| 2950 Winthrop Ave Indianapolis, IN | 3.0 | 2.0 | 1224 | $1,449 | $1.18 | 45d | 1 | 0.50mi |
| 2960 N Park Ave Indianapolis, IN | 3.0 | 1.5 | 1400 | $1,550 | $1.11 | 0d | 1 | 0.52mi |
| 2960 N Park Ave Indianapolis, IN | 3.0 | 2.0 | 1400 | $1,595 | $1.14 | 45d | 1 | 0.52mi |
| 2960 N Park Ave Indianapolis, IN | 3.0 | 1.5 | 1400 | $1,550 | $1.11 | 25d | 1 | 0.52mi |
| 2958 N Park Ave Unit 2958 Indianapolis, IN | 3.0 | 1.5 | 1350 | $1,450 | $1.07 | 4d | 1 | 0.53mi |
| 321 E 31st St Indianapolis, IN | 3.0 | 1.0 | 1390 | $1,400 | $1.01 | 45d | 1 | 0.57mi |
| 3554 Washington Blvd Indianapolis, IN | 1.0 | 1.0 | 1714 | $750 | $0.44 | 25d | 1 | 0.57mi |
| 2950 Ruckle St Indianapolis, IN | 3.0 | 1.0 | 1450 | $1,300 | $0.90 | 45d | 1 | 0.57mi |
| 2920 Ruckle St Indianapolis, IN | 3.0 | 1.5 | 1272 | $1,700 | $1.34 | 0d | 1 | 0.63mi |
| 2920 Ruckle St Indianapolis, IN | 3.0 | 1.5 | 1272 | $1,700 | $1.34 | 9d | 1 | 0.63mi |
| 3851 Broadway St Indianapolis, IN | 3.0 | 1.0 | 1513 | $1,950 | $1.29 | 19d | 1 | 0.66mi |
| 2830 N Park Ave Indianapolis, IN | 2.0 | 3.0 | 1500 | $1,600 | $1.07 | 45d | 1 | 0.66mi |
| 2751 Guilford Ave Unit A Indianapolis, IN | 3.0 | 2.0 | 1250 | $1,750 | $1.40 | 0d | 1 | 0.69mi |
| 2751 Guilford Ave Unit Aunit Indianapolis, IN | 3.0 | 2.0 | 1250 | $1,750 | $1.40 | 45d | 1 | 0.69mi |
| 2751 Guilford Ave Unit B Indianapolis, IN | 3.0 | 2.0 | 1250 | $1,750 | $1.40 | 15d | 1 | 0.69mi |
| 3004 N Delaware St Indianapolis, IN | 3.0 | 1.5 | 1600 | $1,549 | $0.97 | 0d | 1 | 0.72mi |
| 2955 N Delaware St Indianapolis, IN | 3.0 | 1.5 | 1400 | $1,600 | $1.14 | 45d | 1 | 0.73mi |
| 1902 E 35th St Indianapolis, IN | 3.0 | 1.0 | 1100 | $1,600 | $1.45 | 45d | 1 | 0.75mi |
Listing history 30 events
-
2026-06-10status $315,000 Pending 29 DOM
-
2026-06-09days on market $315,000 Active 29 DOM
-
2026-06-08days on market $315,000 Active 28 DOM
-
2026-06-07pricedays on market $315,000 Active 27 DOM
-
2026-06-03days on market $325,000 Active 23 DOM
-
2026-06-02days on market $325,000 Active 22 DOM
-
2026-06-01days on market $325,000 Active 21 DOM
-
2026-05-31days on market $325,000 Active 20 DOM
-
2026-05-04$325,000 Active 1355-char remark
-
2020-10-19soldstatus $215,000 Sold 392-char remark
Show marketing remark (392 chars)
Location!Location!Location! Excellent Retal income opportunity! Side by Side duplex. You can live one side and rent the other.Roof windows wiring, plumbing,HVAC all 2013. New waterproofing system in the basement. Each side has 3 bedrooms 1 1/2bath plus basement. Front porch and Back deck on both side. right side is currently has tenant, You are welcome to check the left side of the Duplex.
-
2020-09-11status Pending 392-char remark
Show marketing remark (392 chars)
Location!Location!Location! Excellent Retal income opportunity! Side by Side duplex. You can live one side and rent the other.Roof windows wiring, plumbing,HVAC all 2013. New waterproofing system in the basement. Each side has 3 bedrooms 1 1/2bath plus basement. Front porch and Back deck on both side. right side is currently has tenant, You are welcome to check the left side of the Duplex.
-
2020-08-31status Pending 392-char remark
Show marketing remark (392 chars)
Location!Location!Location! Excellent Retal income opportunity! Side by Side duplex. You can live one side and rent the other.Roof windows wiring, plumbing,HVAC all 2013. New waterproofing system in the basement. Each side has 3 bedrooms 1 1/2bath plus basement. Front porch and Back deck on both side. right side is currently has tenant, You are welcome to check the left side of the Duplex.
-
2020-08-26$219,900 Active 392-char remark
Show marketing remark (392 chars)
Location!Location!Location! Excellent Retal income opportunity! Side by Side duplex. You can live one side and rent the other.Roof windows wiring, plumbing,HVAC all 2013. New waterproofing system in the basement. Each side has 3 bedrooms 1 1/2bath plus basement. Front porch and Back deck on both side. right side is currently has tenant, You are welcome to check the left side of the Duplex.
-
2019-01-11historical
-
2018-12-04$850 Active
-
2017-03-15soldstatus $113,000 Sold
-
2017-01-13historical Active with Contingency
-
2017-01-10$113,000 Active
-
2013-04-29historical
-
2013-04-29soldstatus $5,000
-
2012-04-12$9,900
-
2012-01-28historical
-
2011-10-26$29,900
-
2011-09-21historical
-
2011-08-23$12,500
-
2006-03-08soldstatus $49,500
-
2006-02-22historical
-
2006-01-20$57,900
-
2005-08-22$100,000
-
2001-03-01soldstatus $96,092
ⓘ Source: listings_history table (triggers on properties + properties_extension) + one-shot
backfill from property_details.listing_events for pre-trigger history.
Tax reassessment forecast IN · Partial reset (capped growth)
- Current annual tax
- $5,874 · $490/mo
- Projected year-2 tax
- $5,874 · $490/mo
- Expected delta
- $0/yr ($0/mo · 0.0%)
ⓘ Screening estimate from a state-policy table — verify with the county assessor before closing.
Climate risk First Street
- Flood 6/10 Major FEMA zone X (unshaded) · 75% chance over 30 yrs
- Wildfire 1/10 Low
- Heat 3/10 Moderate 7 d/yr ≥101°F today · 19 d/yr by 30 yrs out
- Wind 2/10 Low 0% chance of damaging wind over 30 yrs
- Air quality 4/10 Moderate 5 unhealthy d/yr today · 7 by 30 yrs out
Nearby sold comps map
Loading sold comps map…
Walkable amenities ~0.75 mi
Loading nearby amenities…
Taxation est. · year 1
- Rental income
- $33,264
- − Mortgage interest
- −$17,645
- − Property taxes
- −$5,874
- − Insurance
- −$1,575
- − Repairs & maintenance
- −$2,661
- − Management
- −$2,661
- − Depreciation
- −$9,164
- Taxable loss
- −$6,316
- Est. tax savings @ 24.0%
- +$1,516
- After-tax cash flow
- $523/yr
For passive investors: Depreciation is non-cash, so a rental often shows a tax loss while cash-flowing — sheltering income. Rental losses are passive: they offset passive income freely, and up to $25,000/yr can offset ordinary (W-2) income if you actively participate and your MAGI is under $100k (phasing out to $0 by $150k); unused losses carry forward. On sale, claimed depreciation is recaptured at up to 25%, and gains may owe capital-gains tax (a 1031 exchange can defer both). Figures are a year-1 estimate at your 24.0% rate — not tax advice; consult a CPA.
Schools (NCES district)
- District
- Indianapolis Public Schools
- NCES district ID
- 1804770
- Math proficiency
- 14% ▼ -7.00%
- Reading proficiency
- 20% ▼ -3.00%
- Median HH income
- $32,034
- Composite
- 13.69/100
- National rank
- #9499
- State rank
- #286 of 301 in IN
Livability — Indianapolis city (balance)
No livability data for this city. (Only ~50 U.S. cities are tracked.)
Census & demographics
- Census place
- Indianapolis city (balance), IN
- County
- Marion County · 998,460 people
- City population
- 881,119
- Metro
- Indianapolis-Carmel-Anderson, IN
- Population (ZIP)
- 28,259
- Household income
- $72,417
- Rent vs Own
- Severe rent burden
- 1149.0
Population outlook (Marion County) Hauer SSP2
- Today (2025)
- 1,025,572 people
- By 2030
- 1,065,727 · +3.9%
- By 2040
- 1,141,577 · +11.3%
- By 2050
- 1,208,920 · +17.9%
- By 2075
- 1,367,288 · +33.3%
- By 2100
- 1,438,201 · +40.2%
Race, ethnicity, and origin ACS 2023
- Neighborhood character
- Diverse neighborhood (Simpson 0.64)
- Race & ethnicity
- White 50% Black 32% Two or more races 10% Hispanic / Latino 7% Asian 3%
- Hispanic origin (detail)
- Mexican 4%
- Common ancestry
- Italian 3% Slovak 2% Romanian 2%
- Foreign-born
- 5% · Canada
- Languages at home
- 89% English-only · Spanish 6% Other Indo-European 2% German/W. Germanic 1%
Political lean MEDSL · Marion
- 2024 margin
- Strong D (+27.7) · D 63.0% · R 35.3% · Other 1.7%
- 2008→2024 swing
- -0.7pp no change · 2008: 28.4pp · 2024: 27.7pp
- All cycles
- 2024: D+27.7 2020: D+29.1 2016: D+22.8 2012: D+22.2 2008: D+28.4
Not yet ingested
- Civics
- —
Market trends
- HPI YoY
- ▼ -322.77%
- Current HPI
- 380.5407
- Rent YoY
- ▲ 6.21%
- Metro
- Indianapolis-Carmel-Anderson, IN
- State GDP YoY
- ▲ 2.90%
- F500 in state
- 18
Industry mix (Fortune 500 HQ in IN)
| Industry | F500 HQs | Revenue |
|---|---|---|
| Industrial Machinery | 2 | $37B |
|
||
| Healthcare | 1 | $177B |
|
||
| Pharmaceuticals | 1 | $45B |
|
||
| Metals / Steel | 1 | $18B |
|
||
| Agriculture | 1 | $17B |
|
||
| Packaging | 1 | $12B |
|
||
Price history
+227.8% since first listed26 events — show timeline
- 2026-06-09 Pending — MIBOR as Distributed by MLS Grid
- 2026-06-06 Price Changed $315,000 MIBOR as Distributed by MLS Grid
- 2026-05-27 Relisted — MIBOR as Distributed by MLS Grid
- 2026-05-20 Pending — MIBOR as Distributed by MLS Grid
- 2026-05-04 Listed $325,000 MIBOR as Distributed by MLS Grid
- 2020-10-19 Sold (MLS) $215,000 MIBOR as Distributed by MLS Grid
- 2020-09-11 Pending — MIBOR as Distributed by MLS Grid
- 2020-08-31 Pending — MIBOR as Distributed by MLS Grid
- 2020-08-26 Listed $219,900 MIBOR as Distributed by MLS Grid
- 2019-01-11 Listing Removed — MIBOR as Distributed by MLS Grid
- 2018-12-04 Listed $850 MIBOR as Distributed by MLS Grid
- 2017-03-15 Sold (MLS) $113,000 MIBOR as Distributed by MLS Grid
- 2017-01-13 Contingent — MIBOR as Distributed by MLS Grid
- 2017-01-10 Listed $113,000 MIBOR as Distributed by MLS Grid
- 2013-04-29 Listing Removed — MIBOR as Distributed by MLS Grid
- 2013-04-29 Sold (MLS) $5,000 MIBOR as Distributed by MLS Grid
- 2012-04-12 Listed $9,900 MIBOR as Distributed by MLS Grid
- 2012-01-28 Listing Removed — MIBOR as Distributed by MLS Grid
- 2011-10-26 Listed $29,900 MIBOR as Distributed by MLS Grid
- 2011-09-21 Listing Removed — MIBOR as Distributed by MLS Grid
- 2011-08-23 Listed $12,500 MIBOR as Distributed by MLS Grid
- 2006-03-08 Sold (MLS) $49,500 MIBOR as Distributed by MLS Grid
- 2006-02-22 Listing Removed — MIBOR as Distributed by MLS Grid
- 2006-01-20 Listed $57,900 MIBOR as Distributed by MLS Grid
- 2005-08-22 Listed $100,000 MIBOR as Distributed by MLS Grid
- 2001-03-01 Sold (Public Records) $96,092 Public Records
Property tax history
+8.5%/yrLatest (2025): $5,874 · +2.2% YoY. Source: county tax records.
Cash-flow waterfall
monthlySold comps — $/sqft
last 12 mo · ≤1 miLoading sold comps…