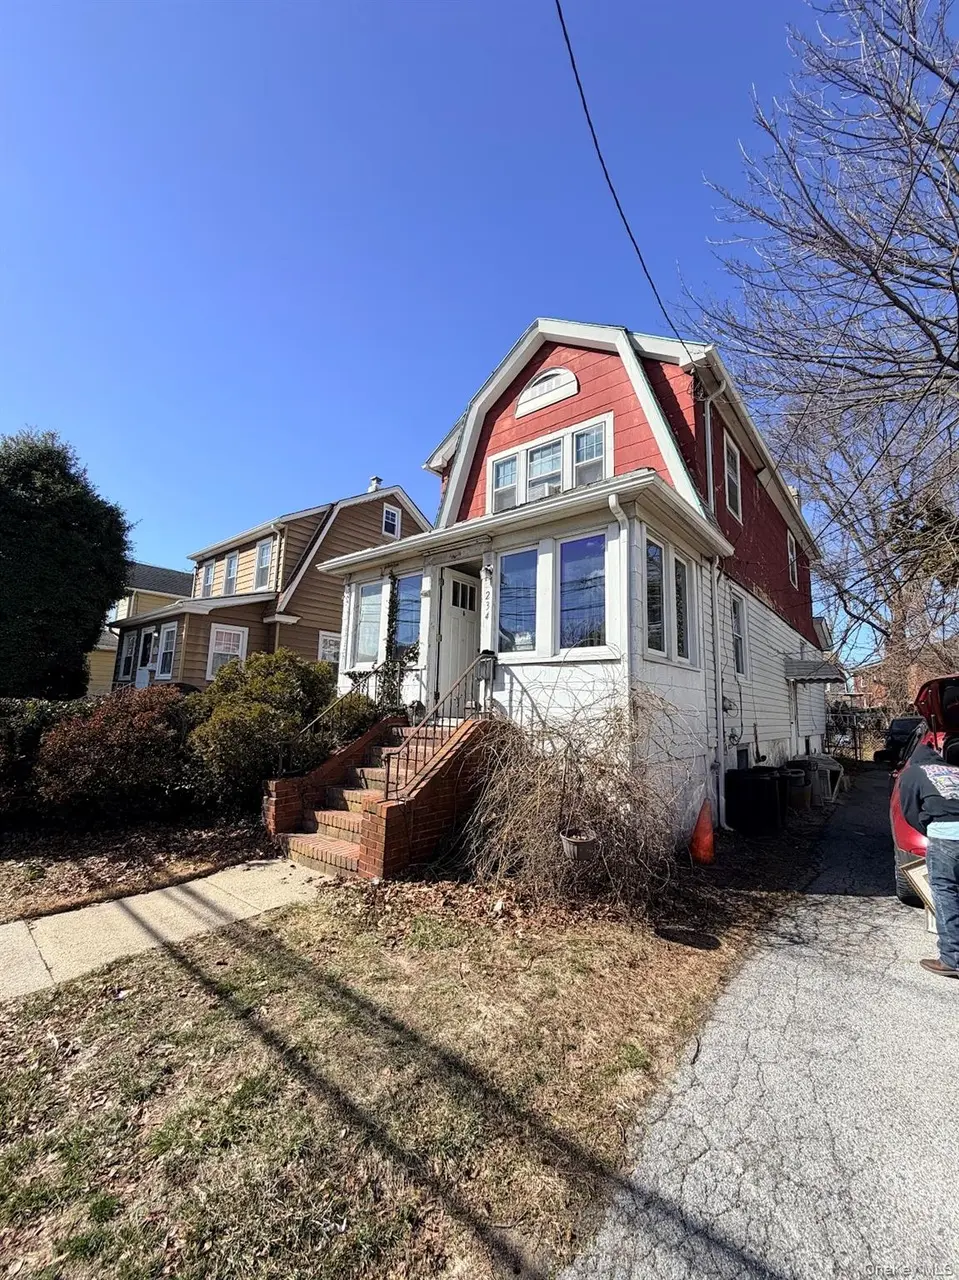
234 Cochran Pl · Valley Stream, NY
Flood risk 4/10 · Minor
- FEMA flood zone
- X (unshaded)
- Chance of flooding over 30 yrs
- 0.13%
- Est. flood insurance / yr
- $473 – $860
Fire risk 1/10 · Minimal
- Est. fire insurance / yr
- $691 – $1,283
Heat risk 6/10 · Moderate
- Hot days now (above 97°F)
- 7 days/yr
- Hot days in 30 yrs
- 16 days/yr
Wind risk 6/10 · Moderate
- Chance of severe wind over 30 yrs
- 70.0%
Air-quality risk 3/10 · Minor
- Unhealthy air days now
- 4 days/yr
- Unhealthy air days in 30 yrs
- 4 days/yr
Risk factors via First Street. Map © Google.
Why this score? — see what drove the C- grade
The composite is a weighted blend of 9 inputs, each scored 0–100. Each bar is that input's sub-score; the figure is the points it added to the 100-point composite (weight × sub-score).
- ARV discount +15.0/15.0
- Cash flow +12.6/30.0
- Schools +6.7/10.0
- Livability +4.4/5.0
- 1% rule +3.9/10.0
- DSCR +3.7/10.0
- Rent growth +2.5/5.0
- Condition / age +2.5/5.0
- Appreciation +0.0/10.0
$449,000
🖨 Deal sheet (PDF) 📄 Offer letter ✓ Due diligence
Listing remarks
INVESTOR OPPORTUNITY IN GIBSON. Positioned in the highly sought-after Gibson section of Valley Stream, 234 Cochran Place presents a rare "blank canvas" opportunity for visionary builders and seasoned investors. This 3-bedroom, 1-bath residence is a total gut renovation project, offered strictly as a cash-only purchase. While the home requires full remediation and a complete rehab, its potential is unmatched given the premier location. Residents will enjoy effortless lifestyle convenience with the Gibson LIRR station just moments away, offering a seamless commute into the city. Bring your architect and your contractor to reimagine this space from the ground up and capitalize on the
Key facts
- As-is condition
- Proven neighborhood
- Cash-only purchase
Tags
Neighborhood map
What this means for you Summary
Snapshot
- This is a 3-bed/1.0-bath single-family listed at $449k.
Deal economics
- At list price, monthly cash flow is $-60 ($-725/yr) — negative.
- To cash-flow at today's rent, offer at most $438k (2.4% below list).
- To meet the 1% rule (rent ≥ 1% of price), the offer needs to be $400k (10.9% below list).
- Recommended offer: $400k (10.9% below list) — sets the bar for 1% rule.
- Cap rate 6.1% vs local median 3.3% in Valley Stream — top-decile yield for the area; either an underpriced asset or a hidden risk that comps aren't pricing in. Stress-test before assuming the spread holds.
Location & tenants
- Location reads 87/100 on livability (#13 in NY, #301 nationally) — a professional / high-income tenant draw. Strengths: amenities A+, commute A+, employment A+; Watch: cost of living F.
- Valley Stream Central High School District (suburban): math 71% / reading 76% proficiency, ranked #78 of 590 in NY (top 13%) — strong family-tenant draw, lease renewals of 3-5y typical; only 17% free/reduced lunch — higher-income household profile.
- Zoned schools: Robert W Carbonaro School (math 72% / reading 67%, grade A-, #447 of 2,108 statewide, top 24%, 369 students, 38% FRL); Valley Stream Memorial Junior High School (math 29% / reading 66%, grade C-, #306 of 729 statewide, top 43%, 1,038 students, 40% FRL); Valley Stream South High School (math 80% / reading 80%, grade A, #510 of 1,100 statewide, top 47%, 1,224 students, 37% FRL) — zoned schools average 38% FRL vs 17% district-wide (22 pts higher); higher-poverty schools than district average — tighter screening recommended.
- Market conditions: 102 active listings in the ZIP; 23 comparable units currently listed for rent nearby; rentals at typical pace (median 20d on market — plan ~3-4 weeks tenant-placement turnaround); high-income renter base; 824 units permitted in Nassau County in 2024 (153 in 5+ unit buildings).
- This rent runs 34% of the median local income ($142k/yr) — at the standard rent-burdened threshold; future hikes will face affordability resistance.
Forward outlook
- Local home prices are declining (-3.0%/yr); year-one equity from $3k of loan paydown is wiped out by about $13k of value loss. Plan a longer hold.
- Nassau County population projected at +7% by 2050 — modest demand growth; plan on rents tracking national, not racing it.
Negotiation context
- It's been on market 18 days — a 2% lower offer ($442k) is reasonable based on typical stale-listing flexibility.
- Current owner paid $36k; list at $449k implies a 1147% gain — meaningful room to come down on a strong offer.
Risks & watch-outs
- Watch-outs: built in 1925 — expect roof / HVAC / electrical / plumbing capex.
- Climate carrying-cost: major wind risk, 70% chance of damaging wind over 30y; extreme-heat days projected 7→16/yr by 2055 (HVAC capex compounding) — expect insurance premiums to compound above CPI over the hold.
Questions for the listing agent
- What do current leases actually rent for vs. the listed asking? Can we see a recent rent roll and the last 12 months of T-12 income?
- Built in 1925 — when were the roof, HVAC, electrical panel, plumbing, and water heater last replaced?
- Is there a deadline driving the sale (1031 exchange, divorce, estate, relocation)? That informs how much negotiation room exists.
- Schools are A-rated — typically a magnet for longer-tenancy family renters. What's the average tenant stay here, and is there a school-zone premium baked into asking?
- What's the average days-on-market for RENTAL listings here right now (not sales)? A rising rental-DOM trend means longer vacancies and softer asking-rent achievability than the comps imply.
- What's the recent tenant-quality profile in this submarket — average credit score on applications, eviction rate, late-payment / NSF rate, and stable-employment percentage? A property-management company in the area should have these aggregated.
- How much new for-sale + rental construction is in the pipeline within 1–3 miles? Heavy new supply typically softens prices + rents 12–24 months out; constrained supply supports both.
Investment metrics
- 1% rule
- 0.89% ✗
- Cap rate
- 6.13%
- Cash-on-cash
- -0.58%
- DSCR
- 0.97
- GRM
- 9.4
CMA / ARV
- ARV (on-the-fly)
- $702,348
- Comps found
- 12
Show comp detail 12 sales within ~0.75 mi
| Address | Dist | Beds/Ba | Sqft | Sold | Price | $/sf | Match |
|---|---|---|---|---|---|---|---|
| 6 Pershing Ave | 0.03mi | 3/2.5 | 1,318 (+3%) | 3mo | $770,000 | $584 | 85 |
| 75 Peninsula Blvd | 0.42mi | 3/2.0 | 1,260 (-2%) | 3mo | $600,000 | $476 | 71 |
| 88 Spruce Ln | 0.29mi | 3/1.0 | 1,161 (-10%) | 1mo | $650,000 | $560 | 70 |
| 33 Dartmouth St | 0.18mi | 3/1.5 | 1,439 (+12%) | 4mo | $651,000 | $452 | 66 |
| 53 Lee Ave | 0.49mi | 4/3.0 (+1) | 1,298 (+1%) | 1mo | $985,000 | $759 | 61 |
| 144 Fairfield St | 0.41mi | 3/1.0 | 1,134 (-12%) | 2mo | $620,000 | $547 | 60 |
| 69 Forest Ave | 0.61mi | 3/1.5 | 1,361 (+6%) | 0mo | $699,000 | $514 | 60 |
| 86 Oceanview Ave | 0.70mi | 4/1.5 (+1) | 1,324 (+3%) | 0mo | $672,000 | $508 | 55 |
| 59 Holly Rd | 0.47mi | 4/2.0 (+1) | 1,142 (-11%) | 2mo | $710,000 | $622 | 49 |
| 95 Horton Ave | 0.64mi | 4/1.0 (+1) | 1,406 (+10%) | 1mo | $700,000 | $498 | 48 |
| 431 Franklin Ave | 0.68mi | 4/1.0 (+1) | 1,100 (-14%) | 1mo | $635,000 | $577 | 39 |
| 61 Harris Ave | 0.74mi | 3/2.5 | 1,474 (+15%) | 3mo | $780,000 | $529 | 32 |
Match score weights: distance 35% · size 25% · config 20% · recency 20%. Top-matched comps best support the ARV.
Projected returns pro-forma
-3.0% appreciation · 3.0% rent growth · sell at horizon
- IRR
- -17.2%
- Equity multiple
- 0.39×
- Total profit
- $-76,471
- Equity at exit
- $66,947
- IRR
- -9.1%
- Equity multiple
- 0.44×
- Total profit
- $-71,004
- Equity at exit
- $38,821
Cash invested: $125,720 (down + closing). Projections, not guarantees.
Landlord ↔ Tenant lean methodology
- Overall (STATE)
- 15 Strongly Tenant-Friendly
- State New York
- 15 Strongly Tenant-Friendly · D+10
- County
- — inherits STATE
- City
- — inherits STATE
ZIP-level market 11581
- Active inventory
- 102
- Price-to-rent
- 9.4×
Monthly cashflow live
- Estimated rent
- $4,000 high interval (Pro) →
- Mortgage (P&I)
- −$2,355
- Tax from tax record
- −$679 /mo · $8,144/yr
- Insurance
- −$187
- HOA
- −$0
- Vacancy / Maint / Mgmt
- −$840
- Net cashflow
- $-60
Break-even live
Sensitivity live
| Price | -10% $194 | -5% $67 | +0% $-60 | +5% $-187 | +10% $-315 |
|---|---|---|---|---|---|
| Rent | -10% $-376 | -5% $-218 | +0% $-60 | +5% $98 | +10% $256 |
| Rate | -1.0pp $166 | -0.5pp $54 | base $-60 | +0.5pp $-177 | +1.0pp $-295 |
UW: 25.0% down · 7.5% · 30yr · 1.5% tax · 5.0% vac · 8.0% maint · 8.0% mgmt
Financing live
Cash to close
- Down payment
- $112,250
- Closing costs
- $13,470
- Reserves months
- —
- Total cash needed
- —
Loan-product check · same deal, 3 products live
Conventional
25% down · 7.5% · 30yr
- Down + closing
- —
- Monthly P&I
- —
- Monthly cashflow
- —
- DSCR
- —
- Eligible?
- —
Personal DTI + credit; lowest rate.
DSCR
20% down · 8.5% · 30yr
- Down + closing
- —
- Monthly P&I
- —
- Monthly cashflow
- —
- DSCR
- —
- Eligible?
- —
No personal income docs; deal must DSCR.
Hard money
10% down · 12.0% · 12mo
- Down + closing
- —
- Monthly P&I
- —
- Monthly cashflow
- —
- DSCR
- —
- Eligible?
- —
Short-term bridge; refi at stabilization.
Rent comps 23 comps
| Address | Beds | Baths | Sqft | Rent | $/sqft | DOM | Units | Dist |
|---|---|---|---|---|---|---|---|---|
| 510 Dubois Ave Apt 3C Valley Stream, NY | 2.0 | 1.5 | 1050 | $3,400 | $3.24 | 45d | 1 | 0.08mi |
| 19 Dartmouth St Valley Stream, NY | 3.0 | 3.5 | 1439 | $4,600 | $3.20 | 0d | 1 | 0.14mi |
| 35 Gibson Blvd Unit 2 Valley Stream, NY | 2.0 | 1.0 | 1150 | $3,900 | $3.39 | 0d | 1 | 0.26mi |
| 66 Kenmore Rd Valley Stream, NY | 2.0 | 1.0 | 1525 | $2,950 | $1.93 | 20d | 1 | 0.41mi |
| 127 Gordon Rd Valley Stream, NY | 3.0 | 1.0 | 1200 | $3,350 | $2.79 | 45d | 1 | 0.46mi |
| 132 Roosevelt Ave Valley Stream, NY | 3.0 | 2.0 | 1010 | $4,300 | $4.26 | 0d | 1 | 0.54mi |
| 363 Hewlett Pkwy Hewlett, NY | 3.0 | 1.5 | 1205 | $4,200 | $3.49 | 26d | 1 | 0.69mi |
| 125 S Cottage St Valley Stream, NY | 1.0–2.0 | 1.0–2.0 | 1143 | $4,285 | $3.75 | 0d | 7 | 0.76mi |
| 92 Wavecrest St Valley Stream, NY | 2.0 | 1.0 | 1200 | $2,800 | $2.33 | 26d | 1 | 0.76mi |
| 61 Hollywood Ave Lynbrook, NY | 2.0 | 1.0 | 1825 | $3,000 | $1.64 | 45d | 1 | 0.77mi |
| 70 S Cottage St Valley Stream, NY | 2.0 | 1.5 | 1290 | $4,000 | $3.10 | 0d | 1 | 0.82mi |
| 309 Franklin Ave Hewlett, NY | 4.0 | 2.0 | 1386 | $6,500 | $4.69 | 0d | 1 | 0.86mi |
| 35 S Franklin Ave Valley Stream, NY | 3.0 | 1.5 | 1692 | $5,500 | $3.25 | 24d | 1 | 0.90mi |
| 65 Prospect Ave Apt 15W Lynbrook, NY | 2.0 | 2.0 | 1060 | $3,680 | $3.47 | 24d | 1 | 1.03mi |
| 353 W Jamaica Ave Valley Stream, NY | 2.0 | 1.0 | 928 | $2,800 | $3.02 | 3d | 1 | 1.06mi |
| 26 Starks Pl Lynbrook, NY | 3.0 | 1.5 | 1822 | $3,850 | $2.11 | 3d | 1 | 1.10mi |
| 227 Franklin Pl Woodmere, NY | 3.0 | 1.0 | 950 | $3,400 | $3.58 | 45d | 1 | 1.17mi |
| 103 E Saint Marks Pl Valley Stream, NY | 3.0 | 1.0 | 1758 | $3,700 | $2.10 | 0d | 1 | 1.20mi |
| 362 W Merrick Rd Unit 101 Valley Stream, NY | 2.0 | 1.0 | 906 | $3,695 | $4.08 | 20d | 1 | 1.24mi |
| 23 Thompson Pl Unit 2 Lynbrook, NY | 3.0 | 1.0 | 900 | $3,100 | $3.44 | 20d | 1 | 1.30mi |
| 2 Leach St Lynbrook, NY | 3.0 | 1.0 | 1710 | $3,300 | $1.93 | 45d | 1 | 1.35mi |
| 14 Endview Ave Lynbrook, NY | 2.0 | 2.0 | 1210 | $3,650 | $3.02 | 45d | 1 | 1.40mi |
| 58 Cohill Rd Unit 1F Valley Stream, NY | 3.0 | 1.0 | 1100 | $3,200 | $2.91 | 12d | 1 | 1.47mi |
Listing history 4 events
-
2026-04-06status Pending
-
2026-03-19price $449,000
-
2026-03-18$439,000 Active
-
1978-11-01soldstatus $36,000
ⓘ Source: listings_history table (triggers on properties + properties_extension) + one-shot
backfill from property_details.listing_events for pre-trigger history.
Tax reassessment forecast NY · Partial reset (capped growth)
- Current annual tax
- $8,144 · $679/mo
- Projected year-2 tax
- $8,144 · $679/mo
- Expected delta
- $0/yr ($0/mo · 0.0%)
ⓘ Screening estimate from a state-policy table — verify with the county assessor before closing.
Climate risk First Street
- Flood 4/10 Moderate FEMA zone X (unshaded) · 13% chance over 30 yrs
- Wildfire 1/10 Low
- Heat 6/10 Major 7 d/yr ≥97°F today · 16 d/yr by 30 yrs out
- Wind 6/10 Major 70% chance of damaging wind over 30 yrs
- Air quality 3/10 Moderate 4 unhealthy d/yr today · 4 by 30 yrs out
Nearby sold comps map
Loading sold comps map…
Walkable amenities ~0.75 mi
Loading nearby amenities…
Taxation est. · year 1
- Rental income
- $48,000
- − Mortgage interest
- −$25,151
- − Property taxes
- −$8,144
- − Insurance
- −$2,245
- − Repairs & maintenance
- −$3,840
- − Management
- −$3,840
- − Depreciation
- −$13,062
- Taxable loss
- −$8,282
- Est. tax savings @ 24.0%
- +$1,988
- After-tax cash flow
- $1,263/yr
For passive investors: Depreciation is non-cash, so a rental often shows a tax loss while cash-flowing — sheltering income. Rental losses are passive: they offset passive income freely, and up to $25,000/yr can offset ordinary (W-2) income if you actively participate and your MAGI is under $100k (phasing out to $0 by $150k); unused losses carry forward. On sale, claimed depreciation is recaptured at up to 25%, and gains may owe capital-gains tax (a 1031 exchange can defer both). Figures are a year-1 estimate at your 24.0% rate — not tax advice; consult a CPA.
Schools (NCES district)
- District
- Valley Stream Central High School District
- NCES district ID
- 3629520
- Math proficiency
- 71% ▼ -7.00%
- Reading proficiency
- 76% ▬ 0.00%
- Median HH income
- $94,844
- Composite
- 66.54/100
- National rank
- #418
- State rank
- #78 of 590 in NY
Livability — Valley Stream
- Score
- 87/100
- State rank
- #13
- US rank
- #301
Category grades
Schools grade is shown separately in the Schools card above.
Census & demographics
- Census place
- Valley Stream, NY
- County
- Nassau County · 653,051 people
- City population
- 65,910
- Metro
- New York-Newark-Jersey City, NY-NJ-PA
- Population (ZIP)
- 22,818
- Household income
- $142,233
- Rent vs Own
- Severe rent burden
- 346.0
Population outlook (Nassau County) Hauer SSP2
- Today (2025)
- 1,409,302 people
- By 2030
- 1,431,482 · +1.6%
- By 2040
- 1,471,607 · +4.4%
- By 2050
- 1,502,845 · +6.6%
- By 2075
- 1,575,403 · +11.8%
- By 2100
- 1,554,356 · +10.3%
Race, ethnicity, and origin ACS 2023
- Neighborhood character
- Highly diverse neighborhood (Simpson 0.75)
- Race & ethnicity
- White 39% Hispanic / Latino 19% Black 18% Asian 17% Two or more races 10%
- Hispanic origin (detail)
- Puerto Rican 5% Dominican 2%
- Common ancestry
- Scotch-Irish 4% Romanian 3% Hispanic 2%
- Foreign-born
- 32% · Canada, China, Jamaica
- Languages at home
- 64% English-only · Spanish 13% Other Indo-European 8% Russian/Polish/Slavic 4%
Political lean MEDSL · Nassau
- 2024 margin
- Toss-up / Even · D 47.9% · R 52.1%
- 2008→2024 swing
- -12.6pp toward R · 2008: 8.4pp · 2024: -4.2pp
- All cycles
- 2024: R+4.2 2020: D+9.5 2016: D+5.3 2012: D+6.7 2008: D+8.4
Not yet ingested
- Civics
- —
Market trends
- HPI YoY
- ▼ -602.04%
- Current HPI
- 285.7096
- Rent YoY
- —
- Metro
- New York-Newark-Jersey City, NY-NJ-PA
- State GDP YoY
- ▲ 2.60%
- F500 in state
- 92
Industry mix (Fortune 500 HQ in NY)
| Industry | F500 HQs | Revenue |
|---|---|---|
| Financial Services | 10 | $950B |
|
||
| Consumer Goods | 9 | $162B |
|
||
| Insurance | 4 | $225B |
|
||
| Telecommunications | 2 | $144B |
|
||
| Pharmaceuticals | 2 | $112B |
|
||
| Media / Entertainment | 2 | $69B |
|
||
Price history
+1147.2% since first listed4 events — show timeline
- 2026-04-06 Pending — OneKey® MLS as Distributed by MLS Grid
- 2026-03-19 Price Changed $449,000 OneKey® MLS as Distributed by MLS Grid
- 2026-03-18 Listed $439,000 OneKey® MLS as Distributed by MLS Grid
- 1978-11-01 Sold (Public Records) $36,000 Public Records
Property tax history
+5.3%/yrLatest (2024): $8,144 · +25.6% YoY. Source: county tax records.
Cash-flow waterfall
monthlySold comps — $/sqft
last 12 mo · ≤1 miLoading sold comps…