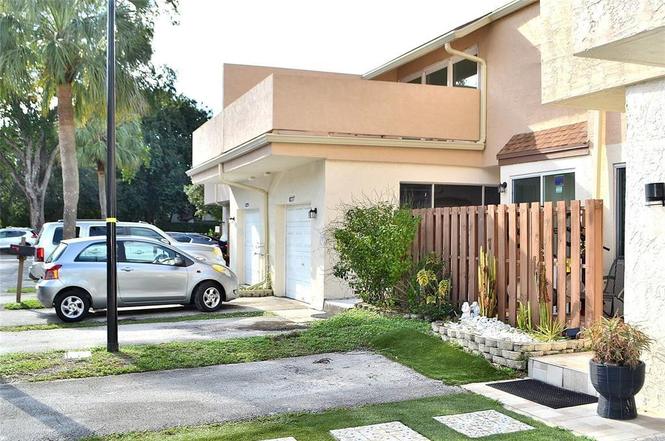
8237 NW 8th Ct #4 · Plantation, FL
Flood risk 1/10 · Minimal
- FEMA flood zone
- X (shaded)
- Chance of flooding over 30 yrs
- 0.0%
- Est. flood insurance / yr
- $507 – $1,088
Fire risk 1/10 · Minimal
- Est. fire insurance / yr
- $947 – $1,759
Heat risk 10/10 · Severe
- Hot days now (above 105°F)
- 7 days/yr
- Hot days in 30 yrs
- 27 days/yr
Wind risk 10/10 · Severe
- Chance of severe wind over 30 yrs
- 99.0%
Air-quality risk 3/10 · Minor
- Unhealthy air days now
- 2 days/yr
- Unhealthy air days in 30 yrs
- 3 days/yr
Risk factors via First Street. Map © Google.
Why this score? — see what drove the D grade
The composite is a weighted blend of 9 inputs, each scored 0–100. Each bar is that input's sub-score; the figure is the points it added to the 100-point composite (weight × sub-score).
- Cash flow +11.9/30.0
- 1% rule +7.8/10.0
- ARV discount +7.5/15.0
- Schools +4.1/10.0
- Livability +4.1/5.0
- DSCR +3.5/10.0
- Rent growth +2.8/5.0
- Condition / age +2.5/5.0
- Appreciation +0.0/10.0
$244,900
🖨 Deal sheet (PDF) 📄 Offer letter ✓ Due diligence
Listing remarks
Great price on this 3BR/2.5BA townhouse in Plantation at Townhouses of Jacaranda community. Seller is paying entire outstanding assessment at closing. This home offers large sq footage, open interior with wood and tile flooring. Includes a washer/dryer, a 1-car garage plus two additional parking spaces, and a fully fenced backyard patio. The primary bedroom is exceptionally spacious and features a large private terrace with new retainer wall. New roof, AC is 3 years old and Impact windows. Community amenities include two pools, tennis courts, and a playground. Close to shopping, major roadways, and schools—great value in a central location.
Key facts
- Private terrace
- New roof
- Two pools
Tags
Property features AI
Finance
- Financial info: Pets allowed with breed restrictions
- HOA & community: Has association; Monthly HOA fee of $814; Association includes pool, grounds maintenance, roof repairs and recreation facility
Exterior
- Parking: Has garage (1 garage space); 1 covered parking space; 2 open parking spaces
- Security: Security features present
- Home design: Townhouse; Resale condition; First-floor entry
- Construction: CBS construction
- Exterior features: Fenced; Not waterfront; West of US-1 road frontage
Interior
- Kitchen: Disposal; Dishwasher; Refrigerator
- Bedrooms: No main-level bedrooms
- Flooring: Tile; Wood
- Bathrooms: Two full bathrooms and one half bathroom (three total); One bathroom on the main level
- Heating & cooling: Electric heating; Central air conditioning
- Interior features: Walk-in closets; Blinds on windows
Neighborhood map
What this means for you Summary
Snapshot
- This is a 3-bed/3.0-bath condo listed at $245k.
Deal economics
- At list price, monthly cash flow is $-63 ($-757/yr) — negative.
- To cash-flow at today's rent, offer at most $234k (4.6% below list).
- Meets the 1% rule at list price ($3k rent vs $245k).
- Recommended offer: $234k (4.6% below list) — sets the bar for cash-flow.
- Cap rate 6.0% vs local median 3.4% in Plantation — top-decile yield for the area; either an underpriced asset or a hidden risk that comps aren't pricing in. Stress-test before assuming the spread holds.
Location & tenants
- Location reads 82/100 on livability (#70 in FL, #1,174 nationally) — a professional / high-income tenant draw. Strengths: commute A+, housing A+, health & safety A+; Watch: amenities C-, cost of living D-.
- Broward (suburban): math 42% / reading 53% proficiency, ranked #46 of 73 in FL (top 63%) — families likely to look elsewhere, expect single-tenant / working-renter base with shorter leases.
- Zoned schools: Peters Elementary School (math 31% / reading 43%, grade F, #1,609 of 2,144 statewide, top 77%, 623 students, 74% FRL); Plantation Middle School (math 20% / reading 39%, grade F, #469 of 571 statewide, top 84%, 572 students, 72% FRL); Plantation High School (math 14% / reading 36%, grade F, #501 of 667 statewide, top 75%, 1,818 students, 68% FRL) — zoned schools average 71% FRL vs 51% district-wide (20 pts higher); higher-poverty schools than district average — tighter screening recommended.
- Zoned-school proficiency averages 30% at this address vs 48% district-wide (-17 pts) — the specific schools serving this property underperform the Broward average; the district grade overstates school quality for this exact location.
- Market conditions: Rents rising (+1.2%/yr); 408 active listings in the ZIP; 40 comparable units currently listed for rent nearby; rentals at typical pace (median 16d on market — plan ~3-4 weeks tenant-placement turnaround); solid renter incomes; 2,111 units permitted in Broward County in 2024 (1,265 in 5+ unit buildings).
Forward outlook
- Local home prices are declining (-3.0%/yr); year-one equity from $2k of loan paydown is wiped out by about $7k of value loss. Plan a longer hold.
- Broward County population projected at +34% by 2050 — long-run rental-demand tailwind backs the buy-and-hold thesis.
Negotiation context
- It's been on market 59 days — a 3% lower offer ($238k) is reasonable based on typical stale-listing flexibility.
- 10 sale attempts since 28y ago; this cycle's ask is 8418% above the opening price — seller raised mid-cycle; expect resistance to lowballs.
- Current owner paid $50k; list at $245k implies a 390% gain — meaningful room to come down on a strong offer.
Risks & watch-outs
- Watch-outs: HOA is 26% of rent.
- Climate carrying-cost: severe wind risk, 99% chance of damaging wind over 30y; extreme-heat days projected 7→27/yr by 2055 (HVAC capex compounding) — expect insurance premiums to compound above CPI over the hold.
Questions for the listing agent
- What do current leases actually rent for vs. the listed asking? Can we see a recent rent roll and the last 12 months of T-12 income?
- It's been on market 59 days. Have you received any prior offers? Is the seller open to a 5% concession, seller financing, or rate buy-down credit?
- What does the HOA fee cover, when was the last increase, and are there any pending special assessments or reserve-fund shortfalls?
- Any open or pending special assessments — roof, HVAC, plumbing, elevator, façade? What's the per-unit balance and payoff schedule, and is the seller paying it off at close or rolling it to the buyer?
- Is there a deadline driving the sale (1031 exchange, divorce, estate, relocation)? That informs how much negotiation room exists.
- Schools are B-rated — typically a magnet for longer-tenancy family renters. What's the average tenant stay here, and is there a school-zone premium baked into asking?
- The area grade is low — what's the realistic commute time and amenity access for the typical tenant pool here? Any planned neighborhood developments (good or bad) we should know about?
- What's the average days-on-market for RENTAL listings here right now (not sales)? A rising rental-DOM trend means longer vacancies and softer asking-rent achievability than the comps imply.
- What's the recent tenant-quality profile in this submarket — average credit score on applications, eviction rate, late-payment / NSF rate, and stable-employment percentage? A property-management company in the area should have these aggregated.
- How much new apartment / multifamily construction is in the pipeline within 1–3 miles? Heavy new supply (>2% of stock underway) typically softens rents 12–24 months out; light construction supports rent growth.
Investment metrics
- 1% rule
- 1.28% ✓
- Cap rate
- 5.98%
- Cash-on-cash
- -1.10%
- DSCR
- 0.95
- GRM
- 6.5
CMA / ARV
No comps found within radius.
Projected returns pro-forma
-3.0% appreciation · 1.23% rent growth · sell at horizon
- IRR
- -20.9%
- Equity multiple
- 0.29×
- Total profit
- $-48,610
- Equity at exit
- $36,515
- IRR
- -21.1%
- Equity multiple
- 0.02×
- Total profit
- $-66,879
- Equity at exit
- $21,174
Cash invested: $68,572 (down + closing). Projections, not guarantees.
Landlord ↔ Tenant lean methodology
- Overall (STATE)
- 87 Strongly Landlord-Friendly
- State Florida
- 87 Strongly Landlord-Friendly · R+3
- County
- — inherits STATE
- City
- — inherits STATE
ZIP-level market 33324
- Home prices YoY
- -33.5%
- Rents YoY
- 1.2%
- Active inventory
- 408
- Price-to-rent
- 6.5×
Monthly cashflow live
- Estimated rent
- $3,126 high interval (Pro) →
- Mortgage (P&I)
- −$1,284
- Tax from tax record
- −$332 /mo · $3,988/yr
- Insurance
- −$102
- HOA
- −$814
- Vacancy / Maint / Mgmt
- −$656
- Net cashflow
- $-63
Break-even live
Sensitivity live
| Price | -10% $76 | -5% $6 | +0% $-63 | +5% $-132 | +10% $-202 |
|---|---|---|---|---|---|
| Rent | -10% $-310 | -5% $-187 | +0% $-63 | +5% $60 | +10% $184 |
| Rate | -1.0pp $60 | -0.5pp $-1 | base $-63 | +0.5pp $-127 | +1.0pp $-191 |
UW: 25.0% down · 7.5% · 30yr · 1.5% tax · 5.0% vac · 8.0% maint · 8.0% mgmt
Financing live
Cash to close
- Down payment
- $61,225
- Closing costs
- $7,347
- Reserves months
- —
- Total cash needed
- —
Loan-product check · same deal, 3 products live
Conventional
25% down · 7.5% · 30yr
- Down + closing
- —
- Monthly P&I
- —
- Monthly cashflow
- —
- DSCR
- —
- Eligible?
- —
Personal DTI + credit; lowest rate.
DSCR
20% down · 8.5% · 30yr
- Down + closing
- —
- Monthly P&I
- —
- Monthly cashflow
- —
- DSCR
- —
- Eligible?
- —
No personal income docs; deal must DSCR.
Hard money
10% down · 12.0% · 12mo
- Down + closing
- —
- Monthly P&I
- —
- Monthly cashflow
- —
- DSCR
- —
- Eligible?
- —
Short-term bridge; refi at stabilization.
Rent comps 40 comps
| Address | Beds | Baths | Sqft | Rent | $/sqft | DOM | Units | Dist |
|---|---|---|---|---|---|---|---|---|
| 8208 NW 8th Pl Plantation, FL | 3.0 | 2.5 | 1770 | $2,950 | $1.67 | 19d | 1 | 0.03mi |
| 8244 NW 9th St #5 Plantation, FL | 4.0 | 2.5 | 2020 | $3,150 | $1.56 | 26d | 1 | 0.04mi |
| 8231 NW 8th Pl #3 Plantation, FL | 3.0 | 2.5 | 1770 | $2,850 | $1.61 | 26d | 1 | 0.06mi |
| 8231 NW 8th Pl #3 Plantation, FL | 3.0 | 2.5 | 1654 | $2,850 | $1.72 | 16d | 1 | 0.06mi |
| 8253 NW 9th St #3 Plantation, FL | 3.0 | 2.5 | 1770 | $2,800 | $1.58 | 9d | 1 | 0.07mi |
| 8244 NW 9th Ct #8 Fort Lauderdale, FL | 4.0 | 2.5 | 2080 | $3,500 | $1.68 | 26d | 1 | 0.08mi |
| 8344 NW 7th Pl Unit 8344 Plantation, FL | 3.0 | 2.5 | 1627 | $4,199 | $2.58 | 26d | 1 | 0.13mi |
| 835 NW 81st Way #5 Plantation, FL | 3.0 | 2.5 | 1770 | $2,600 | $1.47 | 9d | 1 | 0.13mi |
| 833 NW 81st Ter #8 Plantation, FL | 4.0 | 2.5 | 1770 | $2,900 | $1.64 | 22d | 1 | 0.17mi |
| 833 NW 81st Ave #4 Plantation, FL | 4.0 | 2.5 | 1770 | $3,250 | $1.84 | 24d | 1 | 0.21mi |
| 833 NW 81st Ave Plantation, FL | 4.0 | 2.5 | 1770 | $3,250 | $1.84 | 16d | 1 | 0.21mi |
| 833 NW 81st Ave #4 Plantation, FL | 3.0 | 2.5 | 1770 | $3,600 | $2.03 | 20d | 1 | 0.21mi |
| 843 NW 81st Ave #7 Plantation, FL | 3.0 | 2.5 | 1770 | $2,980 | $1.68 | 1d | 1 | 0.21mi |
| 843 NW 81st Ave #7 Plantation, FL | 3.0 | 2.5 | 1770 | $2,980 | $1.68 | 9d | 1 | 0.21mi |
| 8500 Cleary Blvd Plantation, FL | 1.0–3.0 | 1.0–2.0 | 1045 | $3,549 | $3.40 | 1d | 21 | 0.24mi |
| 8000 Cleary Blvd Plantation, FL | 2.0–3.0 | 2.0–3.0 | 1357 | $3,292 | $2.43 | 0d | 21 | 0.28mi |
| 791 N Pine Island Rd Plantation, FL | 2.0–3.0 | 2.0 | 1196 | $2,400 | $2.01 | 7d | 2 | 0.33mi |
| 791 N Pine Island Rd #306 Plantation, FL | 3.0 | 2.0 | 1320 | $2,400 | $1.82 | 14d | 1 | 0.33mi |
| 771 N Pine Island Rd #213 Plantation, FL | 2.0 | 2.5 | 1385 | $2,400 | $1.73 | 7d | 1 | 0.38mi |
| 576 Westree Ln Plantation, FL | 3.0 | 2.5 | 1651 | $3,250 | $1.97 | 26d | 1 | 0.40mi |
| 601 NW 82nd Ave Plantation, FL | 1.0–2.0 | 1.0–2.5 | 1073 | $3,473 | $3.24 | 1d | 9 | 0.41mi |
| 751 N Pine Island Rd Plantation, FL | 1.0–3.0 | 1.0–2.0 | 1003 | $2,400 | $2.39 | 26d | 2 | 0.44mi |
| 9161 Vineyard Lake Dr Unit 9161 Plantation, FL | 3.0 | 2.5 | 1765 | $4,000 | $2.27 | 26d | 1 | 0.44mi |
| 510 NW 84th Ave Plantation, FL | 2.0–3.0 | 2.0 | 1303 | $3,200 | $2.46 | 17d | 5 | 0.46mi |
| 510 NW 84th Ave Plantation, FL | 1.0–3.0 | 1.0–2.0 | 1137 | $3,600 | $3.17 | 13d | 7 | 0.46mi |
| 510 NW 84th Ave Plantation, FL | 1.0–3.0 | 1.0–2.0 | 1124 | $3,200 | $2.85 | 18d | 6 | 0.46mi |
| 510 NW 84th Ave Plantation, FL | 1.0–3.0 | 1.0–2.0 | 1124 | $3,600 | $3.20 | 1d | 6 | 0.46mi |
| 962 NW 79th Ter Plantation, FL | 2.0 | 2.0 | 1432 | $2,997 | $2.09 | 26d | 1 | 0.46mi |
| 537 N University Dr #71 Plantation, FL | 3.0 | 2.5 | 1830 | $3,000 | $1.64 | 7d | 1 | 0.46mi |
| 537 N University Dr #71 Plantation, FL | 3.0 | 2.5 | 1830 | $3,250 | $1.78 | 26d | 1 | 0.46mi |
| 568 N University Dr #568 Plantation, FL | 3.0 | 2.5 | 1589 | $3,250 | $2.05 | 9d | 1 | 0.47mi |
| 568 N University Dr #568 Plantation, FL | 3.0 | 2.5 | 1589 | $3,500 | $2.20 | 24d | 1 | 0.47mi |
| 7903 NW 7th Ct Unit 7903 Plantation, FL | 3.0 | 2.5 | 1340 | $2,800 | $2.09 | 24d | 1 | 0.48mi |
| 1114 NW 79th Dr Plantation, FL | 3.0 | 2.5 | 1624 | $3,000 | $1.85 | 9d | 1 | 0.50mi |
| 7885 NW 7th Ct #406 Plantation, FL | 3.0 | 2.5 | 1340 | $2,750 | $2.05 | 1d | 1 | 0.51mi |
| 7885 NW 7th Ct #406 Plantation, FL | 3.0 | 2.5 | 1340 | $2,800 | $2.09 | 13d | 1 | 0.51mi |
| 9023 Vineyard Lake Dr Plantation, FL | 3.0 | 2.5 | 1739 | $3,500 | $2.01 | 3d | 1 | 0.52mi |
| 9023 Vineyard Lake Dr Plantation, FL | 3.0 | 2.5 | 1739 | $3,500 | $2.01 | 9d | 1 | 0.52mi |
| 8101 NW 14th St Plantation, FL | 1.0–2.0 | 1.5–2.0 | 1123 | $2,619 | $2.33 | 1d | 12 | 0.58mi |
| 9087 Vineyard Lake Dr Plantation, FL | 3.0 | 2.5 | 1590 | $3,350 | $2.11 | 26d | 1 | 0.58mi |
HOA detail condo
- Monthly dues
- $814 · $9,768/yr
- Likely covers
- pool
- Assessments
- None detected in remarks — confirm with the listing agent.
Listing history 27 events
-
2026-05-09status Pending
-
2026-04-08$2,875
-
2026-04-07price $244,900
-
2026-03-01historical $2,775
-
2026-02-27price $2,775
-
2026-02-07$2,800
-
2026-02-04$249,900 Active
-
2025-12-15historical $2,940
-
2025-12-11$2,940
-
2025-12-10historical $2,940
-
2025-12-09historical
-
2025-11-26$2,940
-
2025-11-05price $250,000
-
2025-10-17$275,000 Active
-
2023-04-29historical
-
2023-03-24price $349,000
-
2023-03-03status Active
-
2023-03-03status Pending
-
2022-10-27$359,000 Active
-
2022-09-28historical
-
2022-04-24$349,900 Active
-
2011-09-13soldstatus $50,000
-
2005-03-11soldstatus $201,500
-
1998-10-09soldstatus $79,000
-
1998-04-30historical
-
1998-04-07$85,900
-
1995-04-07soldstatus $67,000
ⓘ Source: listings_history table (triggers on properties + properties_extension) + one-shot
backfill from property_details.listing_events for pre-trigger history.
Tax reassessment forecast FL · Resets to sale price
- Current annual tax
- $3,988 · $332/mo
- Projected year-2 tax
- $3,988 · $332/mo
- Expected delta
- $0/yr ($0/mo · 0.0%)
ⓘ Screening estimate from a state-policy table — verify with the county assessor before closing.
Climate risk First Street
- Flood 1/10 Low FEMA zone X (shaded) · 0% chance over 30 yrs
- Wildfire 1/10 Low
- Heat 10/10 Extreme 7 d/yr ≥105°F today · 27 d/yr by 30 yrs out
- Wind 10/10 Extreme 99% chance of damaging wind over 30 yrs
- Air quality 3/10 Moderate 2 unhealthy d/yr today · 3 by 30 yrs out
Nearby sold comps map
Loading sold comps map…
Walkable amenities ~0.75 mi
Loading nearby amenities…
Taxation est. · year 1
- Rental income
- $37,512
- − Mortgage interest
- −$13,718
- − Property taxes
- −$3,988
- − Insurance
- −$1,224
- − Repairs & maintenance
- −$3,001
- − Management
- −$3,001
- − HOA
- −$9,768
- − Depreciation
- −$7,124
- Taxable loss
- −$4,313
- Est. tax savings @ 24.0%
- +$1,035
- After-tax cash flow
- $278/yr
For passive investors: Depreciation is non-cash, so a rental often shows a tax loss while cash-flowing — sheltering income. Rental losses are passive: they offset passive income freely, and up to $25,000/yr can offset ordinary (W-2) income if you actively participate and your MAGI is under $100k (phasing out to $0 by $150k); unused losses carry forward. On sale, claimed depreciation is recaptured at up to 25%, and gains may owe capital-gains tax (a 1031 exchange can defer both). Figures are a year-1 estimate at your 24.0% rate — not tax advice; consult a CPA.
Schools (NCES district)
- District
- Broward
- NCES district ID
- 1200180
- Math proficiency
- 42% ▼ -18.00%
- Reading proficiency
- 53% ▼ -5.00%
- Median HH income
- $52,139
- Composite
- 40.88/100
- National rank
- #3621
- State rank
- #46 of 73 in FL
Livability — Plantation
- Score
- 82/100
- State rank
- #70
- US rank
- #1174
Category grades
Schools grade is shown separately in the Schools card above.
Census & demographics
- Census place
- Plantation, FL
- County
- Broward County · 1,963,430 people
- City population
- 111,690
- Metro
- Miami-Fort Lauderdale-Pompano Beach, FL
- Population (ZIP)
- 50,151
- Household income
- $85,000
- Rent vs Own
- Severe rent burden
- 2923.0
Population outlook (Broward County) Hauer SSP2
- Today (2025)
- 2,207,033 people
- By 2030
- 2,360,704 · +7.0%
- By 2040
- 2,661,208 · +20.6%
- By 2050
- 2,946,698 · +33.5%
- By 2075
- 3,602,273 · +63.2%
- By 2100
- 3,970,984 · +79.9%
Race, ethnicity, and origin ACS 2023
- Neighborhood character
- Diverse neighborhood (Simpson 0.69)
- Race & ethnicity
- White 42% Hispanic / Latino 31% Two or more races 20% Black 16% Asian 6%
- Hispanic origin (detail)
- Mexican 2% Puerto Rican 5% Cuban 4% Dominican 2%
- Common ancestry
- Romanian 3% Italian 3% Hispanic 3%
- Foreign-born
- 31% · Canada, Jamaica, China
- Languages at home
- 60% English-only · Spanish 26% Other Indo-European 4% French/Haitian/Cajun 3%
Political lean MEDSL · Broward
- 2024 margin
- D (+17.0) · D 58.0% · R 41.0%
- 2008→2024 swing
- -17.8pp toward R · 2008: 34.7pp · 2024: 17.0pp
- All cycles
- 2024: D+17.0 2020: D+29.8 2016: D+35.0 2012: D+34.9 2008: D+34.7
Not yet ingested
- Civics
- —
Market trends
- HPI YoY
- ▼ -160.16%
- Current HPI
- 317.8685
- Rent YoY
- ▲ 1.23%
- Metro
- Miami-Fort Lauderdale-Pompano Beach, FL
- State GDP YoY
- ▲ 3.28%
- F500 in state
- 36
Industry mix (Fortune 500 HQ in FL)
| Industry | F500 HQs | Revenue |
|---|---|---|
| Industrial Technology | 2 | $29B |
|
||
| Insurance | 2 | $17B |
|
||
| Retail | 1 | $60B |
|
||
| Technology Distribution | 1 | $58B |
|
||
| Homebuilding | 1 | $35B |
|
||
| Technology Manufacturing | 1 | $35B |
|
||
Price history
-95.7% since first listed27 events — show timeline
- 2026-05-09 Pending — Beaches MLS
- 2026-04-08 Listed for Rent $2,875 RMLSFL
- 2026-04-07 Price Changed $244,900 Beaches MLS
- 2026-03-01 Rental Removed $2,775 GFLMLS
- 2026-02-27 Price Changed $2,775 GFLMLS
- 2026-02-07 Listed for Rent $2,800 GFLMLS
- 2026-02-04 Listed $249,900 Beaches MLS
- 2025-12-15 Rental Removed $2,940 ZUMPER1
- 2025-12-11 Listed for Rent $2,940 ZUMPER1
- 2025-12-10 Rental Removed $2,940 MARMLS
- 2025-12-09 Listing Removed — MARMLS
- 2025-11-26 Listed for Rent $2,940 MARMLS
- 2025-11-05 Price Changed $250,000 MARMLS
- 2025-10-17 Listed $275,000 MARMLS
- 2023-04-29 Listing Removed — MARMLS
- 2023-03-24 Price Changed $349,000 MARMLS
- 2023-03-03 Relisted — MARMLS
- 2023-03-03 Pending — MARMLS
- 2022-10-27 Listed $359,000 MARMLS
- 2022-09-28 Listing Removed — MARMLS
- 2022-04-24 Listed $349,900 MARMLS
- 2011-09-13 Sold (MLS) $50,000 MARMLS
- 2005-03-11 Sold (Public Records) $201,500 Public Records
- 1998-10-09 Sold (Public Records) $79,000 Public Records
- 1998-04-30 Listing Removed — Beaches MLS
- 1998-04-07 Listed $85,900 Beaches MLS
- 1995-04-07 Sold (Public Records) $67,000 Public Records
Property tax history
+8.9%/yrLatest (2025): $3,988 · -15.5% YoY. Source: county tax records.
Cash-flow waterfall
monthlySold comps — $/sqft
last 12 mo · ≤1 miLoading sold comps…