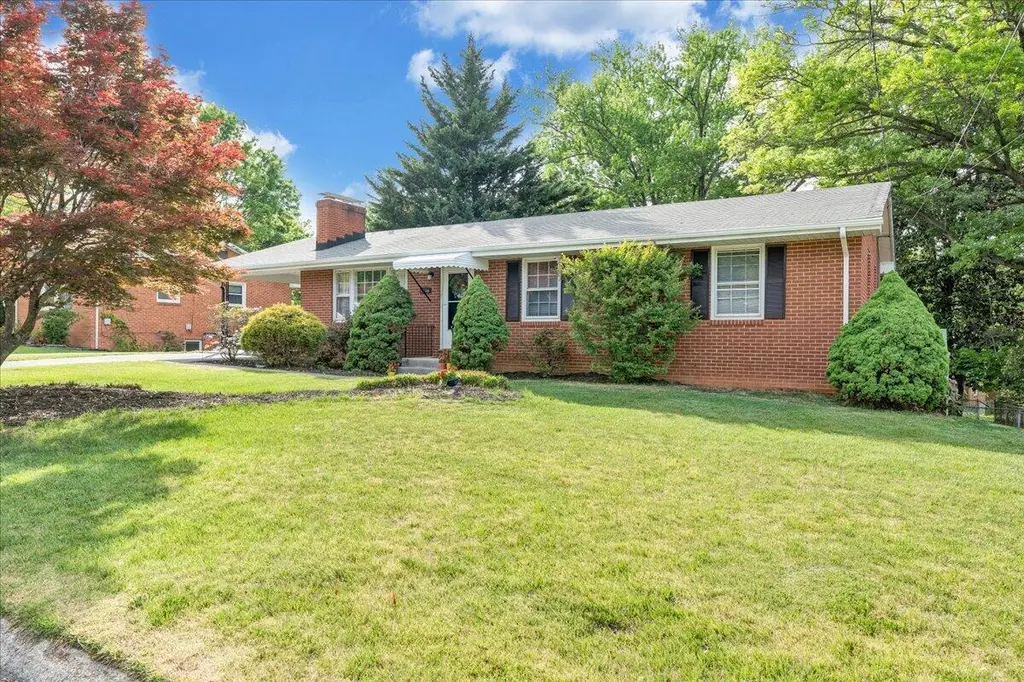
3359 Pamlico Dr · Cave Spring, VA
Flood risk 1/10 · Minimal
- FEMA flood zone
- X (unshaded)
- Chance of flooding over 30 yrs
- 0.0%
- Est. flood insurance / yr
- $473 – $860
Fire risk 2/10 · Minimal
- Est. fire insurance / yr
- $666 – $1,236
Heat risk 5/10 · Moderate
- Hot days now (above 99°F)
- 7 days/yr
- Hot days in 30 yrs
- 19 days/yr
Wind risk 2/10 · Minimal
- Chance of severe wind over 30 yrs
- 1.0%
Air-quality risk 2/10 · Minimal
- Unhealthy air days now
- 0 days/yr
- Unhealthy air days in 30 yrs
- 1 days/yr
Risk factors via First Street. Map © Google.
Why this score? — see what drove the F grade
The composite is a weighted blend of 9 inputs, each scored 0–100. Each bar is that input's sub-score; the figure is the points it added to the 100-point composite (weight × sub-score).
- Cash flow +8.4/30.0
- Schools +6.4/10.0
- ARV discount +5.7/15.0
- Livability +3.8/5.0
- Rent growth +3.2/5.0
- Condition / age +2.5/5.0
- DSCR +2.3/10.0
- 1% rule +1.9/10.0
- Appreciation +0.0/10.0
$319,900
🖨 Deal sheet (PDF) 📄 Offer letter ✓ Due diligence
Listing remarks
Desirable Cave Spring location with top-rated schools and everyday convenience! This classic 4-bedroom, 1.5-bath ranch offers easy entry-level living with three bedrooms on the main level, including a primary suite with half bath. Hardwood floors are in great condition and continue under the carpet in the bedrooms. The full walkout basement adds valuable space with a fourth bedroom, flexible living area, and excellent storage--perfect for a home office, recreation room, or guest space. Enjoy outdoor living with a large fenced yard, attached carport, and a storage building with electricity. Recent updates include furnace (2021), central air (2022), and water heater (2023)--providing added co
Key facts
- Recent updates
- Cave spring location
- Attached carport
Tags
Neighborhood map
What this means for you Summary
Snapshot
- This is a 4-bed/1.5-bath single-family listed at $320k.
Deal economics
- At list price, monthly cash flow is $-285 ($-3k/yr) — negative.
- To cash-flow at today's rent, offer at most $270k (15.7% below list).
- To meet the 1% rule (rent ≥ 1% of price), the offer needs to be $221k (31.0% below list).
- Recommended offer: $221k (31.0% below list) — sets the bar for 1% rule.
- Cap rate 5.2% vs local median 3.4% in Cave Spring — top-decile yield for the area; either an underpriced asset or a hidden risk that comps aren't pricing in. Stress-test before assuming the spread holds.
Location & tenants
- Location reads 76/100 on livability (#113 in VA, #3,513 nationally) — a middle-class / working-renter tenant base. Strengths: housing A+, health & safety A+, cost of living A-; Watch: amenities F, commute F.
- Roanoke County Public School District (suburban): math 71% / reading 78% proficiency, ranked #9 of 131 in VA (top 7%) — strong family-tenant draw, lease renewals of 3-5y typical.
- Zoned schools: Cave Spring Elementary (math 77% / reading 82%, grade A, #141 of 1,108 statewide, top 14%, 508 students, 24% FRL); Cave Spring Middle (math 76% / reading 82%, grade A+, #29 of 342 statewide, top 9%, 765 students, 30% FRL); Cave Spring High (math 86% / reading 90%, grade A, #13 of 319 statewide, top 4%, 1,056 students, 22% FRL) — zoned schools at 26% FRL track the district average.
- Market conditions: Rents rising (+2.9%/yr); 340 active listings in the ZIP; 3 comparable units currently listed for rent nearby; rentals at typical pace (median 24d on market — plan ~3-4 weeks tenant-placement turnaround); solid renter incomes; 360 units permitted in Roanoke County in 2024 (228 in 5+ unit buildings).
Forward outlook
- Local home prices are declining (-3.0%/yr); year-one equity from $2k of loan paydown is wiped out by about $10k of value loss. Plan a longer hold.
- Roanoke County population projected at +5% by 2050 — modest demand growth; plan on rents tracking national, not racing it.
Negotiation context
- Only 2 days on market — expect competitive offers; lowballing is unlikely to land.
- Current owner paid $124k; list at $320k implies a 157% gain — meaningful room to come down on a strong offer.
Risks & watch-outs
- Climate carrying-cost: extreme-heat days projected 7→19/yr by 2055 (HVAC capex compounding) — expect insurance premiums to compound above CPI over the hold.
Questions for the listing agent
- What do current leases actually rent for vs. the listed asking? Can we see a recent rent roll and the last 12 months of T-12 income?
- Built in 1965 — when were the roof, HVAC, electrical panel, plumbing, and water heater last replaced?
- Is there a deadline driving the sale (1031 exchange, divorce, estate, relocation)? That informs how much negotiation room exists.
- Schools are A-rated — typically a magnet for longer-tenancy family renters. What's the average tenant stay here, and is there a school-zone premium baked into asking?
- The area grade is low — what's the realistic commute time and amenity access for the typical tenant pool here? Any planned neighborhood developments (good or bad) we should know about?
- What's the average days-on-market for RENTAL listings here right now (not sales)? A rising rental-DOM trend means longer vacancies and softer asking-rent achievability than the comps imply.
- What's the recent tenant-quality profile in this submarket — average credit score on applications, eviction rate, late-payment / NSF rate, and stable-employment percentage? A property-management company in the area should have these aggregated.
- How much new for-sale + rental construction is in the pipeline within 1–3 miles? Heavy new supply typically softens prices + rents 12–24 months out; constrained supply supports both.
Investment metrics
- 1% rule
- 0.69% ✗
- Cap rate
- 5.22%
- Cash-on-cash
- -3.82%
- DSCR
- 0.83
- GRM
- 12.1
CMA / ARV
- ARV (on-the-fly)
- $307,536
- Comps found
- 1
Show comp detail 1 sale within ~0.75 mi
| Address | Dist | Beds/Ba | Sqft | Sold | Price | $/sf | Match |
|---|---|---|---|---|---|---|---|
| 3125 Penn Forest Blvd | 0.20mi | 3/2.0 (-1) | 1,144 (-4%) | 22mo | $295,000 | $258 | 58 |
Match score weights: distance 35% · size 25% · config 20% · recency 20%. Top-matched comps best support the ARV.
Projected returns pro-forma
-3.0% appreciation · 2.88% rent growth · sell at horizon
- IRR
- -22.9%
- Equity multiple
- 0.21×
- Total profit
- $-70,325
- Equity at exit
- $47,698
- IRR
- -17.7%
- Equity multiple
- 0.04×
- Total profit
- $-86,008
- Equity at exit
- $27,659
Cash invested: $89,572 (down + closing). Projections, not guarantees.
Landlord ↔ Tenant lean methodology
- Overall (STATE)
- 55 Moderately Landlord-Leaning
- State Virginia
- 55 Moderately Landlord-Leaning · D+2
- County
- — inherits STATE
- City
- — inherits STATE
ZIP-level market 24018
- Rents YoY
- 2.9%
- Active inventory
- 340
- Price-to-rent
- 12.1×
Monthly cashflow live
- Estimated rent
- $2,207 medium interval (Pro) →
- Mortgage (P&I)
- −$1,678
- Tax from tax record
- −$218 /mo · $2,613/yr
- Insurance
- −$133
- HOA
- −$0
- Lot rent
- −$0
- Vacancy / Maint / Mgmt
- −$464
- Net cashflow
- $-285
Break-even live
Sensitivity live
| Price | -10% $-104 | -5% $-194 | +0% $-285 | +5% $-375 | +10% $-466 |
|---|---|---|---|---|---|
| Rent | -10% $-459 | -5% $-372 | +0% $-285 | +5% $-198 | +10% $-110 |
| Rate | -1.0pp $-124 | -0.5pp $-203 | base $-285 | +0.5pp $-368 | +1.0pp $-452 |
UW: 25.0% down · 7.5% · 30yr · 1.5% tax · 5.0% vac · 8.0% maint · 8.0% mgmt
Financing live
Cash to close
- Down payment
- $79,975
- Closing costs
- $9,597
- Reserves months
- —
- Total cash needed
- —
Loan-product check · same deal, 3 products live
Conventional
25% down · 7.5% · 30yr
- Down + closing
- —
- Monthly P&I
- —
- Monthly cashflow
- —
- DSCR
- —
- Eligible?
- —
Personal DTI + credit; lowest rate.
DSCR
20% down · 8.5% · 30yr
- Down + closing
- —
- Monthly P&I
- —
- Monthly cashflow
- —
- DSCR
- —
- Eligible?
- —
No personal income docs; deal must DSCR.
Hard money
10% down · 12.0% · 12mo
- Down + closing
- —
- Monthly P&I
- —
- Monthly cashflow
- —
- DSCR
- —
- Eligible?
- —
Short-term bridge; refi at stabilization.
Rent comps 3 comps
| Address | Beds | Baths | Sqft | Rent | $/sqft | DOM | Units | Dist |
|---|---|---|---|---|---|---|---|---|
| 3620 Manassas Dr Roanoke, VA | 3.0 | 1.5 | 1200 | $2,300 | $1.92 | 46d | 1 | 0.61mi |
| 3345 Circle Brook Dr Cave Spring, VA | 1.0–3.0 | 1.0–2.0 | 997 | $1,920 | $1.92 | 16d | 11 | 1.06mi |
| 3363 View Ave Roanoke, VA | 3.0 | 1.0 | 1014 | $1,895 | $1.87 | 23d | 1 | 1.14mi |
Listing history 4 events
-
2026-04-26status Pending
-
2026-04-24$319,900 Active
-
2000-06-01soldstatus $124,500
-
1995-02-01soldstatus $92,000
ⓘ Source: listings_history table (triggers on properties + properties_extension) + one-shot
backfill from property_details.listing_events for pre-trigger history.
Tax reassessment forecast VA · Resets to sale price
- Current annual tax
- $2,613 · $218/mo
- Projected year-2 tax
- $2,623 · $219/mo
- Expected delta
- +$10/yr (+$1/mo · 0.4%)
ⓘ Screening estimate from a state-policy table — verify with the county assessor before closing.
Climate risk First Street
- Flood 1/10 Low FEMA zone X (unshaded) · 0% chance over 30 yrs
- Wildfire 2/10 Low
- Heat 5/10 Major 7 d/yr ≥99°F today · 19 d/yr by 30 yrs out
- Wind 2/10 Low 100% chance of damaging wind over 30 yrs
- Air quality 2/10 Low 0 unhealthy d/yr today · 1 by 30 yrs out
Nearby sold comps map
Loading sold comps map…
Walkable amenities ~0.75 mi
Loading nearby amenities…
Taxation est. · year 1
- Rental income
- $26,488
- − Mortgage interest
- −$17,919
- − Property taxes
- −$2,613
- − Insurance
- −$1,600
- − Repairs & maintenance
- −$2,119
- − Management
- −$2,119
- − Depreciation
- −$9,306
- Taxable loss
- −$9,188
- Est. tax savings @ 24.0%
- +$2,205
- After-tax cash flow
- $-1,213/yr
For passive investors: Depreciation is non-cash, so a rental often shows a tax loss while cash-flowing — sheltering income. Rental losses are passive: they offset passive income freely, and up to $25,000/yr can offset ordinary (W-2) income if you actively participate and your MAGI is under $100k (phasing out to $0 by $150k); unused losses carry forward. On sale, claimed depreciation is recaptured at up to 25%, and gains may owe capital-gains tax (a 1031 exchange can defer both). Figures are a year-1 estimate at your 24.0% rate — not tax advice; consult a CPA.
Schools (NCES district)
- District
- Roanoke County Public School District
- NCES district ID
- 5103330
- Math proficiency
- 71% ▼ -19.00%
- Reading proficiency
- 78% ▼ -6.00%
- Median HH income
- $60,526
- Composite
- 64.08/100
- National rank
- #578
- State rank
- #9 of 131 in VA
Livability — Cave Spring
- Score
- 76/100
- State rank
- #113
- US rank
- #3513
Category grades
Schools grade is shown separately in the Schools card above.
Census & demographics
- Census place
- Cave Spring, VA
- County
- Roanoke County · 67,305 people
- Metro
- Roanoke, VA
- Population (ZIP)
- 38,720
- Household income
- $90,885
- Rent vs Own
- Severe rent burden
- 495.0
Population outlook (Roanoke County) Hauer SSP2
- Today (2025)
- 98,162 people
- By 2030
- 99,793 · +1.7%
- By 2040
- 101,965 · +3.9%
- By 2050
- 103,328 · +5.3%
- By 2075
- 108,641 · +10.7%
- By 2100
- 104,845 · +6.8%
Race, ethnicity, and origin ACS 2023
- Neighborhood character
- Predominantly White (83%)
- Race & ethnicity
- White 83% Asian 6% Hispanic / Latino 4% Two or more races 4% Black 4%
- Common ancestry
- Italian 4% Slovak 3% Serbian 3%
- Foreign-born
- 10% · Canada, China, Vietnam
- Languages at home
- 86% English-only · Spanish 5% Other Indo-European 3% Other Asian/Pacific 1%
Political lean MEDSL · Roanoke
- 2024 margin
- Strong R (+22.5) · D 38.2% · R 60.7% · Other 1.1%
- 2008→2024 swing
- -1.4pp toward R · 2008: -21.1pp · 2024: -22.5pp
- All cycles
- 2024: R+22.5 2020: R+21.8 2016: R+28.1 2012: R+25.6 2008: R+21.1
Not yet ingested
- Civics
- —
Market trends
- HPI YoY
- ▼ -266.18%
- Current HPI
- 176.0558
- Rent YoY
- ▲ 2.88%
- Metro
- Roanoke, VA
- State GDP YoY
- ▲ 2.40%
- F500 in state
- 50
Industry mix (Fortune 500 HQ in VA)
| Industry | F500 HQs | Revenue |
|---|---|---|
| Aerospace / Defense | 4 | $236B |
|
||
| Technology / Defense | 3 | $32B |
|
||
| Financial Services | 2 | $176B |
|
||
| Utilities | 2 | $27B |
|
||
| Insurance | 2 | $25B |
|
||
| Technology | 2 | $15B |
|
||
Price history
+247.7% since first listed4 events — show timeline
- 2026-04-26 Pending — MLSRV
- 2026-04-24 Listed $319,900 MLSRV
- 2000-06-01 Sold (Public Records) $124,500 Public Records
- 1995-02-01 Sold (Public Records) $92,000 Public Records
Property tax history
+4.6%/yrLatest (2025): $2,613 · +8.6% YoY. Source: county tax records.
Cash-flow waterfall
monthlySold comps — $/sqft
last 12 mo · ≤1 miLoading sold comps…