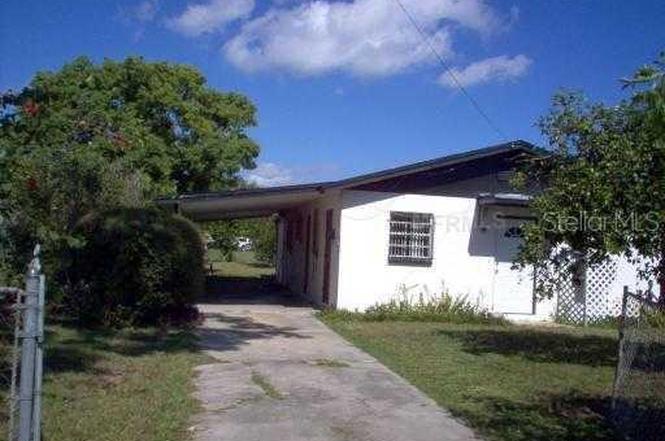
309 Center St · Auburndale, FL
Flood risk 1/10 · Minimal
- FEMA flood zone
- X (unshaded)
- Chance of flooding over 30 yrs
- 0.0%
- Est. flood insurance / yr
- $507 – $1,088
Fire risk 4/10 · Minor
- Est. fire insurance / yr
- $947 – $1,759
Heat risk 8/10 · Major
- Hot days now (above 107°F)
- 7 days/yr
- Hot days in 30 yrs
- 25 days/yr
Wind risk 9/10 · Severe
- Chance of severe wind over 30 yrs
- 99.0%
Air-quality risk 2/10 · Minimal
- Unhealthy air days now
- 0 days/yr
- Unhealthy air days in 30 yrs
- 1 days/yr
Risk factors via First Street. Map © Google.
Why this score? — see what drove the D+ grade
The composite is a weighted blend of 9 inputs, each scored 0–100. Each bar is that input's sub-score; the figure is the points it added to the 100-point composite (weight × sub-score).
- Cash flow +18.9/30.0
- ARV discount +7.5/15.0
- DSCR +6.0/10.0
- Livability +4.2/5.0
- 1% rule +4.1/10.0
- Schools +3.5/10.0
- Rent growth +3.3/5.0
- Condition / age +2.5/5.0
- Appreciation +0.0/10.0
$169,900
🖨 Deal sheet 📄 Offer letter ✓ Due diligence
Listing remarks MLS
Downtown Auburndale location- CBD Zoning- 2 Large Storage Rooms. New tile floors
Key facts
- Steps from city park
- Steps from downtown
- Zoned cbd
Tags
Property features AI
Finance
- Other: Located in CBD zoning
- Financial info: No lease restrictions; Unfurnished
- HOA & community: No HOA/association indicated
Exterior
- Parking: Carport (1 space)
- Utilities: Public water; Public sewer; Broadband/high-speed internet available; Cable available
- Home design: Single family residence; One level; Faces southeast; Residential property
- Construction: Block construction; Shingle roof; Slab foundation; Built on a 0.15-acre lot
- Exterior features: Storage
Interior
- Kitchen: Range
- Bedrooms: 2 bedrooms
- Flooring: Ceramic tile; Vinyl
- Bathrooms: 1 full bathroom
- Heating & cooling: Central heating; Central air conditioning
- Interior features: Other interior features
- Laundry & utility: Laundry room located outside; Electric water heater
Neighborhood map
What this means for you Summary
Snapshot
- This is a 2-bed/1.0-bath single-family listed at $170k.
Deal economics
- At list price, monthly cash flow is $174 ($2k/yr) — positive.
- The deal already cash-flows at list — no discount required.
- To meet the 1% rule (rent ≥ 1% of price), the offer needs to be $155k (9.0% below list).
- Recommended offer: $155k (9.0% below list) — sets the bar for 1% rule.
Location & tenants
- Location reads 83/100 on livability (#48 in FL, #905 nationally) — a professional / high-income tenant draw. Strengths: cost of living A+, housing A+, health & safety A+; Watch: amenities C-, commute C-.
- Polk (suburban): math 39% / reading 43% proficiency, ranked #62 of 73 in FL (top 85%) — families likely to look elsewhere, expect single-tenant / working-renter base with shorter leases.
- Market conditions: Rents rising (+3.2%/yr); 476 active listings in the ZIP; 8 comparable units currently listed for rent nearby; rentals at typical pace (median 15d on market — plan ~3-4 weeks tenant-placement turnaround); 10,384 units permitted in Polk County in 2024 (1,716 in 5+ unit buildings).
Forward outlook
- Local home prices are declining (-3.0%/yr); year-one equity from $1k of loan paydown is wiped out by about $5k of value loss. Plan a longer hold.
- Polk County population projected at +33% by 2050 — long-run rental-demand tailwind backs the buy-and-hold thesis.
Negotiation context
- It's been on market 84 days — a 6% lower offer ($160k) is reasonable based on typical stale-listing flexibility.
- 3 sale attempts since 19y ago with the ask held roughly flat each time — persistent listings suggest the price (not the market) is what's stuck; bring a comps-based counter.
- Current owner paid $70k; list at $170k implies a 143% gain — meaningful room to come down on a strong offer.
Risks & watch-outs
- Climate carrying-cost: severe wind risk, 99% chance of damaging wind over 30y; extreme-heat days projected 7→25/yr by 2055 (HVAC capex compounding) — expect insurance premiums to compound above CPI over the hold.
Questions for the listing agent
- It's been on market 84 days. Have you received any prior offers? Is the seller open to a 9% concession, seller financing, or rate buy-down credit?
- Built in 1960 — when were the roof, HVAC, electrical panel, plumbing, and water heater last replaced?
- Why hasn't it sold? Are there any deal-killer items the seller is aware of (foundation, flood, title, zoning, code violations)?
- Is there a deadline driving the sale (1031 exchange, divorce, estate, relocation)? That informs how much negotiation room exists.
- The area grade is low — what's the realistic commute time and amenity access for the typical tenant pool here? Any planned neighborhood developments (good or bad) we should know about?
- What's the average days-on-market for RENTAL listings here right now (not sales)? A rising rental-DOM trend means longer vacancies and softer asking-rent achievability than the comps imply.
- What's the recent tenant-quality profile in this submarket — average credit score on applications, eviction rate, late-payment / NSF rate, and stable-employment percentage? A property-management company in the area should have these aggregated.
- How much new for-sale + rental construction is in the pipeline within 1–3 miles? Heavy new supply typically softens prices + rents 12–24 months out; constrained supply supports both.
Investment metrics
- 1% rule
- 0.91% ✗
- Cap rate
- 7.52%
- Cash-on-cash
- 4.40%
- DSCR
- 1.20
- GRM
- 9.2
CMA / ARV
No comps found within radius.
Projected returns pro-forma
-3.0% appreciation · 3.18% rent growth · sell at horizon
- IRR
- -9.3%
- Equity multiple
- 0.66×
- Total profit
- $-16,196
- Equity at exit
- $25,333
- IRR
- 0.3%
- Equity multiple
- 1.02×
- Total profit
- $1,135
- Equity at exit
- $14,690
Cash invested: $47,572 (down + closing). Projections, not guarantees.
Landlord ↔ Tenant lean methodology
- Overall (STATE)
- 87 Strongly Landlord-Friendly
- State Florida
- 87 Strongly Landlord-Friendly · R+3
- County
- — inherits STATE
- City
- — inherits STATE
ZIP-level market 33823
- Home prices YoY
- -24.5%
- Rents YoY
- 3.2%
- Active inventory
- 476
- Price-to-rent
- 9.2×
Monthly cashflow live
- Estimated rent
- $1,546 high interval (Pro) →
- Mortgage (P&I)
- −$891
- Tax from tax record
- −$85 /mo · $1,024/yr
- Insurance
- −$71
- HOA
- −$0
- Vacancy / Maint / Mgmt
- −$325
- Net cashflow
- $174
Break-even live
UW: 25.0% down · 7.5% · 30yr · 1.5% tax · 5.0% vac · 8.0% maint · 8.0% mgmt
Financing live
Cash to close
- Down payment
- $42,475
- Closing costs
- $5,097
- Reserves months
- —
- Total cash needed
- —
Loan-product check · same deal, 3 products live
Conventional
25% down · 7.5% · 30yr
- Down + closing
- —
- Monthly P&I
- —
- Monthly cashflow
- —
- DSCR
- —
- Eligible?
- —
Personal DTI + credit; lowest rate.
DSCR
20% down · 8.5% · 30yr
- Down + closing
- —
- Monthly P&I
- —
- Monthly cashflow
- —
- DSCR
- —
- Eligible?
- —
No personal income docs; deal must DSCR.
Hard money
10% down · 12.0% · 12mo
- Down + closing
- —
- Monthly P&I
- —
- Monthly cashflow
- —
- DSCR
- —
- Eligible?
- —
Short-term bridge; refi at stabilization.
Rent comps 8 comps
| Address | Beds | Baths | Sqft | Rent | $/sqft | DOM | Units | Dist |
|---|---|---|---|---|---|---|---|---|
| 507 Twin Pines Ln Unit C Auburndale, FL | 2.0 | 1.0 | 640 | $1,000 | $1.56 | 14d | 1 | 0.86mi |
| 704 Sunset Ave Unit B Auburndale, FL | 2.0 | 1.0 | 850 | $1,340 | $1.58 | 14d | 1 | 0.96mi |
| 4 Sandy Ln Auburndale, FL | 3.0 | 2.0 | 954 | $1,620 | $1.70 | 23d | 1 | 0.96mi |
| 249 Century Blvd Unit A Auburndale, FL | 2.0 | 1.0 | 870 | $1,350 | $1.55 | 3d | 1 | 0.98mi |
| 711 Lake Jessie Dr Winter Haven, FL | 2.0 | 2.0 | 884 | $1,400 | $1.58 | 23d | 1 | 1.10mi |
| 192 Julie Ln Auburndale, FL | 3.0 | 2.0 | 1125 | $1,650 | $1.47 | 23d | 1 | 1.22mi |
| 912 Lake Jessie Dr Unit A Winter Haven, FL | 1.0 | 1.0 | 800 | $1,800 | $2.25 | 3d | 1 | 1.33mi |
| 2366 Lake Dr NW Winter Haven, FL | 2.0 | 2.0 | 1003 | $1,350 | $1.35 | 3d | 1 | 1.47mi |
Listing history 18 events
-
2026-06-10days on market $169,900 Active 84 DOM
-
2026-06-09days on market $169,900 Active 83 DOM
-
2026-06-08days on market $169,900 Active 82 DOM
-
2026-06-07days on market $169,900 Active 81 DOM
-
2026-06-05days on market $169,900 Active 78 DOM
-
2026-06-03days on market $169,900 Active 77 DOM
-
2026-06-03days on market $169,900 Active 76 DOM
-
2026-06-01days on market $169,900 Active 75 DOM
-
2026-05-31days on market $169,900 Active 74 DOM
-
2026-05-12price $169,900
-
2026-03-27status Active
-
2026-03-18status Pending
-
2026-03-10$174,900 Active
-
2008-04-22soldstatus $70,000
-
2008-04-17soldstatus $70,000 80-char remark
Show marketing remark (80 chars)
Downtown Auburndale location- CBD Zoning- 2 Large Storage Rooms. New tile floors
-
2007-10-16$75,900 80-char remark
Show marketing remark (80 chars)
Downtown Auburndale location- CBD Zoning- 2 Large Storage Rooms. New tile floors
-
1981-05-01soldstatus $29,900
-
1977-09-01soldstatus $21,900
ⓘ Source: listings_history table (triggers on properties + properties_extension) + one-shot
backfill from property_details.listing_events for pre-trigger history.
Tax reassessment forecast FL · Resets to sale price
- Current annual tax
- $1,024 · $85/mo
- Projected year-2 tax
- $1,410 · $118/mo
- Expected delta
- +$386/yr (+$32/mo · 37.7%)
ⓘ Screening estimate from a state-policy table — verify with the county assessor before closing.
Climate risk First Street
- Flood 1/10 Low FEMA zone X (unshaded) · 0% chance over 30 yrs
- Wildfire 4/10 Moderate
- Heat 8/10 Severe 7 d/yr ≥107°F today · 25 d/yr by 30 yrs out
- Wind 9/10 Extreme 99% chance of damaging wind over 30 yrs
- Air quality 2/10 Low 0 unhealthy d/yr today · 1 by 30 yrs out
Nearby sold comps map
Loading sold comps map…
Walkable amenities ~0.75 mi
Loading nearby amenities…
Taxation est. · year 1
- Rental income
- $18,555
- − Mortgage interest
- −$9,517
- − Property taxes
- −$1,024
- − Insurance
- −$850
- − Repairs & maintenance
- −$1,484
- − Management
- −$1,484
- − Depreciation
- −$4,943
- Taxable loss
- −$747
- Est. tax savings @ 24.0%
- +$179
- After-tax cash flow
- $2,272/yr
For passive investors: Depreciation is non-cash, so a rental often shows a tax loss while cash-flowing — sheltering income. Rental losses are passive: they offset passive income freely, and up to $25,000/yr can offset ordinary (W-2) income if you actively participate and your MAGI is under $100k (phasing out to $0 by $150k); unused losses carry forward. On sale, claimed depreciation is recaptured at up to 25%, and gains may owe capital-gains tax (a 1031 exchange can defer both). Figures are a year-1 estimate at your 24.0% rate — not tax advice; consult a CPA.
Schools (NCES district)
- District
- Polk
- NCES district ID
- 1201590
- Math proficiency
- 39% ▼ -11.00%
- Reading proficiency
- 43% ▼ -4.00%
- Median HH income
- $43,979
- Composite
- 34.74/100
- National rank
- #5132
- State rank
- #62 of 73 in FL
Livability — Auburndale
- Score
- 83/100
- State rank
- #48
- US rank
- #905
Category grades
Schools grade is shown separately in the Schools card above.
Census & demographics
- Census place
- Auburndale, FL
- County
- Polk County · 740,051 people
- City population
- 41,779
- Metro
- Lakeland-Winter Haven, FL
- Population (ZIP)
- 41,779
- Household income
- $71,485
- Rent vs Own
- Severe rent burden
- 821.0
Population outlook (Polk County) Hauer SSP2
- Today (2025)
- 752,975 people
- By 2030
- 804,621 · +6.9%
- By 2040
- 906,117 · +20.3%
- By 2050
- 1,000,476 · +32.9%
- By 2075
- 1,197,520 · +59.0%
- By 2100
- 1,271,518 · +68.9%
Race, ethnicity, and origin ACS 2023
- Neighborhood character
- Predominantly White (65%)
- Race & ethnicity
- White 65% Hispanic / Latino 19% Black 13% Two or more races 6% Asian 2%
- Hispanic origin (detail)
- Mexican 7% Puerto Rican 7% Cuban 1%
- Common ancestry
- Hispanic 3% Lithuanian 2% Romanian 1%
- Foreign-born
- 10% · Canada, Jamaica, Philippines
- Languages at home
- 79% English-only · Spanish 15% French/Haitian/Cajun 3% Other Indo-European 2%
Political lean MEDSL · Polk
- 2024 margin
- Strong R (+20.7) · D 39.2% · R 59.9%
- 2008→2024 swing
- -14.6pp toward R · 2008: -6.1pp · 2024: -20.7pp
- All cycles
- 2024: R+20.7 2020: R+14.4 2016: R+14.1 2012: R+6.8 2008: R+6.1
Not yet ingested
- Civics
- —
Market trends
- HPI YoY
- ▼ -102.70%
- Current HPI
- 316.9436
- Rent YoY
- ▲ 3.18%
- Metro
- Lakeland-Winter Haven, FL
- State GDP YoY
- ▲ 3.28%
- F500 in state
- 36
Industry mix (Fortune 500 HQ in FL)
| Industry | F500 HQs | Revenue |
|---|---|---|
| Industrial Technology | 2 | $29B |
|
||
| Insurance | 2 | $17B |
|
||
| Retail | 1 | $60B |
|
||
| Technology Distribution | 1 | $58B |
|
||
| Homebuilding | 1 | $35B |
|
||
| Technology Manufacturing | 1 | $35B |
|
||
Price history
+675.8% since first listed9 events — show timeline
- 2026-05-12 Price Changed $169,900 Stellar MLS as Distributed by MLS Grid
- 2026-03-27 Relisted — Stellar MLS as Distributed by MLS Grid
- 2026-03-18 Pending — Stellar MLS as Distributed by MLS Grid
- 2026-03-10 Listed $174,900 Stellar MLS as Distributed by MLS Grid
- 2008-04-22 Sold (Public Records) $70,000 Public Records
- 2008-04-17 Sold (MLS) $70,000 Stellar MLS as Distributed by MLS Grid
- 2007-10-16 Listed $75,900 Stellar MLS as Distributed by MLS Grid
- 1981-05-01 Sold (Public Records) $29,900 Public Records
- 1977-09-01 Sold (Public Records) $21,900 Public Records
Property tax history
+2.8%/yrLatest (2025): $1,024 · +3.5% YoY. Source: county tax records.
Cash-flow waterfall
monthlySold comps — $/sqft
last 12 mo · ≤1 miLoading sold comps…