 🏷️ Likely Rental
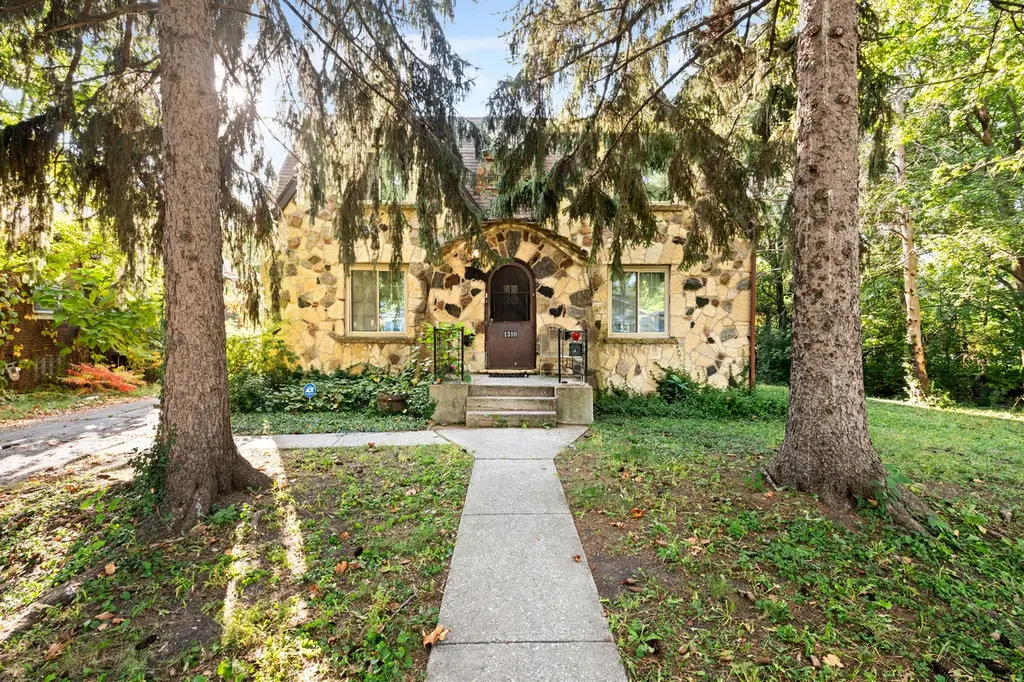
1310 Scott Ave · Chicago Heights, IL
Flood risk 4/10 · Minor
- FEMA flood zone
- A
- Chance of flooding over 30 yrs
- 0.22%
- Est. flood insurance / yr
- $946 – $6,584
Fire risk 1/10 · Minimal
- Est. fire insurance / yr
- $804 – $1,492
Heat risk 3/10 · Minor
- Hot days now (above 101°F)
- 7 days/yr
- Hot days in 30 yrs
- 16 days/yr
Wind risk 2/10 · Minimal
- Chance of severe wind over 30 yrs
- —
Air-quality risk 2/10 · Minimal
- Unhealthy air days now
- 1 days/yr
- Unhealthy air days in 30 yrs
- 1 days/yr
Risk factors via First Street. Map © Google.
Why this score? — see what drove the D grade
The composite is a weighted blend of 9 inputs, each scored 0–100. Each bar is that input's sub-score; the figure is the points it added to the 100-point composite (weight × sub-score).
- ARV discount +15.0/15.0
- Cash flow +8.6/30.0
- 1% rule +5.6/10.0
- Rent growth +4.1/5.0
- Livability +3.6/5.0
- Condition / age +2.5/5.0
- DSCR +2.3/10.0
- Schools +0.7/10.0
- Appreciation +0.0/10.0
$209,000
🖨 Deal sheet (PDF) 📄 Offer letter ✓ Due diligence
Listing remarks MLS
A BIG OPPORTUNITY--Great investment -Fully rented with long time month to month tenants. Beautiful all stone and brick 4 unit in prime location. Tenant pays for their cooking gas and electric. Landlord pays the gas for the heat and the water bill.
Key facts
- Washer dryers
- 4 unit property
- Full basement
Tags
Property features AI
Finance
- Other: Located in Chicago Heights (Bloom Township); School bus service available; Property zoning: SINGL
- Financial info: No special service area; Tax exemptions: Homeowner, Returning Vet
Exterior
- Utilities: Lake Michigan water; Public sewer
- Home design: Two- to four-unit property; Fee simple ownership
- Construction: Brick and stone construction; Asphalt roof; Concrete perimeter foundation; Built 91–100 years ago; Built before 1978
- Exterior features: Stream on property; Lot dimensions approximately 50 x 200; Less than 0.25 acre lot
Interior
- Kitchen: Stove; Refrigerator
- Bedrooms: 4 bedrooms (4 possible)
- Bathrooms: 4 full bathrooms
- Heating & cooling: Natural gas heating; Steam heating; Radiator heating
- Interior features: 13 total rooms; Full unfinished basement
Neighborhood map
What this means for you Summary
Snapshot
- This is a 4-bed/4.0-bath single-family listed at $209k.
Deal economics
- At list price, monthly cash flow is $-495 ($-6k/yr) — negative.
- To cash-flow at today's rent, offer at most $178k (14.8% below list).
- Meets the 1% rule at list price ($2k rent vs $209k).
- Recommended offer: $178k (14.8% below list) — sets the bar for cash-flow.
Location & tenants
- Location reads 71/100 on livability (#339 in IL) — a middle-class / working-renter tenant base. Strengths: commute A+, cost of living A+, housing A+; Watch: employment C-, schools F, crime F.
- Bloom Twp Hsd 206 (suburban): math 8% / reading 9% proficiency, ranked #591 of 620 in IL (top 95%) — low school quality limits family demand, transient renter base, plan for 1-2y turnover.
- Market conditions: Rents rising fast (+6.5%/yr); 224 active listings in the ZIP; 6,272 units permitted in Cook County in 2024 (4,658 in 5+ unit buildings).
- This rent runs 43% of the median local income ($62k/yr) — at the standard rent-burdened threshold; future hikes will face affordability resistance.
Forward outlook
- Local home prices are declining (-3.0%/yr); year-one equity from $1k of loan paydown is wiped out by about $6k of value loss. Plan a longer hold.
Negotiation context
- It's been on market 81 days — a 6% lower offer ($196k) is reasonable based on typical stale-listing flexibility.
- 13 sale attempts since 19y ago; this cycle's ask has dropped $16k (7%) from the opening price — seller is motivated, your offer sets the floor, not the list.
Risks & watch-outs
- Watch-outs: property tax is 4.3% of price; flood insurance adds $314/mo; built in 1929 — expect roof / HVAC / electrical / plumbing capex.
- Climate carrying-cost: in FEMA flood zone A (mandatory federal flood insurance) — expect insurance premiums to compound above CPI over the hold.
Questions for the listing agent
- What do current leases actually rent for vs. the listed asking? Can we see a recent rent roll and the last 12 months of T-12 income?
- It's been on market 81 days. Have you received any prior offers? Is the seller open to a 15% concession, seller financing, or rate buy-down credit?
- Built in 1929 — when were the roof, HVAC, electrical panel, plumbing, and water heater last replaced?
- Property tax is high relative to price — has the assessment been appealed recently, and will the sale trigger a re-assessment?
- What's the actual annual flood-insurance premium (NFIP or private), and is the property in a SFHA with mandatory coverage?
- Why hasn't it sold? Are there any deal-killer items the seller is aware of (foundation, flood, title, zoning, code violations)?
- Is there a deadline driving the sale (1031 exchange, divorce, estate, relocation)? That informs how much negotiation room exists.
- Schools are F-rated, which usually means shorter tenancies and higher turnover. Who's the typical renter profile here, and what's been the actual vacancy rate?
- Crime grade is F in this area — have there been break-ins, vandalism, or insurance claims at this property in the last 3 years? What carrier currently insures it and at what premium?
- The area grade is low — what's the realistic commute time and amenity access for the typical tenant pool here? Any planned neighborhood developments (good or bad) we should know about?
- What's the average days-on-market for RENTAL listings here right now (not sales)? A rising rental-DOM trend means longer vacancies and softer asking-rent achievability than the comps imply.
- What's the recent tenant-quality profile in this submarket — average credit score on applications, eviction rate, late-payment / NSF rate, and stable-employment percentage? A property-management company in the area should have these aggregated.
- How much new for-sale + rental construction is in the pipeline within 1–3 miles? Heavy new supply typically softens prices + rents 12–24 months out; constrained supply supports both.
Investment metrics
- 1% rule
- 1.06% ✓
- Cap rate
- 5.25%
- Cash-on-cash
- -3.72%
- DSCR
- 0.83
- GRM
- 7.9
CMA / ARV
- ARV (on-the-fly)
- $277,548
- Comps found
- 9
Show comp detail 9 sales within ~0.75 mi
| Address | Dist | Beds/Ba | Sqft | Sold | Price | $/sf | Match |
|---|---|---|---|---|---|---|---|
| 302 W 13th St | 0.15mi | 4/3.0 | 2,715 (-1%) | 2mo | $209,000 | $77 | 85 |
| 407 W 12th St | 0.19mi | 5/3.0 (+1) | 2,881 (+5%) | 11mo | $298,700 | $104 | 65 |
| 1320 Ashland Ave | 0.09mi | 5/2.0 (+1) | 2,684 (-2%) | 21mo | $165,000 | $61 | 62 |
| 825 Damico Dr | 0.61mi | 4/3.5 | 2,751 (+0%) | 16mo | $325,000 | $118 | 56 |
| 213 Country Club Rd | 0.32mi | 4/2.5 | 2,374 (-14%) | 1mo | $350,000 | $147 | 56 |
| 255 Irving Blvd | 0.39mi | 4/2.5 | 3,138 (+14%) | 2mo | $254,000 | $81 | 51 |
| 628 W 15th St | 0.71mi | 3/2.5 (-1) | 2,922 (+6%) | 9mo | $249,900 | $86 | 38 |
| 917 N Memorial Dr | 0.53mi | 3/1.5 (-1) | 2,419 (-12%) | 8mo | $245,000 | $101 | 34 |
| 808 Damico Dr | 0.66mi | 3/2.0 (-1) | 2,385 (-13%) | 21mo | $325,000 | $136 | 16 |
Match score weights: distance 35% · size 25% · config 20% · recency 20%. Top-matched comps best support the ARV.
Projected returns pro-forma
-3.0% appreciation · 6.48% rent growth · sell at horizon
- IRR
- -27.7%
- Equity multiple
- 0.03×
- Total profit
- $-56,896
- Equity at exit
- $31,163
- IRR
- -12.3%
- Equity multiple
- 0.10×
- Total profit
- $-52,792
- Equity at exit
- $18,071
Cash invested: $58,520 (down + closing). Projections, not guarantees.
Landlord ↔ Tenant lean methodology
- Overall (STATE)
- 43 Moderately Tenant-Leaning
- State Illinois
- 43 Moderately Tenant-Leaning · D+7
- County
- — inherits STATE
- City
- — inherits STATE
ZIP-level market 60411
- Home prices YoY
- -33.9%
- Rents YoY
- 6.5%
- Active inventory
- 224
- Price-to-rent
- 7.9×
Monthly cashflow live
- Estimated rent
- $2,207 medium interval (Pro) →
- Mortgage (P&I)
- −$1,096
- Tax from tax record
- −$742 /mo · $8,905/yr
- Insurance
- −$87
- Flood insurance flood zone
- −$314 /mo · $3,765/yr
- HOA
- −$0
- Vacancy / Maint / Mgmt
- −$463
- Net cashflow
- $-495
Break-even live
Sensitivity live
| Price | -10% $-377 | -5% $-436 | +0% $-495 | +5% $-554 | +10% $-614 |
|---|---|---|---|---|---|
| Rent | -10% $-670 | -5% $-583 | +0% $-495 | +5% $-408 | +10% $-321 |
| Rate | -1.0pp $-390 | -0.5pp $-442 | base $-495 | +0.5pp $-549 | +1.0pp $-605 |
UW: 25.0% down · 7.5% · 30yr · 1.5% tax · 5.0% vac · 8.0% maint · 8.0% mgmt
Financing live
Cash to close
- Down payment
- $52,250
- Closing costs
- $6,270
- Reserves months
- —
- Total cash needed
- —
Loan-product check · same deal, 3 products live
Conventional
25% down · 7.5% · 30yr
- Down + closing
- —
- Monthly P&I
- —
- Monthly cashflow
- —
- DSCR
- —
- Eligible?
- —
Personal DTI + credit; lowest rate.
DSCR
20% down · 8.5% · 30yr
- Down + closing
- —
- Monthly P&I
- —
- Monthly cashflow
- —
- DSCR
- —
- Eligible?
- —
No personal income docs; deal must DSCR.
Hard money
10% down · 12.0% · 12mo
- Down + closing
- —
- Monthly P&I
- —
- Monthly cashflow
- —
- DSCR
- —
- Eligible?
- —
Short-term bridge; refi at stabilization.
Listing history 50 events
-
2026-06-21days on market $209,000 Active 81 DOM
-
2026-06-18days on market $209,000 Active 78 DOM
-
2026-06-17days on market $209,000 Active 77 DOM
-
2026-06-16days on market $209,000 Active 76 DOM
-
2026-06-15days on market $209,000 Active 75 DOM
-
2026-06-13days on market $209,000 Active 73 DOM
-
2026-06-13days on market $209,000 Active 72 DOM
-
2026-06-09days on market $209,000 Active 69 DOM
-
2026-06-08days on market $209,000 Active 68 DOM
-
2026-06-07days on market $209,000 Active 67 DOM
-
2026-06-04days on market $209,000 Active 64 DOM
-
2026-06-03days on market $209,000 Active 63 DOM
-
2026-06-02days on market $209,000 Active 62 DOM
-
2026-06-01days on market $209,000 Active 61 DOM
-
2026-05-31days on market $209,000 Active 60 DOM
-
2026-05-06price $209,000
-
2026-04-01$225,000 Active
-
2026-03-31historical
-
2026-03-04price
-
2026-02-17status Active
-
2026-02-17price
-
2026-01-29historical Contingent - No Showings
-
2025-12-09price
-
2025-11-06price
-
2025-10-14price
-
2025-10-06Active
-
2023-12-14soldstatus $185,000
-
2023-12-07soldstatus $185,000 Closed 247-char remark
Show marketing remark (247 chars)
A BIG OPPORTUNITY--Great investment -Fully rented with long time month to month tenants. Beautiful all stone and brick 4 unit in prime location. Tenant pays for their cooking gas and electric. Landlord pays the gas for the heat and the water bill.
-
2023-11-02historical Contingent - Continue to Show 247-char remark
Show marketing remark (247 chars)
A BIG OPPORTUNITY--Great investment -Fully rented with long time month to month tenants. Beautiful all stone and brick 4 unit in prime location. Tenant pays for their cooking gas and electric. Landlord pays the gas for the heat and the water bill.
-
2023-06-21status Active 247-char remark
Show marketing remark (247 chars)
A BIG OPPORTUNITY--Great investment -Fully rented with long time month to month tenants. Beautiful all stone and brick 4 unit in prime location. Tenant pays for their cooking gas and electric. Landlord pays the gas for the heat and the water bill.
-
2023-06-16historical Contingent - No Showings 247-char remark
Show marketing remark (247 chars)
A BIG OPPORTUNITY--Great investment -Fully rented with long time month to month tenants. Beautiful all stone and brick 4 unit in prime location. Tenant pays for their cooking gas and electric. Landlord pays the gas for the heat and the water bill.
-
2023-04-19status Active 247-char remark
Show marketing remark (247 chars)
A BIG OPPORTUNITY--Great investment -Fully rented with long time month to month tenants. Beautiful all stone and brick 4 unit in prime location. Tenant pays for their cooking gas and electric. Landlord pays the gas for the heat and the water bill.
-
2023-04-18historical 247-char remark
Show marketing remark (247 chars)
A BIG OPPORTUNITY--Great investment -Fully rented with long time month to month tenants. Beautiful all stone and brick 4 unit in prime location. Tenant pays for their cooking gas and electric. Landlord pays the gas for the heat and the water bill.
-
2023-04-17price $209,500 247-char remark
Show marketing remark (247 chars)
A BIG OPPORTUNITY--Great investment -Fully rented with long time month to month tenants. Beautiful all stone and brick 4 unit in prime location. Tenant pays for their cooking gas and electric. Landlord pays the gas for the heat and the water bill.
-
2023-04-15$203,900 Active 247-char remark
Show marketing remark (247 chars)
A BIG OPPORTUNITY--Great investment -Fully rented with long time month to month tenants. Beautiful all stone and brick 4 unit in prime location. Tenant pays for their cooking gas and electric. Landlord pays the gas for the heat and the water bill.
-
2013-08-08soldstatus $44,500 Closed Sale
-
2013-07-19historical Contingent
-
2013-05-07status Reactivated
-
2013-04-08historical Contingent
-
2013-02-13price $58,000 Price Change
-
2013-02-12status Reactivated
-
2013-01-30historical Contingent
-
2013-01-14price $61,000 Price Change
-
2012-09-04$85,000 New
-
2012-09-02historical
-
2012-06-18price Price Change
-
2012-04-16price Price Change
-
2011-10-20New
-
2011-10-11historical
-
2010-07-07price Price Change
ⓘ Source: listings_history table (triggers on properties + properties_extension) + one-shot
backfill from property_details.listing_events for pre-trigger history.
Tax reassessment forecast IL · Partial reset (capped growth)
- Current annual tax
- $8,905 · $742/mo
- Projected year-2 tax
- $8,905 · $742/mo
- Expected delta
- $0/yr ($0/mo · 0.0%)
ⓘ Screening estimate from a state-policy table — verify with the county assessor before closing.
Climate risk First Street
- Flood 4/10 Moderate FEMA zone A · 22% chance over 30 yrs
- Wildfire 1/10 Low
- Heat 3/10 Moderate 7 d/yr ≥101°F today · 16 d/yr by 30 yrs out
- Wind 2/10 Low
- Air quality 2/10 Low 1 unhealthy d/yr today · 1 by 30 yrs out
Nearby sold comps map
Loading sold comps map…
Walkable amenities ~0.75 mi
Loading nearby amenities…
Taxation est. · year 1
- Rental income
- $26,485
- − Mortgage interest
- −$11,707
- − Property taxes
- −$8,905
- − Insurance
- −$4,810
- − Repairs & maintenance
- −$2,119
- − Management
- −$2,119
- − Depreciation
- −$6,080
- Taxable loss
- −$9,255
- Est. tax savings @ 24.0%
- +$2,221
- After-tax cash flow
- $-3,723/yr
For passive investors: Depreciation is non-cash, so a rental often shows a tax loss while cash-flowing — sheltering income. Rental losses are passive: they offset passive income freely, and up to $25,000/yr can offset ordinary (W-2) income if you actively participate and your MAGI is under $100k (phasing out to $0 by $150k); unused losses carry forward. On sale, claimed depreciation is recaptured at up to 25%, and gains may owe capital-gains tax (a 1031 exchange can defer both). Figures are a year-1 estimate at your 24.0% rate — not tax advice; consult a CPA.
Schools (NCES district)
- District
- Bloom Twp Hsd 206
- NCES district ID
- 1706420
- Math proficiency
- 8% ▼ -3.00%
- Reading proficiency
- 9% ▼ -8.00%
- Median HH income
- $39,795
- Composite
- 7.4/100
- National rank
- #9952
- State rank
- #591 of 620 in IL
Livability — Chicago Heights
- Score
- 71/100
- State rank
- #339
- US rank
- #6836
Category grades
Schools grade is shown separately in the Schools card above.
Census & demographics
- Census place
- Chicago Heights, IL
- County
- Cook County · 4,486,803 people
- City population
- 52,175
- Metro
- Chicago-Naperville-Elgin, IL-IN-WI
- Population (ZIP)
- 52,175
- Household income
- $62,073
- Rent vs Own
- Severe rent burden
- 1714.0
Population outlook (Cook County) Hauer SSP2
- Today (2025)
- 5,347,519 people
- By 2030
- 5,357,703 · +0.2%
- By 2040
- 5,324,924 · -0.4%
- By 2050
- 5,230,762 · -2.2%
- By 2075
- 4,785,735 · -10.5%
- By 2100
- 4,188,836 · -21.7%
Race, ethnicity, and origin ACS 2023
- Neighborhood character
- Diverse neighborhood (Simpson 0.66)
- Race & ethnicity
- Black 49% Hispanic / Latino 26% White 19% Two or more races 11%
- Hispanic origin (detail)
- Mexican 22% Puerto Rican 2%
- Common ancestry
- Romanian 4% Portuguese 1% Lithuanian 1%
- Foreign-born
- 12% · Canada
- Languages at home
- 76% English-only · Spanish 21% Russian/Polish/Slavic 1% Other Indo-European 1%
Political lean MEDSL · Cook
- 2024 margin
- Solid D (+42.0) · D 70.4% · R 28.4% · Other 1.2%
- 2008→2024 swing
- -11.4pp toward R · 2008: 53.4pp · 2024: 42.0pp
- All cycles
- 2024: D+42.0 2020: D+50.3 2016: D+53.0 2012: D+49.4 2008: D+53.4
Not yet ingested
- Civics
- —
Market trends
- HPI YoY
- ▼ -108.75%
- Current HPI
- 212.4058
- Rent YoY
- ▲ 6.48%
- Metro
- Chicago-Naperville-Elgin, IL-IN-WI
- State GDP YoY
- ▲ 1.59%
- F500 in state
- 60
Industry mix (Fortune 500 HQ in IL)
| Industry | F500 HQs | Revenue |
|---|---|---|
| Insurance | 4 | $201B |
|
||
| Consumer Goods | 4 | $87B |
|
||
| Industrial Machinery | 3 | $64B |
|
||
| Healthcare | 2 | $55B |
|
||
| Retail / Pharmacy | 1 | $148B |
|
||
| Agriculture / Food | 1 | $86B |
|
||
Price history
+198.6% since first listed44 events — show timeline
- 2026-05-06 Price Changed $209,000 MRED as Distributed by MLS Grid
- 2026-04-01 Listed $225,000 MRED as Distributed by MLS Grid
- 2026-03-31 Listing Removed — MRED as Distributed by MLS Grid
- 2026-03-04 Price Changed — MRED as Distributed by MLS Grid
- 2026-02-17 Relisted — MRED as Distributed by MLS Grid
- 2026-02-17 Price Changed — MRED as Distributed by MLS Grid
- 2026-01-29 Contingent — MRED as Distributed by MLS Grid
- 2025-12-09 Price Changed — MRED as Distributed by MLS Grid
- 2025-11-06 Price Changed — MRED as Distributed by MLS Grid
- 2025-10-14 Price Changed — MRED as Distributed by MLS Grid
- 2025-10-06 Listed — MRED as Distributed by MLS Grid
- 2023-12-14 Sold (Public Records) $185,000 Public Records
- 2023-12-07 Sold (MLS) $185,000 MRED as Distributed by MLS Grid
- 2023-11-02 Contingent — MRED as Distributed by MLS Grid
- 2023-06-21 Relisted — MRED as Distributed by MLS Grid
- 2023-06-16 Contingent — MRED as Distributed by MLS Grid
- 2023-04-19 Relisted — MRED as Distributed by MLS Grid
- 2023-04-18 Listing Removed — MRED as Distributed by MLS Grid
- 2023-04-17 Price Changed $209,500 MRED as Distributed by MLS Grid
- 2023-04-15 Listed $203,900 MRED as Distributed by MLS Grid
- 2013-08-08 Sold (MLS) $44,500 MRED as Distributed by MLS Grid
- 2013-07-19 Contingent — MRED as Distributed by MLS Grid
- 2013-05-07 Relisted — MRED as Distributed by MLS Grid
- 2013-04-08 Contingent — MRED as Distributed by MLS Grid
- 2013-02-13 Price Changed $58,000 MRED as Distributed by MLS Grid
- 2013-02-12 Relisted — MRED as Distributed by MLS Grid
- 2013-01-30 Contingent — MRED as Distributed by MLS Grid
- 2013-01-14 Price Changed $61,000 MRED as Distributed by MLS Grid
- 2012-09-04 Listed $85,000 MRED as Distributed by MLS Grid
- 2012-09-02 Listing Removed — MRED as Distributed by MLS Grid
- 2012-06-18 Price Changed — MRED as Distributed by MLS Grid
- 2012-04-16 Price Changed — MRED as Distributed by MLS Grid
- 2011-10-20 Listed — MRED as Distributed by MLS Grid
- 2011-10-11 Listing Removed — MRED as Distributed by MLS Grid
- 2010-07-07 Price Changed — MRED as Distributed by MLS Grid
- 2010-04-27 Price Changed — MRED as Distributed by MLS Grid
- 2010-02-17 Price Changed — MRED as Distributed by MLS Grid
- 2009-08-31 Relisted — MRED as Distributed by MLS Grid
- 2009-08-29 Listing Removed — MRED as Distributed by MLS Grid
- 2009-08-18 Listed — MRED as Distributed by MLS Grid
- 2008-05-27 Listing Removed — MRED as Distributed by MLS Grid
- 2007-11-27 Listed — MRED as Distributed by MLS Grid
- 1980-05-02 Sold (Public Records) $70,000 Public Records
- 1980-05-02 Sold (Public Records) $70,000 Public Records
Property tax history
+5.6%/yrLatest (2023): $8,905 · +22.1% YoY. Source: county tax records.
Cash-flow waterfall
monthlySold comps — $/sqft
last 12 mo · ≤1 miLoading sold comps…