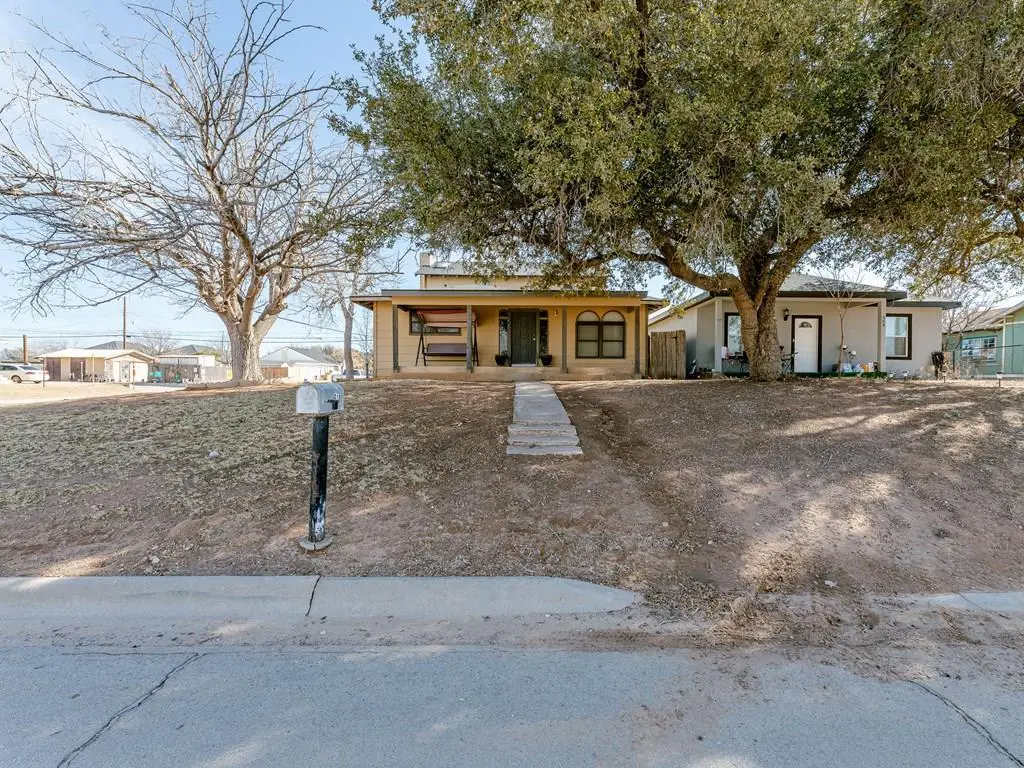
510 N Terrell St · Midland, TX
Flood risk 3/10 · Minor
- FEMA flood zone
- X
- Chance of flooding over 30 yrs
- 0.2%
- Est. flood insurance / yr
- $507 – $1,088
Fire risk 8/10 · Major
- Est. fire insurance / yr
- $1,222 – $2,270
Heat risk 6/10 · Moderate
- Hot days now (above 102°F)
- 7 days/yr
- Hot days in 30 yrs
- 22 days/yr
Wind risk 2/10 · Minimal
- Chance of severe wind over 30 yrs
- 3.0%
Air-quality risk 1/10 · Minimal
- Unhealthy air days now
- 0 days/yr
- Unhealthy air days in 30 yrs
- 0 days/yr
Risk factors via First Street. Map © Google.
Why this score? — see what drove the B grade
The composite is a weighted blend of 9 inputs, each scored 0–100. Each bar is that input's sub-score; the figure is the points it added to the 100-point composite (weight × sub-score).
- Cash flow +29.7/30.0
- ARV discount +15.0/15.0
- DSCR +10.0/10.0
- 1% rule +7.6/10.0
- Livability +4.0/5.0
- Schools +3.2/10.0
- Rent growth +2.7/5.0
- Condition / age +2.5/5.0
- Appreciation +0.0/10.0
$205,000
🖨 Deal sheet 📄 Offer letter ✓ Due diligence
Listing remarks MLS
Charming two-story home owned by the original owners and full of potential! Offering 4 bedrooms, 2 baths, and 2,680 sq ft, this property features multiple living areas, a game room, and a built-in bar perfect for entertaining. Great layout with room to personalize and add value. Located in the established Original Town subdivision close to downtown, shopping, and dining. Home is sold as-is; buyer responsible for repairs required for FHA/VA financing.
Key facts
- Built in bar
- Two story home
- Game room
Tags
Neighborhood map
What this means for you Summary
Snapshot
- This is a 4-bed/2.0-bath single-family listed at $205k.
Deal economics
- At list price, monthly cash flow is $743 ($9k/yr) — positive.
- The deal already cash-flows at list — no discount required.
- Meets the 1% rule at list price ($3k rent vs $205k).
- Recommended offer: $187k (9.0% below list) — sets the bar for market timing.
- Cap rate 10.6% vs local median 4.7% in Midland — top-decile yield for the area; either an underpriced asset or a hidden risk that comps aren't pricing in. Stress-test before assuming the spread holds.
Location & tenants
- Location reads 79/100 on livability (#57 in TX, #2,192 nationally) — a middle-class / working-renter tenant base. Strengths: employment A+, housing A+, health & safety A+; Watch: schools C-, crime C-, commute D+.
- Midland ISD (urban): math 34% / reading 36% proficiency, ranked #477 of 826 in TX (top 58%) — families likely to look elsewhere, expect single-tenant / working-renter base with shorter leases.
- Market conditions: Rents flat; 113 active listings in the ZIP; 2 comparable units currently listed for rent nearby; 1,504 units permitted in Midland County in 2024 (0 in 5+ unit buildings).
- At $2,574/mo this rent would consume 54% of the median local household income ($57k/yr) (locally 938% of renters already pay >50% of income on rent) — very limited rent-growth headroom before tenants either downsize or default.
Forward outlook
- Local home prices are declining (-3.0%/yr); year-one equity from $1k of loan paydown is wiped out by about $6k of value loss. Plan a longer hold.
- Midland County population projected at +83% by 2050 — long-run rental-demand tailwind backs the buy-and-hold thesis.
- At projected returns (-3.0% appreciation + 0.7% rent growth), your $57k cash investment doubles in ~10 years — after that, you're playing with house money.
Negotiation context
- It's been on market 101 days — a 9% lower offer ($187k) is reasonable based on typical stale-listing flexibility.
- 2 sale attempts; this cycle's ask has dropped $15k (7%) from the opening price — seller is motivated, your offer sets the floor, not the list.
Risks & watch-outs
- Watch-outs: built in 1950 — expect roof / HVAC / electrical / plumbing capex.
- Climate carrying-cost: severe wildfire risk; extreme-heat days projected 7→22/yr by 2055 (HVAC capex compounding) — expect insurance premiums to compound above CPI over the hold.
Questions for the listing agent
- It's been on market 101 days. Have you received any prior offers? Is the seller open to a 9% concession, seller financing, or rate buy-down credit?
- Built in 1950 — when were the roof, HVAC, electrical panel, plumbing, and water heater last replaced?
- Why hasn't it sold? Are there any deal-killer items the seller is aware of (foundation, flood, title, zoning, code violations)?
- Is there a deadline driving the sale (1031 exchange, divorce, estate, relocation)? That informs how much negotiation room exists.
- What's the average days-on-market for RENTAL listings here right now (not sales)? A rising rental-DOM trend means longer vacancies and softer asking-rent achievability than the comps imply.
- What's the recent tenant-quality profile in this submarket — average credit score on applications, eviction rate, late-payment / NSF rate, and stable-employment percentage? A property-management company in the area should have these aggregated.
- How much new for-sale + rental construction is in the pipeline within 1–3 miles? Heavy new supply typically softens prices + rents 12–24 months out; constrained supply supports both.
Investment metrics
- 1% rule
- 1.26% ✓
- Cap rate
- 10.64%
- Cash-on-cash
- 15.54%
- DSCR
- 1.69
- GRM
- 6.6
CMA / ARV
- ARV (median comp)
- $359,984
- List price
- $205,000
- Delta
- -43.05%
- Verdict
- UNDERPRICED
- Comps
- 2 within 2.0 mi
Projected returns pro-forma
-3.0% appreciation · 0.74% rent growth · sell at horizon
- IRR
- 3.9%
- Equity multiple
- 1.15×
- Total profit
- $8,370
- Equity at exit
- $30,566
- IRR
- 11.3%
- Equity multiple
- 1.80×
- Total profit
- $45,656
- Equity at exit
- $17,725
Cash invested: $57,400 (down + closing). Projections, not guarantees.
Landlord ↔ Tenant lean methodology
- Overall (STATE)
- 87 Strongly Landlord-Friendly
- State Texas
- 87 Strongly Landlord-Friendly · R+5
- County
- — inherits STATE
- City
- — inherits STATE
ZIP-level market 79701
- Rents YoY
- 0.7%
- Active inventory
- 113
- Price-to-rent
- 6.6×
Monthly cashflow live
- Estimated rent
- $2,574 medium interval (Pro) →
- Mortgage (P&I)
- −$1,075
- Tax from tax record
- −$129 /mo · $1,554/yr
- Insurance
- −$85
- HOA
- −$0
- Vacancy / Maint / Mgmt
- −$541
- Net cashflow
- $743
Break-even live
UW: 25.0% down · 7.5% · 30yr · 1.5% tax · 5.0% vac · 8.0% maint · 8.0% mgmt
Financing live
Cash to close
- Down payment
- $51,250
- Closing costs
- $6,150
- Reserves months
- —
- Total cash needed
- —
Loan-product check · same deal, 3 products live
Conventional
25% down · 7.5% · 30yr
- Down + closing
- —
- Monthly P&I
- —
- Monthly cashflow
- —
- DSCR
- —
- Eligible?
- —
Personal DTI + credit; lowest rate.
DSCR
20% down · 8.5% · 30yr
- Down + closing
- —
- Monthly P&I
- —
- Monthly cashflow
- —
- DSCR
- —
- Eligible?
- —
No personal income docs; deal must DSCR.
Hard money
10% down · 12.0% · 12mo
- Down + closing
- —
- Monthly P&I
- —
- Monthly cashflow
- —
- DSCR
- —
- Eligible?
- —
Short-term bridge; refi at stabilization.
Rent comps 2 comps
| Address | Beds | Baths | Sqft | Rent | $/sqft | DOM | Units | Dist |
|---|---|---|---|---|---|---|---|---|
| 1100 N Colorado St Unit NA Midland, TX | 3.0 | 2.0 | 1768 | $2,500 | $1.41 | 21d | 1 | 0.68mi |
| 1500 N Terrell St Midland, TX | 3.0 | 2.0 | 2027 | $2,600 | $1.28 | 13d | 1 | 0.75mi |
Listing history 11 events
-
2026-05-13status Pending 454-char remark
Show marketing remark (454 chars)
Charming two-story home owned by the original owners and full of potential! Offering 4 bedrooms, 2 baths, and 2,680 sq ft, this property features multiple living areas, a game room, and a built-in bar perfect for entertaining. Great layout with room to personalize and add value. Located in the established Original Town subdivision close to downtown, shopping, and dining. Home is sold as-is; buyer responsible for repairs required for FHA/VA financing.
-
2026-05-01status Active 454-char remark
Show marketing remark (454 chars)
Charming two-story home owned by the original owners and full of potential! Offering 4 bedrooms, 2 baths, and 2,680 sq ft, this property features multiple living areas, a game room, and a built-in bar perfect for entertaining. Great layout with room to personalize and add value. Located in the established Original Town subdivision close to downtown, shopping, and dining. Home is sold as-is; buyer responsible for repairs required for FHA/VA financing.
-
2026-04-17historical Active Under Contract 454-char remark
Show marketing remark (454 chars)
Charming two-story home owned by the original owners and full of potential! Offering 4 bedrooms, 2 baths, and 2,680 sq ft, this property features multiple living areas, a game room, and a built-in bar perfect for entertaining. Great layout with room to personalize and add value. Located in the established Original Town subdivision close to downtown, shopping, and dining. Home is sold as-is; buyer responsible for repairs required for FHA/VA financing.
-
2026-03-25price $205,000 454-char remark
Show marketing remark (454 chars)
Charming two-story home owned by the original owners and full of potential! Offering 4 bedrooms, 2 baths, and 2,680 sq ft, this property features multiple living areas, a game room, and a built-in bar perfect for entertaining. Great layout with room to personalize and add value. Located in the established Original Town subdivision close to downtown, shopping, and dining. Home is sold as-is; buyer responsible for repairs required for FHA/VA financing.
-
2026-02-01$220,000 Active 454-char remark
Show marketing remark (454 chars)
Charming two-story home owned by the original owners and full of potential! Offering 4 bedrooms, 2 baths, and 2,680 sq ft, this property features multiple living areas, a game room, and a built-in bar perfect for entertaining. Great layout with room to personalize and add value. Located in the established Original Town subdivision close to downtown, shopping, and dining. Home is sold as-is; buyer responsible for repairs required for FHA/VA financing.
-
2025-11-08price $199,900
-
2025-10-15price $234,900
-
2025-09-26price $239,900
-
2025-08-15price $249,900
-
2025-07-22price $264,900
-
1949-06-23soldstatus
ⓘ Source: listings_history table (triggers on properties + properties_extension) + one-shot
backfill from property_details.listing_events for pre-trigger history.
Tax reassessment forecast TX · Resets to sale price
- Current annual tax
- $1,554 · $129/mo
- Projected year-2 tax
- $3,752 · $313/mo
- Expected delta
- +$2,198/yr (+$183/mo · 141.4%)
ⓘ Screening estimate from a state-policy table — verify with the county assessor before closing.
Climate risk First Street
- Flood 3/10 Moderate FEMA zone X · 20% chance over 30 yrs
- Wildfire 8/10 Severe
- Heat 6/10 Major 7 d/yr ≥102°F today · 22 d/yr by 30 yrs out
- Wind 2/10 Low 3% chance of damaging wind over 30 yrs
- Air quality 1/10 Low 0 unhealthy d/yr today · 0 by 30 yrs out
Nearby sold comps map
Loading sold comps map…
Walkable amenities ~0.75 mi
Loading nearby amenities…
Taxation est. · year 1
- Rental income
- $30,887
- − Mortgage interest
- −$11,483
- − Property taxes
- −$1,554
- − Insurance
- −$1,025
- − Repairs & maintenance
- −$2,471
- − Management
- −$2,471
- − Depreciation
- −$5,964
- Taxable income
- $5,920
- Est. tax owed @ 24.0%
- −$1,421
- After-tax cash flow
- $7,501/yr
For passive investors: Depreciation is non-cash, so a rental often shows a tax loss while cash-flowing — sheltering income. Rental losses are passive: they offset passive income freely, and up to $25,000/yr can offset ordinary (W-2) income if you actively participate and your MAGI is under $100k (phasing out to $0 by $150k); unused losses carry forward. On sale, claimed depreciation is recaptured at up to 25%, and gains may owe capital-gains tax (a 1031 exchange can defer both). Figures are a year-1 estimate at your 24.0% rate — not tax advice; consult a CPA.
Schools (NCES district)
- District
- Midland ISD
- NCES district ID
- 4830570
- Math proficiency
- 34% ▼ -7.00%
- Reading proficiency
- 36% ▬ 0.00%
- Median HH income
- $63,457
- Composite
- 31.63/100
- National rank
- #5938
- State rank
- #477 of 826 in TX
Livability — Midland
- Score
- 79/100
- State rank
- #57
- US rank
- #2192
Category grades
Schools grade is shown separately in the Schools card above.
Census & demographics
- Census place
- Midland, TX
- County
- Midland County · 168,494 people
- City population
- 168,494
- Metro
- Midland, TX
- Population (ZIP)
- 27,131
- Household income
- $57,346
- Rent vs Own
- Severe rent burden
- 938.0
Population outlook (Midland County) Hauer SSP2
- Today (2025)
- 220,895 people
- By 2030
- 253,667 · +14.8%
- By 2040
- 325,498 · +47.4%
- By 2050
- 404,168 · +83.0%
- By 2075
- 609,802 · +176.1%
- By 2100
- 760,172 · +244.1%
Race, ethnicity, and origin ACS 2023
- Neighborhood character
- Diverse neighborhood (Simpson 0.55)
- Race & ethnicity
- Hispanic / Latino 61% Two or more races 28% White 27% Black 10%
- Hispanic origin (detail)
- Mexican 57%
- Common ancestry
- Lithuanian 1% Slovak 1% Ukrainian 1%
- Foreign-born
- 17% · Canada
- Languages at home
- 55% English-only · Spanish 44%
Political lean MEDSL · Midland
- 2024 margin
- Solid R (+60.5) · D 19.3% · R 79.8%
- 2008→2024 swing
- -3.3pp toward R · 2008: -57.3pp · 2024: -60.5pp
- All cycles
- 2024: R+60.5 2020: R+56.6 2016: R+55.2 2012: R+61.5 2008: R+57.3
Not yet ingested
- Civics
- —
Market trends
- HPI YoY
- ▼ -227.32%
- Current HPI
- 234.6111
- Rent YoY
- ▲ 0.74%
- Metro
- Midland, TX
- State GDP YoY
- ▲ 3.95%
- F500 in state
- 110
Industry mix (Fortune 500 HQ in TX)
| Industry | F500 HQs | Revenue |
|---|---|---|
| Energy | 16 | $1,198B |
|
||
| Technology | 5 | $198B |
|
||
| Engineering / Construction | 4 | $72B |
|
||
| Energy Services | 3 | $60B |
|
||
| Utilities | 3 | $41B |
|
||
| Healthcare | 2 | $330B |
|
||
Price history
-22.6% since first listed11 events — show timeline
- 2026-05-13 Pending — PBBOR
- 2026-05-01 Relisted — PBBOR
- 2026-04-17 Contingent — PBBOR
- 2026-03-25 Price Changed $205,000 PBBOR
- 2026-02-01 Listed $220,000 PBBOR
- 2025-11-08 Price Changed $199,900 PBBOR
- 2025-10-15 Price Changed $234,900 PBBOR
- 2025-09-26 Price Changed $239,900 PBBOR
- 2025-08-15 Price Changed $249,900 PBBOR
- 2025-07-22 Price Changed $264,900 PBBOR
- 1949-06-23 Sold (Public Records) — Public Records
Property tax history
-0.1%/yrLatest (2025): $1,554 · -3.4% YoY. Source: county tax records.
Cash-flow waterfall
monthlySold comps — $/sqft
last 12 mo · ≤1 miLoading sold comps…