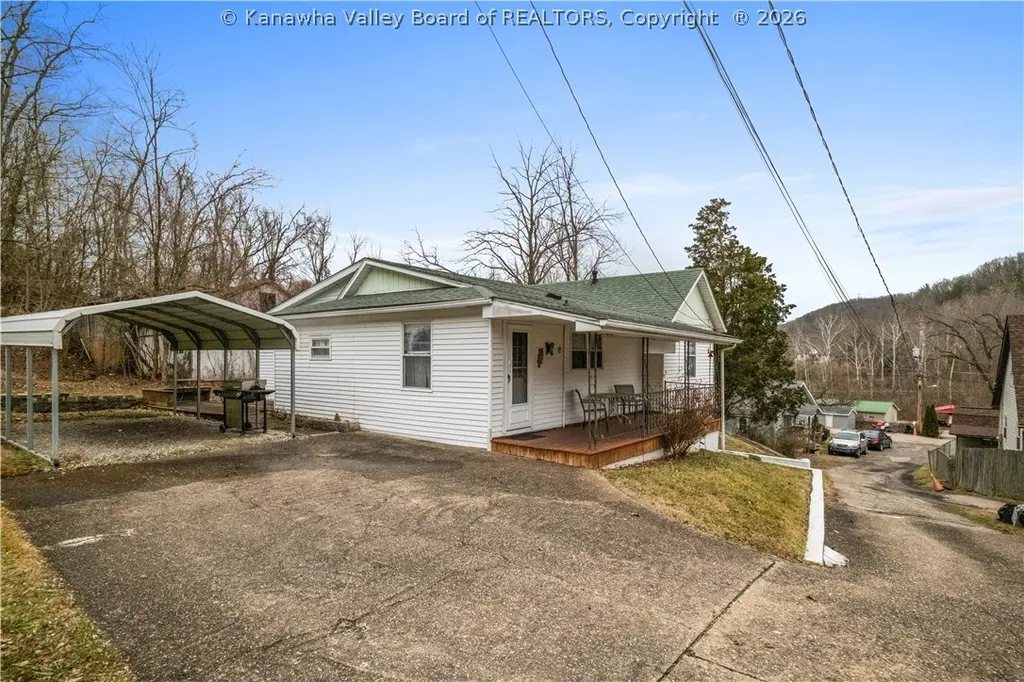
224 Easter Rd · Nitro, WV
Flood risk 1/10 · Minimal
- FEMA flood zone
- X (unshaded)
- Chance of flooding over 30 yrs
- 0.0%
- Est. flood insurance / yr
- $473 – $860
Fire risk 5/10 · Moderate
- Est. fire insurance / yr
- $787 – $1,461
Heat risk 5/10 · Moderate
- Hot days now (above 101°F)
- 7 days/yr
- Hot days in 30 yrs
- 19 days/yr
Wind risk 2/10 · Minimal
- Chance of severe wind over 30 yrs
- 1.0%
Air-quality risk 2/10 · Minimal
- Unhealthy air days now
- 0 days/yr
- Unhealthy air days in 30 yrs
- 1 days/yr
Risk factors via First Street. Map © Google.
Why this score? — see what drove the C+ grade
The composite is a weighted blend of 9 inputs, each scored 0–100. Each bar is that input's sub-score; the figure is the points it added to the 100-point composite (weight × sub-score).
- Cash flow +23.6/30.0
- ARV discount +15.0/15.0
- DSCR +7.6/10.0
- 1% rule +5.3/10.0
- Livability +3.4/5.0
- Schools +2.9/10.0
- Rent growth +2.5/5.0
- Condition / age +2.5/5.0
- Appreciation +0.0/10.0
$115,000
🖨 Deal sheet (PDF) 📄 Offer letter ✓ Due diligence
Listing remarks
Very well-maintained home in move-in condition. The home has 2.3 bedrooms, a spacious kitchen open to the dining room and gathering room. Enjoy the convenience of easy interstate access while enjoying privacy with a large deck, carport, covered front porch, and storage building. Lots of room to grow!
Key facts
- Large deck
- Covered front porch
- Spacious kitchen
Tags
Property features AI
Finance
- Financial info: Annual tax amount: $800
Exterior
- Security: Smoke detectors
- Utilities: Public water; Public sewer; Cable available
- Home design: Single-family residence; Residential property
- Construction: Frame construction with vinyl siding; Composition/shingle roof
- Exterior features: Deck; Porch; Outdoor storage
Interior
- Kitchen: Refrigerator
- Bedrooms: Total of 8 rooms (bedrooms included in room count)
- Flooring: Carpet; Vinyl
- Bathrooms: 1 full bathroom
- Heating & cooling: Central air conditioning; Forced air heating
- Interior features: Insulated windows; Partial basement; Storage
Neighborhood map
What this means for you Summary
Snapshot
- This is a 3-bed/1.0-bath single-family listed at $115k.
Deal economics
- At list price, monthly cash flow is $217 ($3k/yr) — positive.
- The deal already cash-flows at list — no discount required.
- Meets the 1% rule at list price ($1k rent vs $115k).
- Recommended offer: $112k (3.0% below list) — sets the bar for market timing.
- Cap rate 8.6% vs local median 5.2% in Nitro — top-decile yield for the area; either an underpriced asset or a hidden risk that comps aren't pricing in. Stress-test before assuming the spread holds.
Location & tenants
- Location reads 67/100 on livability (#97 in WV) — a middle-class / working-renter tenant base. Strengths: cost of living A+, housing A+; Watch: crime C-, amenities C-, employment D.
- Kanawha County Schools (suburban): math 29% / reading 40% proficiency, ranked #17 of 55 in WV (top 31%) — families likely to look elsewhere, expect single-tenant / working-renter base with shorter leases.
- Zoned schools: Nitro Elementary School (math 27% / reading 37%, grade F, #191 of 377 statewide, top 56%, 364 students, 0% FRL); Andrew Jackson Middle School (math 23% / reading 41%, grade F, #46 of 109 statewide, top 46%, 512 students, 0% FRL); Nitro High School (math 22% / reading 57%, grade F, #21 of 110 statewide, top 26%, 827 students, 0% FRL) — zoned schools average 0% FRL vs 46% district-wide (46 pts lower); this property's tenant base skews higher-income than the district average.
- Market conditions: 39 active listings in the ZIP; 103 units permitted in Kanawha County in 2024 (0 in 5+ unit buildings).
Forward outlook
- Local home prices are declining (-3.0%/yr); year-one equity from $795 of loan paydown is wiped out by about $3k of value loss. Plan a longer hold.
- Kanawha County population projected at -17% by 2050 — secular population decline; favor cash flow + early exit over multi-decade hold.
Negotiation context
- It's been on market 31 days — a 3% lower offer ($112k) is reasonable based on typical stale-listing flexibility.
- 3 sale attempts with the ask held roughly flat each time — persistent listings suggest the price (not the market) is what's stuck; bring a comps-based counter.
Risks & watch-outs
- Watch-outs: built in 1945 — expect roof / HVAC / electrical / plumbing capex.
- Climate carrying-cost: moderate wildfire risk; extreme-heat days projected 7→19/yr by 2055 (HVAC capex compounding) — expect insurance premiums to compound above CPI over the hold.
Questions for the listing agent
- It's been on market 31 days. Have you received any prior offers? Is the seller open to a 3% concession, seller financing, or rate buy-down credit?
- Built in 1945 — when were the roof, HVAC, electrical panel, plumbing, and water heater last replaced?
- Is there a deadline driving the sale (1031 exchange, divorce, estate, relocation)? That informs how much negotiation room exists.
- Schools are F-rated, which usually means shorter tenancies and higher turnover. Who's the typical renter profile here, and what's been the actual vacancy rate?
- What's the average days-on-market for RENTAL listings here right now (not sales)? A rising rental-DOM trend means longer vacancies and softer asking-rent achievability than the comps imply.
- What's the recent tenant-quality profile in this submarket — average credit score on applications, eviction rate, late-payment / NSF rate, and stable-employment percentage? A property-management company in the area should have these aggregated.
- How much new for-sale + rental construction is in the pipeline within 1–3 miles? Heavy new supply typically softens prices + rents 12–24 months out; constrained supply supports both.
Investment metrics
- 1% rule
- 1.03% ✓
- Cap rate
- 8.56%
- Cash-on-cash
- 8.10%
- DSCR
- 1.36
- GRM
- 8.1
CMA / ARV
- ARV (on-the-fly)
- $148,256
- Comps found
- 10
Show comp detail 10 sales within ~0.75 mi
| Address | Dist | Beds/Ba | Sqft | Sold | Price | $/sf | Match |
|---|---|---|---|---|---|---|---|
| 103 Bailes Dr | 0.38mi | 3/1.0 | 1,391 (+6%) | 2mo | $40,000 | $29 | 70 |
| 3981 39th St | 0.29mi | 3/1.0 | 1,184 (-10%) | 1mo | $166,000 | $140 | 69 |
| 3608 36th St | 0.67mi | 3/2.0 | 1,416 (+8%) | 1mo | $189,900 | $134 | 51 |
| 78 31st St E | 0.37mi | 2/1.0 (-1) | 1,230 (-6%) | 21mo | $102,000 | $83 | 50 |
| 2922 29th St | 0.70mi | 3/2.0 | 1,281 (-2%) | 20mo | $215,000 | $168 | 42 |
| 3814 38th St | 0.63mi | 2/1.0 (-1) | 1,267 (-3%) | 22mo | $125,000 | $99 | 42 |
| 3955 39th St E | 0.41mi | 3/1.5 | 1,493 (+14%) | 20mo | $175,000 | $117 | 40 |
| 3613 36th St | 0.63mi | 3/2.0 | 1,409 (+7%) | 21mo | $159,500 | $113 | 37 |
| 3415 34th St | 0.64mi | 3/2.0 | 1,483 (+13%) | 10mo | $118,000 | $80 | 36 |
| 21 Crest Dr | 0.74mi | 2/1.5 (-1) | 1,120 (-15%) | 18mo | $116,000 | $104 | 19 |
Match score weights: distance 35% · size 25% · config 20% · recency 20%. Top-matched comps best support the ARV.
Projected returns pro-forma
-3.0% appreciation · 3.0% rent growth · sell at horizon
- IRR
- -4.0%
- Equity multiple
- 0.85×
- Total profit
- $-4,825
- Equity at exit
- $17,147
- IRR
- 5.7%
- Equity multiple
- 1.42×
- Total profit
- $13,499
- Equity at exit
- $9,943
Cash invested: $32,200 (down + closing). Projections, not guarantees.
Landlord ↔ Tenant lean methodology
- Overall (STATE)
- 83 Strongly Landlord-Friendly
- State West Virginia
- 83 Strongly Landlord-Friendly · R+22
- County
- — inherits STATE
- City
- — inherits STATE
ZIP-level market 25143
- Home prices YoY
- -19.2%
- Active inventory
- 39
- Price-to-rent
- 8.1×
Monthly cashflow live
- Estimated rent
- $1,184 medium interval (Pro) →
- Mortgage (P&I)
- −$603
- Tax from tax record
- −$67 /mo · $802/yr
- Insurance
- −$48
- HOA
- −$0
- Vacancy / Maint / Mgmt
- −$249
- Net cashflow
- $217
Break-even live
Sensitivity live
| Price | -10% $282 | -5% $250 | +0% $217 | +5% $185 | +10% $152 |
|---|---|---|---|---|---|
| Rent | -10% $124 | -5% $171 | +0% $217 | +5% $264 | +10% $311 |
| Rate | -1.0pp $275 | -0.5pp $247 | base $217 | +0.5pp $187 | +1.0pp $157 |
UW: 25.0% down · 7.5% · 30yr · 1.5% tax · 5.0% vac · 8.0% maint · 8.0% mgmt
Financing live
Cash to close
- Down payment
- $28,750
- Closing costs
- $3,450
- Reserves months
- —
- Total cash needed
- —
Loan-product check · same deal, 3 products live
Conventional
25% down · 7.5% · 30yr
- Down + closing
- —
- Monthly P&I
- —
- Monthly cashflow
- —
- DSCR
- —
- Eligible?
- —
Personal DTI + credit; lowest rate.
DSCR
20% down · 8.5% · 30yr
- Down + closing
- —
- Monthly P&I
- —
- Monthly cashflow
- —
- DSCR
- —
- Eligible?
- —
No personal income docs; deal must DSCR.
Hard money
10% down · 12.0% · 12mo
- Down + closing
- —
- Monthly P&I
- —
- Monthly cashflow
- —
- DSCR
- —
- Eligible?
- —
Short-term bridge; refi at stabilization.
Listing history 21 events
-
2026-06-19days on market $115,000 Active 31 DOM
-
2026-06-18days on market $115,000 Active 30 DOM
-
2026-06-17days on market $115,000 Active 29 DOM
-
2026-06-16days on market $115,000 Active 28 DOM
-
2026-06-15days on market $115,000 Active 27 DOM
-
2026-06-14days on market $115,000 Active 25 DOM
-
2026-06-12days on market $115,000 Active 24 DOM
-
2026-06-09days on market $115,000 Active 21 DOM
-
2026-06-08days on market $115,000 Active 20 DOM
-
2026-06-07days on market $115,000 Active 19 DOM
-
2026-06-05days on market $115,000 Active 16 DOM
-
2026-06-03days on market $115,000 Active 15 DOM
-
2026-06-02days on market $115,000 Active 14 DOM
-
2026-06-01days on market $115,000 Active 13 DOM
-
2026-05-31days on market $115,000 Active 12 DOM
-
2026-05-30days on market $115,000 Active 11 DOM
-
2026-05-22status Active
-
2026-04-24status Pending
-
2026-04-20$115,000 Active
-
2026-03-23price $115,000
-
2026-02-24$150,000 Active
ⓘ Source: listings_history table (triggers on properties + properties_extension) + one-shot
backfill from property_details.listing_events for pre-trigger history.
Tax reassessment forecast WV · Resets to sale price
- Current annual tax
- $802 · $67/mo
- Projected year-2 tax
- $802 · $67/mo
- Expected delta
- $0/yr ($0/mo · 0.0%)
ⓘ Screening estimate from a state-policy table — verify with the county assessor before closing.
Climate risk First Street
- Flood 1/10 Low FEMA zone X (unshaded) · 0% chance over 30 yrs
- Wildfire 5/10 Major
- Heat 5/10 Major 7 d/yr ≥101°F today · 19 d/yr by 30 yrs out
- Wind 2/10 Low 100% chance of damaging wind over 30 yrs
- Air quality 2/10 Low 0 unhealthy d/yr today · 1 by 30 yrs out
Nearby sold comps map
Loading sold comps map…
Walkable amenities ~0.75 mi
Loading nearby amenities…
Taxation est. · year 1
- Rental income
- $14,204
- − Mortgage interest
- −$6,442
- − Property taxes
- −$802
- − Insurance
- −$575
- − Repairs & maintenance
- −$1,136
- − Management
- −$1,136
- − Depreciation
- −$3,345
- Taxable income
- $767
- Est. tax owed @ 24.0%
- −$184
- After-tax cash flow
- $2,423/yr
For passive investors: Depreciation is non-cash, so a rental often shows a tax loss while cash-flowing — sheltering income. Rental losses are passive: they offset passive income freely, and up to $25,000/yr can offset ordinary (W-2) income if you actively participate and your MAGI is under $100k (phasing out to $0 by $150k); unused losses carry forward. On sale, claimed depreciation is recaptured at up to 25%, and gains may owe capital-gains tax (a 1031 exchange can defer both). Figures are a year-1 estimate at your 24.0% rate — not tax advice; consult a CPA.
Schools (NCES district)
- District
- Kanawha County Schools
- NCES district ID
- 5400600
- Math proficiency
- 29% ▼ -13.00%
- Reading proficiency
- 40% ▼ -7.00%
- Median HH income
- $44,329
- Composite
- 29.35/100
- National rank
- #6540
- State rank
- #17 of 55 in WV
Livability — Nitro
- Score
- 67/100
- State rank
- #97
- US rank
- #10940
Category grades
Schools grade is shown separately in the Schools card above.
Census & demographics
- Census place
- Nitro, WV
- Population (ZIP)
- 9,185
Population outlook (Kanawha County) Hauer SSP2
- Today (2025)
- 178,946 people
- By 2030
- 172,906 · -3.4%
- By 2040
- 159,874 · -10.7%
- By 2050
- 148,148 · -17.2%
- By 2075
- 123,257 · -31.1%
- By 2100
- 96,454 · -46.1%
Race, ethnicity, and origin ACS 2023
- Neighborhood character
- Predominantly White (90%)
- Race & ethnicity
- White 90% Two or more races 8% Hispanic / Latino 1% Black 1%
- Common ancestry
- Italian 3% Serbian 2% Slovak 2%
- Foreign-born
- 0%
- Languages at home
- 99% English-only · French/Haitian/Cajun 1% Other Indo-European 1%
Political lean MEDSL · Kanawha
- 2024 margin
- R (+17.4) · D 40.2% · R 57.6% · Other 2.2%
- 2008→2024 swing
- -17.0pp toward R · 2008: -0.4pp · 2024: -17.4pp
- All cycles
- 2024: R+17.4 2020: R+14.7 2016: R+20.6 2012: R+11.9 2008: R+0.4
Not yet ingested
- Civics
- —
Market trends
- HPI YoY
- ▼ -48.75%
- Current HPI
- 205.6038
- Rent YoY
- —
- Metro
- —
- State GDP YoY
- —
- F500 in state
- 0
Price history
-23.3% since first listed5 events — show timeline
- 2026-05-22 Relisted — KVBOR
- 2026-04-24 Pending — KVBOR
- 2026-04-20 Listed $115,000 KVBOR
- 2026-03-23 Price Changed $115,000 KVBOR
- 2026-02-24 Listed $150,000 KVBOR
Property tax history
+2.2%/yrLatest (2025): $802 · -0.3% YoY. Source: county tax records.
Cash-flow waterfall
monthlySold comps — $/sqft
last 12 mo · ≤1 miLoading sold comps…