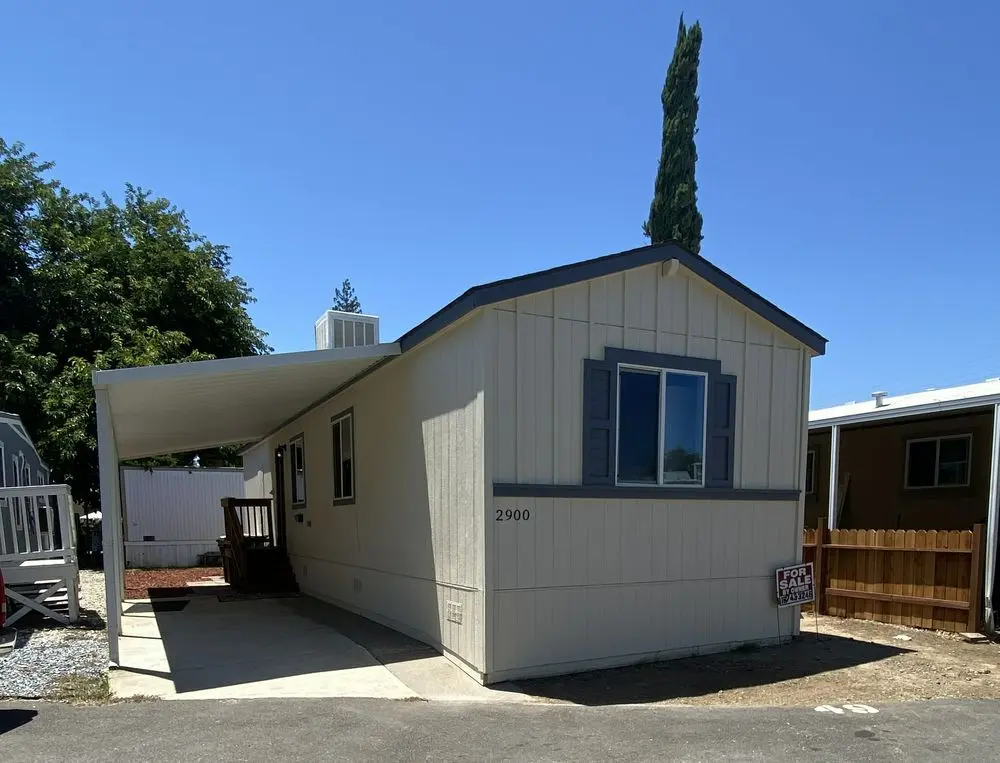
2900 Twilley Dr · Rancho Cordova, CA
Flood risk 1/10 · Minimal
- FEMA flood zone
- X (unshaded)
- Chance of flooding over 30 yrs
- 0.0%
- Est. flood insurance / yr
- $507 – $1,088
Fire risk 5/10 · Moderate
- Est. fire insurance / yr
- $659 – $1,223
Heat risk 7/10 · Major
- Hot days now (above 102°F)
- 7 days/yr
- Hot days in 30 yrs
- 15 days/yr
Wind risk 1/10 · Minimal
- Chance of severe wind over 30 yrs
- —
Air-quality risk 10/10 · Severe
- Unhealthy air days now
- 33 days/yr
- Unhealthy air days in 30 yrs
- 35 days/yr
Risk factors via First Street. Map © Google.
Why this score? — see what drove the B- grade
The composite is a weighted blend of 9 inputs, each scored 0–100. Each bar is that input's sub-score; the figure is the points it added to the 100-point composite (weight × sub-score).
- Cash flow +30.0/30.0
- 1% rule +10.0/10.0
- DSCR +10.0/10.0
- ARV discount +7.5/15.0
- Schools +3.5/10.0
- Livability +3.4/5.0
- Rent growth +3.1/5.0
- Condition / age +2.5/5.0
- Appreciation +0.0/10.0
$89,999
🖨 Deal sheet 📄 Offer letter ✓ Due diligence
Listing remarks
Charming and fully remodeled 2-bedroom, 1-bath manufactured home located in the desirable Park Royal Estates family community. Built in 2018 and thoughtfully refreshed, this home is truly move-in ready with modern upgrades throughout. Home Features: Built in 2018 2 Bedrooms / 1 Bathroom Fresh paint inside and out Waterproof vinyl flooring throughout Dual-pane windows for energy efficiency Ceiling fans for added comfort Central heat & evaporative cooler Updated Kitchen: Granite countertops Updated cabinets Brand new gas stove Double sink with garbage disposal Vent hood/fan New appliances Bathroom Upgrades: New sink and countertop Modern fixtures and finishes Extras: Washer & d
Key facts
- Dual-pane windows
- New appliances
- Updated kitchen
Tags
Property features AI
Exterior
- Home design: House
- Construction: 705 total living area (square footage)
- Exterior features: 0.1-acre lot
Neighborhood map
What this means for you Summary
Snapshot
- This is a 2-bed/1.0-bath manufactured listed at $90k.
Deal economics
- At list price, monthly cash flow is $655 ($8k/yr) — positive.
- The deal already cash-flows at list — no discount required.
- Meets the 1% rule at list price ($2k rent vs $90k).
- Cap rate 15.0% vs local median 3.0% in Rancho Cordova — top-decile yield for the area; either an underpriced asset or a hidden risk that comps aren't pricing in. Stress-test before assuming the spread holds.
Location & tenants
- Location reads 68/100 on livability (#268 in CA) — a middle-class / working-renter tenant base. Strengths: housing A+, employment B; Watch: schools C-, commute C-, crime D.
- Sacramento City Unified (urban): math 32% / reading 43% proficiency, ranked #804 of 1,400 in CA (top 57%) — families likely to look elsewhere, expect single-tenant / working-renter base with shorter leases; 63% free/reduced lunch — lower-income household profile, screen leases tightly.
- Market conditions: Rents rising (+2.4%/yr); 109 active listings in the ZIP; 19 comparable units currently listed for rent nearby; rentals leasing fast (median 13d on market — plan ~1-2 weeks tenant-placement turnaround); solid renter incomes; 6,825 units permitted in Sacramento County in 2024 (1,752 in 5+ unit buildings).
Forward outlook
- Local home prices are declining (-3.0%/yr); year-one equity from $622 of loan paydown is wiped out by about $3k of value loss. Plan a longer hold.
- Sacramento County population projected at +17% by 2050 — long-run rental-demand tailwind backs the buy-and-hold thesis.
- At projected returns (-3.0% appreciation + 2.4% rent growth), your $25k cash investment doubles in ~4 years — after that, you're playing with house money.
Negotiation context
- Only 14 days on market — expect competitive offers; lowballing is unlikely to land.
Risks & watch-outs
- Climate carrying-cost: moderate wildfire risk; extreme-heat days projected 7→15/yr by 2055 (HVAC capex compounding) — expect insurance premiums to compound above CPI over the hold.
Questions for the listing agent
- Is there a deadline driving the sale (1031 exchange, divorce, estate, relocation)? That informs how much negotiation room exists.
- Crime grade is D in this area — have there been break-ins, vandalism, or insurance claims at this property in the last 3 years? What carrier currently insures it and at what premium?
- What's the average days-on-market for RENTAL listings here right now (not sales)? A rising rental-DOM trend means longer vacancies and softer asking-rent achievability than the comps imply.
- What's the recent tenant-quality profile in this submarket — average credit score on applications, eviction rate, late-payment / NSF rate, and stable-employment percentage? A property-management company in the area should have these aggregated.
- How much new for-sale + rental construction is in the pipeline within 1–3 miles? Heavy new supply typically softens prices + rents 12–24 months out; constrained supply supports both.
Investment metrics
- 1% rule
- 1.80% ✓
- Cap rate
- 15.03%
- Cash-on-cash
- 31.19%
- DSCR
- 2.39
- GRM
- 4.6
CMA / ARV
- ARV (on-the-fly)
- $59,925
- Comps found
- 11
Show comp detail 11 sales within ~0.75 mi
| Address | Dist | Beds/Ba | Sqft | Sold | Price | $/sf | Match |
|---|---|---|---|---|---|---|---|
| 2904 Poole Dr | 0.02mi | 2/1.0 | 697 (-1%) | 3mo | $55,000 | $79 | 94 |
| 2901 Twilley Dr #40 | 0.01mi | 2/1.5 | 672 (-5%) | 9mo | $79,500 | $118 | 82 |
| 10035 Mills Station Rd #71 | 0.30mi | 2/1.0 | 720 (+2%) | 4mo | $34,500 | $48 | 79 |
| 2926 Poole Dr #25 | 0.05mi | 2/2.0 | 756 (+7%) | 5mo | $64,000 | $85 | 78 |
| 10035 Mills Station Rd #60 | 0.35mi | 2/1.0 | 720 (+2%) | 7mo | $78,000 | $108 | 74 |
| 10035 Mills Station Rd #39 | 0.35mi | 2/1.0 | 720 (+2%) | 9mo | $60,000 | $83 | 73 |
| 10035 Mills Station Rd #157 | 0.35mi | 2/1.0 | 720 (+2%) | 10mo | $65,000 | $90 | 72 |
| 2902 Routier Rd #7 | 0.08mi | 2/1.5 | 784 (+11%) | 7mo | $90,000 | $115 | 70 |
| 10035 Mills Station Rd #11 | 0.35mi | 2/1.0 | 684 (-3%) | 10mo | $92,500 | $135 | 70 |
| 10035 Mills Station Rd #122 | 0.31mi | 2/1.0 | 720 (+2%) | 15mo | $46,500 | $65 | 70 |
| 2905 Weikert Dr | 0.06mi | 2/1.0 | 604 (-14%) | 11mo | $29,000 | $48 | 64 |
Match score weights: distance 35% · size 25% · config 20% · recency 20%. Top-matched comps best support the ARV.
Projected returns pro-forma
-3.0% appreciation · 2.41% rent growth · sell at horizon
- IRR
- 25.4%
- Equity multiple
- 2.04×
- Total profit
- $26,202
- Equity at exit
- $13,419
- IRR
- 32.7%
- Equity multiple
- 3.89×
- Total profit
- $72,761
- Equity at exit
- $7,781
Cash invested: $25,200 (down + closing). Projections, not guarantees.
Landlord ↔ Tenant lean methodology
- Overall (STATE)
- 18 Strongly Tenant-Friendly
- State California
- 18 Strongly Tenant-Friendly · D+13
- County
- — inherits STATE
- City
- — inherits STATE
ZIP-level market 95827
- Rents YoY
- 2.4%
- Active inventory
- 109
- Price-to-rent
- 4.6×
Monthly cashflow live
- Estimated rent
- $1,616 high interval (Pro) →
- Mortgage (P&I)
- −$472
- Tax est. 1.5%
- −$112 /mo · $1,350/yr
- Insurance
- −$37
- HOA
- −$0
- Vacancy / Maint / Mgmt
- −$339
- Net cashflow
- $655
Break-even live
UW: 25.0% down · 7.5% · 30yr · 1.5% tax · 5.0% vac · 8.0% maint · 8.0% mgmt
Financing live
Cash to close
- Down payment
- $22,500
- Closing costs
- $2,700
- Reserves months
- —
- Total cash needed
- —
Loan-product check · same deal, 3 products live
Conventional
25% down · 7.5% · 30yr
- Down + closing
- —
- Monthly P&I
- —
- Monthly cashflow
- —
- DSCR
- —
- Eligible?
- —
Personal DTI + credit; lowest rate.
DSCR
20% down · 8.5% · 30yr
- Down + closing
- —
- Monthly P&I
- —
- Monthly cashflow
- —
- DSCR
- —
- Eligible?
- —
No personal income docs; deal must DSCR.
Hard money
10% down · 12.0% · 12mo
- Down + closing
- —
- Monthly P&I
- —
- Monthly cashflow
- —
- DSCR
- —
- Eligible?
- —
Short-term bridge; refi at stabilization.
Rent comps 19 comps
| Address | Beds | Baths | Sqft | Rent | $/sqft | DOM | Units | Dist |
|---|---|---|---|---|---|---|---|---|
| 2929 Routier Rd Sacramento, CA | 1.0–2.0 | 1.0–2.0 | 790 | $1,995 | $2.53 | 2d | 15 | 0.16mi |
| 2080 W La Loma Dr Rancho Cordova, CA | 1.0 | 1.0 | 587 | $1,395 | $2.37 | 43d | 2 | 0.24mi |
| 2080 W La Loma Dr Rancho Cordova, CA | 1.0–2.0 | 1.0 | 650 | $1,645 | $2.53 | 17d | 3 | 0.24mi |
| 2590 Capitales Dr Rancho Cordova, CA | 1.0 | 1.0 | 559 | $1,495 | $2.67 | 20d | 2 | 0.37mi |
| 2590 Capitales Dr Rancho Cordova, CA | 1.0 | 1.0 | 559 | $1,495 | $2.67 | 12d | 1 | 0.37mi |
| 2590 Capitales Dr Rancho Cordova, CA | 1.0 | 1.0 | 559 | $1,495 | $2.67 | 14d | 1 | 0.37mi |
| 2729 El Parque Cir Unit 3 Rancho Cordova, CA | 1.0 | 1.0 | 600 | $1,350 | $2.25 | 23d | 1 | 0.37mi |
| 10108 Malaga Way Rancho Cordova, CA | 2.0 | 1.0 | 765 | $1,776 | $2.32 | 7d | 1 | 0.55mi |
| 10335 White Rock Rd Rancho Cordova, CA | 1.0–2.0 | 1.0 | 625 | $1,450 | $2.32 | 10d | 2 | 0.84mi |
| 10401 Rockingham Dr Rancho Cordova, CA | 1.0–2.0 | 1.0 | 714 | $1,450 | $2.03 | 7d | 6 | 0.91mi |
| 10421 El Mercado Dr Rancho Cordova, CA | 1.0–2.0 | 1.0 | 702 | $1,651 | $2.35 | 1d | 1 | 1.04mi |
| 2416 Moraine Cir Rancho Cordova, CA | 1.0 | 1.0 | 710 | $1,188 | $1.67 | 16d | 2 | 1.13mi |
| 3060 Laurelhurst Dr Rancho Cordova, CA | 1.0 | 1.0 | 650 | $1,395 | $2.15 | 43d | 1 | 1.14mi |
| 10460 El Mercado Dr Rancho Cordova, CA | 1.0 | 1.0 | 626 | $1,295 | $2.07 | 1d | 1 | 1.15mi |
| 3545 Mather Field Rd Rancho Cordova, CA | 2.0 | 1.0 | 604 | $1,775 | $2.94 | 1d | 5 | 1.21mi |
| 9838 Lincoln Village Dr Sacramento, CA | 1.0–2.0 | 1.0–2.0 | 732 | $1,601 | $2.19 | 3d | 8 | 1.40mi |
| 10515 Mills Tower Dr Rancho Cordova, CA | 1.0–2.0 | 1.0 | 665 | $1,495 | $2.25 | 10d | 1 | 1.40mi |
| 9830 Lincoln Village Dr Sacramento, CA | 1.0 | 1.0 | 500 | $1,298 | $2.60 | 14d | 1 | 1.42mi |
| 2830 Mills Park Dr Rancho Cordova, CA | 1.0–2.0 | 1.0 | 712 | $1,525 | $2.14 | 23d | 5 | 1.49mi |
Listing history 11 events
-
2026-06-18days on market $89,999 Active 14 DOM
-
2026-06-17days on market $89,999 Active 13 DOM
-
2026-06-16days on market $89,999 Active 12 DOM
-
2026-06-15days on market $89,999 Active 11 DOM
-
2026-06-13days on market $89,999 Active 9 DOM
-
2026-06-13days on market $89,999 Active 8 DOM
-
2026-06-09days on market $89,999 Active 5 DOM
-
2026-06-08days on market $89,999 Active 4 DOM
-
2026-06-07days on market $89,999 Active 3 DOM
-
2026-06-05remarks 691-char remark
-
2026-06-05$89,999 Active 1 DOM
ⓘ Source: listings_history table (triggers on properties + properties_extension) + one-shot
backfill from property_details.listing_events for pre-trigger history.
Climate risk First Street
- Flood 1/10 Low FEMA zone X (unshaded) · 0% chance over 30 yrs
- Wildfire 5/10 Major
- Heat 7/10 Severe 7 d/yr ≥102°F today · 15 d/yr by 30 yrs out
- Wind 1/10 Low
- Air quality 10/10 Extreme 33 unhealthy d/yr today · 35 by 30 yrs out
Nearby sold comps map
Loading sold comps map…
Walkable amenities ~0.75 mi
Loading nearby amenities…
Taxation est. · year 1
- Rental income
- $19,396
- − Mortgage interest
- −$5,041
- − Property taxes
- −$1,350
- − Insurance
- −$450
- − Repairs & maintenance
- −$1,552
- − Management
- −$1,552
- − Depreciation
- −$2,618
- Taxable income
- $6,833
- Est. tax owed @ 24.0%
- −$1,640
- After-tax cash flow
- $6,220/yr
For passive investors: Depreciation is non-cash, so a rental often shows a tax loss while cash-flowing — sheltering income. Rental losses are passive: they offset passive income freely, and up to $25,000/yr can offset ordinary (W-2) income if you actively participate and your MAGI is under $100k (phasing out to $0 by $150k); unused losses carry forward. On sale, claimed depreciation is recaptured at up to 25%, and gains may owe capital-gains tax (a 1031 exchange can defer both). Figures are a year-1 estimate at your 24.0% rate — not tax advice; consult a CPA.
Schools (NCES district)
- District
- Sacramento City Unified
- NCES district ID
- 0633840
- Math proficiency
- 32% ▬ 0.00%
- Reading proficiency
- 43% ▲ 3.00%
- Median HH income
- $49,280
- Composite
- 34.86/100
- National rank
- #10000
- State rank
- #804 of 1400 in CA
Livability — Rancho Cordova
- Score
- 68/100
- State rank
- #268
- US rank
- #9126
Category grades
Schools grade is shown separately in the Schools card above.
Census & demographics
- Census place
- Rancho Cordova, CA
- County
- Sacramento County · 1,539,646 people
- City population
- 98,329
- Metro
- Sacramento-Roseville-Folsom, CA
- Population (ZIP)
- 21,742
- Household income
- $85,841
- Rent vs Own
- Severe rent burden
- 949.0
Population outlook (Sacramento County) Hauer SSP2
- Today (2025)
- 1,660,763 people
- By 2030
- 1,732,990 · +4.3%
- By 2040
- 1,855,755 · +11.7%
- By 2050
- 1,941,335 · +16.9%
- By 2075
- 2,046,162 · +23.2%
- By 2100
- 1,961,444 · +18.1%
Race, ethnicity, and origin ACS 2023
- Neighborhood character
- Diverse neighborhood (Simpson 0.69)
- Race & ethnicity
- White 47% Hispanic / Latino 24% Black 13% Two or more races 12% Asian 10% Native American 1%
- Hispanic origin (detail)
- Mexican 19%
- Common ancestry
- Subsaharan African 5% Italian 2% Scotch-Irish 2%
- Foreign-born
- 22% · Canada, Vietnam, South Korea
- Languages at home
- 67% English-only · Spanish 14% Russian/Polish/Slavic 10% Other Indo-European 3%
Political lean MEDSL · Sacramento
- 2024 margin
- D (+19.7) · D 58.1% · R 38.4% · Other 3.5%
- 2008→2024 swing
- +0.7pp no change · 2008: 19.0pp · 2024: 19.7pp
- All cycles
- 2024: D+19.7 2020: D+25.3 2016: D+23.7 2012: D+16.3 2008: D+19.0
Not yet ingested
- Civics
- —
Market trends
- HPI YoY
- ▼ -223.22%
- Current HPI
- 349.4168
- Rent YoY
- ▲ 2.41%
- Metro
- Sacramento-Roseville-Folsom, CA
- State GDP YoY
- ▲ 3.21%
- F500 in state
- 116
Industry mix (Fortune 500 HQ in CA)
| Industry | F500 HQs | Revenue |
|---|---|---|
| Technology | 27 | $1,492B |
|
||
| Financial Services | 3 | $174B |
|
||
| Retail | 3 | $44B |
|
||
| Insurance | 3 | $26B |
|
||
| Media / Entertainment | 2 | $115B |
|
||
| Pharmaceuticals / Biotech | 2 | $62B |
|
||
Price history
1 event — show timeline
- 2026-06-04 Listed $89,999 ForSaleByOwner.com
Cash-flow waterfall
monthlySold comps — $/sqft
last 12 mo · ≤1 miLoading sold comps…