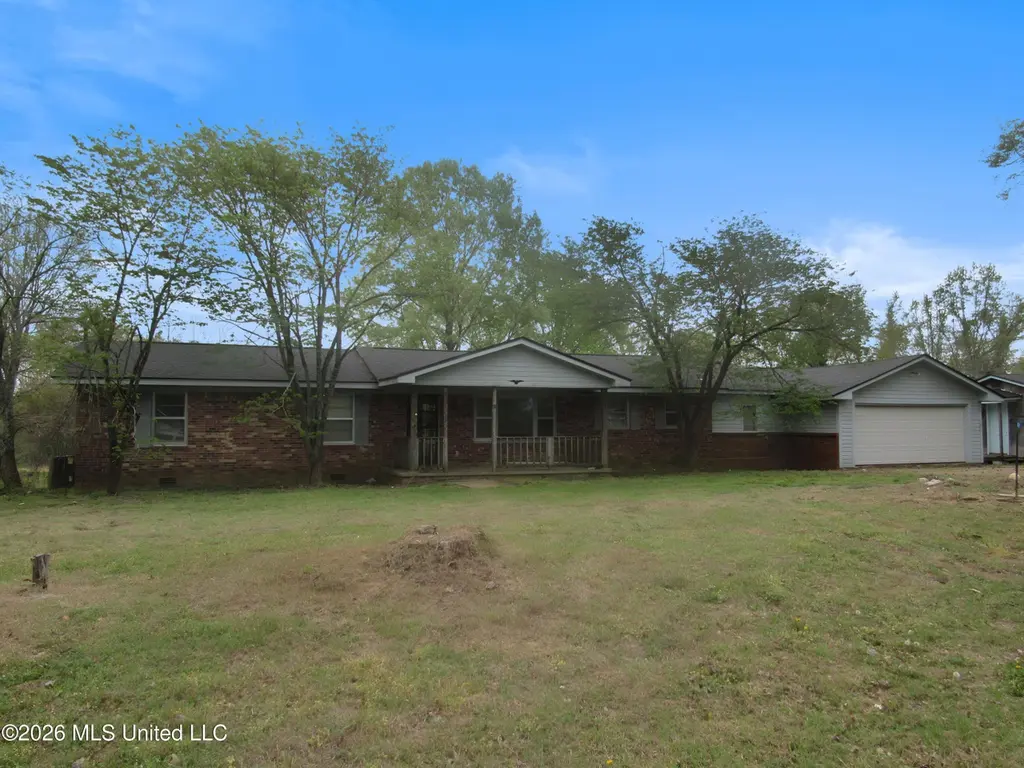
461 Cypress Corner Rd · Senatobia, MS
Flood risk 1/10 · Minimal
- FEMA flood zone
- X (unshaded)
- Chance of flooding over 30 yrs
- 0.0%
- Est. flood insurance / yr
- $507 – $1,088
Fire risk 5/10 · Moderate
- Est. fire insurance / yr
- $1,241 – $2,305
Heat risk 6/10 · Moderate
- Hot days now (above 108°F)
- 7 days/yr
- Hot days in 30 yrs
- 21 days/yr
Wind risk 4/10 · Minor
- Chance of severe wind over 30 yrs
- 23.0%
Air-quality risk 2/10 · Minimal
- Unhealthy air days now
- 1 days/yr
- Unhealthy air days in 30 yrs
- 1 days/yr
Risk factors via First Street. Map © Google.
Why this score? — see what drove the C- grade
The composite is a weighted blend of 9 inputs, each scored 0–100. Each bar is that input's sub-score; the figure is the points it added to the 100-point composite (weight × sub-score).
- Cash flow +16.0/30.0
- ARV discount +15.0/15.0
- DSCR +5.0/10.0
- 1% rule +3.6/10.0
- Livability +3.2/5.0
- Rent growth +2.5/5.0
- Condition / age +2.5/5.0
- Schools +2.3/10.0
- Appreciation +0.0/10.0
$164,900
🖨 Deal sheet 📄 Offer letter ✓ Due diligence
Listing remarks MLS
2,069 sf 3 bedroom, 2 bath home sitting on 7.7 acres of land located in the Strayhorn School District. Large eat in kitchen w/breakfast bar. Gas logs in the great room. Large sunroom. Covered front porch and back wooden deck. Attached 2 car garage, storage shed and tractor shed. Small stocked pond on the property. Long road frontage which will make it easy to divide the property into multiple tracts.
Key facts
- 7.7 acre lot
- 2 garage spots
- Built 1949
Property features AI
Finance
- Other: Property listed as fixer; Lot approximately 7.7 acres
Exterior
- Parking: Attached 2-car garage; Total parking for 2 vehicles
- Utilities: Public water; Septic tank; Electricity connected; Propane available; Sewer connected; Water connected
- Home design: Single-family house; One level
- Construction: Vinyl and brick exterior; Architectural shingle roof; Conventional foundation; Built (year source: assessor)
- Exterior features: Front porch; Workshop; Many trees on the lot
Interior
- Kitchen: Dishwasher; Electric range; Kitchen on main level (approx. 14x18)
- Bedrooms: Three main-level bedrooms (approx. 11x13, 11x13, 13x13)
- Flooring: Carpet; Hardwood; Tile; Vinyl
- Bathrooms: Two full bathrooms
- Heating & cooling: Central heating (electric); Central air; Ceiling fans for cooling
- Interior features: Breakfast bar; Ceiling fans; Fireplace in den; Sunroom; Eight total rooms
- Laundry & utility: Laundry room with washer and electric dryer hookups
Neighborhood map
What this means for you Summary
Snapshot
- This is a 3-bed/2.0-bath single-family listed at $165k.
Deal economics
- At list price, monthly cash flow is $83 ($995/yr) — positive.
- The deal already cash-flows at list — no discount required.
- To meet the 1% rule (rent ≥ 1% of price), the offer needs to be $142k (13.7% below list).
- Recommended offer: $142k (13.7% below list) — sets the bar for 1% rule.
- Cap rate 6.9% vs local median 2.9% in Senatobia — top-decile yield for the area; either an underpriced asset or a hidden risk that comps aren't pricing in. Stress-test before assuming the spread holds.
Location & tenants
- Location reads 64/100 on livability (#130 in MS) — a middle-class / working-renter tenant base. Strengths: cost of living A+, housing A+; Watch: amenities F, commute F, health & safety F.
- Tate County School District (rural): math 28% / reading 27% proficiency, ranked #74 of 130 in MS (top 57%) — low school quality limits family demand, transient renter base, plan for 1-2y turnover; 69% free/reduced lunch — lower-income household profile, screen leases tightly.
- Zoned schools: Strayhorn Elementary School (math 34% / reading 37%, grade F, #150 of 375 statewide, top 40%, 406 students, 99% FRL); Strayhorn High School (math 32% / reading 32%, grade F, #80 of 197 statewide, top 42%, 309 students, 99% FRL) — zoned schools average 99% FRL vs 69% district-wide (30 pts higher); higher-poverty schools than district average — tighter screening recommended.
- Market conditions: 117 active listings in the ZIP; 114 units permitted in Tate County in 2024 (0 in 5+ unit buildings).
Forward outlook
- Local home prices are declining (-3.0%/yr); year-one equity from $1k of loan paydown is wiped out by about $5k of value loss. Plan a longer hold.
- Tate County population projected at -14% by 2050 — secular population decline; favor cash flow + early exit over multi-decade hold.
Negotiation context
- It's been on market 35 days — a 3% lower offer ($160k) is reasonable based on typical stale-listing flexibility.
- 3 sale attempts since 5y ago with the ask held roughly flat each time — persistent listings suggest the price (not the market) is what's stuck; bring a comps-based counter.
Risks & watch-outs
- Watch-outs: built in 1949 — expect roof / HVAC / electrical / plumbing capex.
- Climate carrying-cost: moderate wildfire risk; extreme-heat days projected 7→21/yr by 2055 (HVAC capex compounding) — expect insurance premiums to compound above CPI over the hold.
Questions for the listing agent
- It's been on market 35 days. Have you received any prior offers? Is the seller open to a 14% concession, seller financing, or rate buy-down credit?
- Built in 1949 — when were the roof, HVAC, electrical panel, plumbing, and water heater last replaced?
- Is there a deadline driving the sale (1031 exchange, divorce, estate, relocation)? That informs how much negotiation room exists.
- Schools are D-rated, which usually means shorter tenancies and higher turnover. Who's the typical renter profile here, and what's been the actual vacancy rate?
- What's the average days-on-market for RENTAL listings here right now (not sales)? A rising rental-DOM trend means longer vacancies and softer asking-rent achievability than the comps imply.
- What's the recent tenant-quality profile in this submarket — average credit score on applications, eviction rate, late-payment / NSF rate, and stable-employment percentage? A property-management company in the area should have these aggregated.
- How much new for-sale + rental construction is in the pipeline within 1–3 miles? Heavy new supply typically softens prices + rents 12–24 months out; constrained supply supports both.
Investment metrics
- 1% rule
- 0.86% ✗
- Cap rate
- 6.90%
- Cash-on-cash
- 2.16%
- DSCR
- 1.10
- GRM
- 9.7
CMA / ARV
- ARV (median comp)
- $288,725
- List price
- $164,900
- Delta
- -42.89%
- Verdict
- UNDERPRICED
- Comps
- 1 within 2.0 mi
Projected returns pro-forma
-3.0% appreciation · 3.0% rent growth · sell at horizon
- IRR
- -12.9%
- Equity multiple
- 0.53×
- Total profit
- $-21,477
- Equity at exit
- $24,587
- IRR
- -3.9%
- Equity multiple
- 0.74×
- Total profit
- $-12,057
- Equity at exit
- $14,258
Cash invested: $46,172 (down + closing). Projections, not guarantees.
Landlord ↔ Tenant lean methodology
- Overall (STATE)
- 90 Strongly Landlord-Friendly
- State Mississippi
- 90 Strongly Landlord-Friendly · R+11
- County
- — inherits STATE
- City
- — inherits STATE
ZIP-level market 38668
- Home prices YoY
- -13.8%
- Active inventory
- 117
- Price-to-rent
- 9.7×
Monthly cashflow live
- Estimated rent
- $1,424 medium interval (Pro) →
- Mortgage (P&I)
- −$865
- Tax from tax record
- −$108 /mo · $1,301/yr
- Insurance
- −$69
- HOA
- −$0
- Vacancy / Maint / Mgmt
- −$299
- Net cashflow
- $83
Break-even live
UW: 25.0% down · 7.5% · 30yr · 1.5% tax · 5.0% vac · 8.0% maint · 8.0% mgmt
Financing live
Cash to close
- Down payment
- $41,225
- Closing costs
- $4,947
- Reserves months
- —
- Total cash needed
- —
Loan-product check · same deal, 3 products live
Conventional
25% down · 7.5% · 30yr
- Down + closing
- —
- Monthly P&I
- —
- Monthly cashflow
- —
- DSCR
- —
- Eligible?
- —
Personal DTI + credit; lowest rate.
DSCR
20% down · 8.5% · 30yr
- Down + closing
- —
- Monthly P&I
- —
- Monthly cashflow
- —
- DSCR
- —
- Eligible?
- —
No personal income docs; deal must DSCR.
Hard money
10% down · 12.0% · 12mo
- Down + closing
- —
- Monthly P&I
- —
- Monthly cashflow
- —
- DSCR
- —
- Eligible?
- —
Short-term bridge; refi at stabilization.
Listing history 23 events
-
2026-06-18days on market $164,900 Active 35 DOM
-
2026-06-17days on market $164,900 Active 34 DOM
-
2026-06-16days on market $164,900 Active 33 DOM
-
2026-06-15days on market $164,900 Active 32 DOM
-
2026-06-13days on market $164,900 Active 30 DOM
-
2026-06-13days on market $164,900 Active 29 DOM
-
2026-06-10days on market $164,900 Active 27 DOM
-
2026-06-09days on market $164,900 Active 26 DOM
-
2026-06-08days on market $164,900 Active 25 DOM
-
2026-06-07days on market $164,900 Active 24 DOM
-
2026-06-05days on market $164,900 Active 21 DOM
-
2026-06-03days on market $164,900 Active 20 DOM
-
2026-06-02days on market $164,900 Active 19 DOM
-
2026-06-01days on market $164,900 Active 18 DOM
-
2026-05-31days on market $164,900 Active 17 DOM
-
2026-05-13$164,900 Active 373-char remark
-
2026-02-27historical
-
2025-10-16$215,000 Active
-
2021-11-30soldstatus Closed
Show marketing remark (403 chars)
2,069 sf 3 bedroom, 2 bath home sitting on 7.7 acres of land located in the Strayhorn School District. Large eat in kitchen w/breakfast bar. Gas logs in the great room. Large sunroom. Covered front porch and back wooden deck. Attached 2 car garage, storage shed and tractor shed. Small stocked pond on the property. Long road frontage which will make it easy to divide the property into multiple tracts.
-
2021-11-30soldstatus
Show marketing remark (403 chars)
2,069 sf 3 bedroom, 2 bath home sitting on 7.7 acres of land located in the Strayhorn School District. Large eat in kitchen w/breakfast bar. Gas logs in the great room. Large sunroom. Covered front porch and back wooden deck. Attached 2 car garage, storage shed and tractor shed. Small stocked pond on the property. Long road frontage which will make it easy to divide the property into multiple tracts.
-
2021-10-15historical
Show marketing remark (403 chars)
2,069 sf 3 bedroom, 2 bath home sitting on 7.7 acres of land located in the Strayhorn School District. Large eat in kitchen w/breakfast bar. Gas logs in the great room. Large sunroom. Covered front porch and back wooden deck. Attached 2 car garage, storage shed and tractor shed. Small stocked pond on the property. Long road frontage which will make it easy to divide the property into multiple tracts.
-
2021-09-27$229,000
Show marketing remark (403 chars)
2,069 sf 3 bedroom, 2 bath home sitting on 7.7 acres of land located in the Strayhorn School District. Large eat in kitchen w/breakfast bar. Gas logs in the great room. Large sunroom. Covered front porch and back wooden deck. Attached 2 car garage, storage shed and tractor shed. Small stocked pond on the property. Long road frontage which will make it easy to divide the property into multiple tracts.
-
1959-10-15soldstatus
ⓘ Source: listings_history table (triggers on properties + properties_extension) + one-shot
backfill from property_details.listing_events for pre-trigger history.
Tax reassessment forecast MS · Resets to sale price
- Current annual tax
- $1,301 · $108/mo
- Projected year-2 tax
- $1,303 · $109/mo
- Expected delta
- +$2/yr ($0/mo · 0.2%)
ⓘ Screening estimate from a state-policy table — verify with the county assessor before closing.
Climate risk First Street
- Flood 1/10 Low FEMA zone X (unshaded) · 0% chance over 30 yrs
- Wildfire 5/10 Major
- Heat 6/10 Major 7 d/yr ≥108°F today · 21 d/yr by 30 yrs out
- Wind 4/10 Moderate 23% chance of damaging wind over 30 yrs
- Air quality 2/10 Low 1 unhealthy d/yr today · 1 by 30 yrs out
Nearby sold comps map
Loading sold comps map…
Walkable amenities ~0.75 mi
Loading nearby amenities…
Taxation est. · year 1
- Rental income
- $17,085
- − Mortgage interest
- −$9,237
- − Property taxes
- −$1,301
- − Insurance
- −$824
- − Repairs & maintenance
- −$1,367
- − Management
- −$1,367
- − Depreciation
- −$4,797
- Taxable loss
- −$1,808
- Est. tax savings @ 24.0%
- +$434
- After-tax cash flow
- $1,429/yr
For passive investors: Depreciation is non-cash, so a rental often shows a tax loss while cash-flowing — sheltering income. Rental losses are passive: they offset passive income freely, and up to $25,000/yr can offset ordinary (W-2) income if you actively participate and your MAGI is under $100k (phasing out to $0 by $150k); unused losses carry forward. On sale, claimed depreciation is recaptured at up to 25%, and gains may owe capital-gains tax (a 1031 exchange can defer both). Figures are a year-1 estimate at your 24.0% rate — not tax advice; consult a CPA.
Schools (NCES district)
- District
- Tate County School District
- NCES district ID
- 2804230
- Math proficiency
- 28% ▼ -11.00%
- Reading proficiency
- 27% ▼ -6.00%
- Median HH income
- $41,975
- Composite
- 23.38/100
- National rank
- #7903
- State rank
- #74 of 130 in MS
Livability — Senatobia
- Score
- 64/100
- State rank
- #130
- US rank
- #14184
Category grades
Schools grade is shown separately in the Schools card above.
Census & demographics
- Population (ZIP)
- 14,123
Population outlook (Tate County) Hauer SSP2
- Today (2025)
- 27,577 people
- By 2030
- 26,872 · -2.6%
- By 2040
- 25,319 · -8.2%
- By 2050
- 23,590 · -14.5%
- By 2075
- 19,500 · -29.3%
- By 2100
- 15,468 · -43.9%
Race, ethnicity, and origin ACS 2023
- Neighborhood character
- Majority White (59%)
- Race & ethnicity
- White 59% Black 36% Two or more races 4% Hispanic / Latino 1%
- Common ancestry
- Slovak 2% Serbian 2% Iranian 1%
- Foreign-born
- 0% · Canada
- Languages at home
- 99% English-only · Spanish 1%
Political lean MEDSL · Tate
- 2024 margin
- Solid R (+43.8) · D 27.6% · R 71.4%
- 2008→2024 swing
- -22.8pp toward R · 2008: -20.9pp · 2024: -43.8pp
- All cycles
- 2024: R+43.8 2020: R+34.5 2016: R+31.4 2012: R+18.4 2008: R+20.9
Not yet ingested
- Civics
- —
Market trends
- HPI YoY
- ▼ -36.19%
- Current HPI
- 226.9896
- Rent YoY
- —
- Metro
- —
- State GDP YoY
- —
- F500 in state
- 0
Price history
-28.0% since first listed8 events — show timeline
- 2026-05-13 Listed $164,900 MLSU
- 2026-02-27 Listing Removed — MLSU
- 2025-10-16 Listed $215,000 MLSU
- 2021-11-30 Sold (Public Records) — Public Records
- 2021-11-30 Sold (MLS) — MLSU
- 2021-10-15 Listing Removed — MLSU
- 2021-09-27 Listed $229,000 MLSU
- 1959-10-15 Sold (Public Records) — Public Records
Property tax history
+12.9%/yrLatest (2025): $1,301 · +1097.6% YoY. Source: county tax records.
Cash-flow waterfall
monthlySold comps — $/sqft
last 12 mo · ≤1 miLoading sold comps…