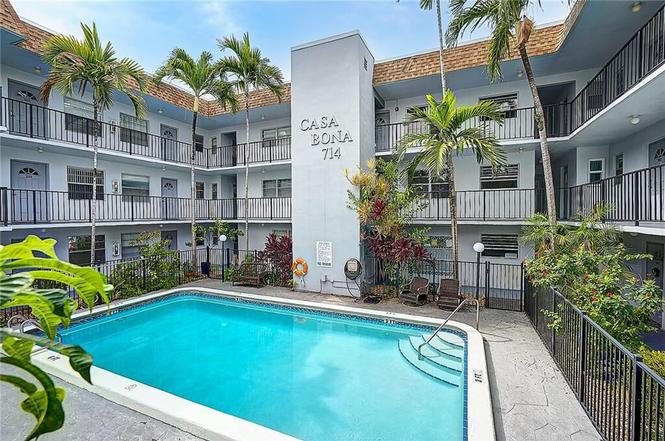
714 NE 10th St #205 · Hallandale Beach, FL
Flood risk No data
- FEMA flood zone
- —
- Chance of flooding over 30 yrs
- —
- Est. flood insurance / yr
- —
Fire risk No data
- Est. fire insurance / yr
- —
Heat risk No data
- Hot days now (above threshold)
- —
- Hot days in 30 yrs
- —
Wind risk No data
- Chance of severe wind over 30 yrs
- —
Air-quality risk No data
- Unhealthy air days now
- —
- Unhealthy air days in 30 yrs
- —
Risk factors via First Street. Map © Google.
Why this score? — see what drove the B grade
The composite is a weighted blend of 9 inputs, each scored 0–100. Each bar is that input's sub-score; the figure is the points it added to the 100-point composite (weight × sub-score).
- Cash flow +30.0/30.0
- 1% rule +10.0/10.0
- DSCR +10.0/10.0
- ARV discount +7.5/15.0
- Schools +4.1/10.0
- Livability +4.0/5.0
- Rent growth +2.6/5.0
- Condition / age +2.5/5.0
- Appreciation +0.0/10.0
$146,000
🖨 Deal sheet (PDF) 📄 Offer letter ✓ Due diligence
Listing remarks
Motivated Seller, priced for immediate sale! Building is SIRS compliant, HOA fully funded, healthy reserves and no assessments. This charming 2 bed, 2 bath condo is the perfect opportunity to own in one of Hallandale Beach's most desirable boutique buildings. An inviting open concept living and dining area with plenty of room to relax or entertain. The spacious kitchen, and a large hallway storage closet adds rare extra space. Convenient elevator access is right outside your door, making daily living effortless. Several amenities including a sparkling pool, meeting room, and elevator. The location is unbeatable, just minutes to Aventura Mall, beaches, dining and shopping and minutes to Ft L
Key facts
- Spacious kitchen
- Meeting room
- Huge storage closet
Tags
Property features AI
Finance
- Financial info: Pets allowed (pet restrictions possible)
- HOA & community: Has association; Monthly HOA dues; Association amenities include elevator(s), laundry, and pool; HOA covers insurance, pest control, common areas, and elevator
Exterior
- Parking: Assigned parking; 1 open parking space
- Security: Closed-circuit camera(s)
- Utilities: Public water; Public sewer; Three-phase electric; Cable available
- Home design: Condominium; Resale property; Faces east; 3 total stories
- Construction: Block construction; Other roof type
- Exterior features: Not waterfront; No waterfront features listed; Pool (association amenity); Elevator(s) (association amenity)
Interior
- Kitchen: Disposal; Electric range; Refrigerator
- Bedrooms: 2 bedrooms on the main level
- Flooring: Ceramic tile; Laminate
- Bathrooms: 2 full bathrooms on the main level
- Heating & cooling: Central heating (electric); Central air conditioning (electric)
- Interior features: No special built-in interior features listed; Partially furnished; Drapes on windows
- Laundry & utility: Building laundry available (association amenity)
Neighborhood map
What this means for you Summary
Snapshot
- This is a 2-bed/2.0-bath condo listed at $146k.
Deal economics
- At list price, monthly cash flow is $597 ($7k/yr) — positive.
- The deal already cash-flows at list — no discount required.
- Meets the 1% rule at list price ($4k rent vs $146k).
- Recommended offer: $128k (12.0% below list) — sets the bar for market timing.
- Cap rate 11.2% vs local median 5.2% in Hallandale Beach — top-decile yield for the area; either an underpriced asset or a hidden risk that comps aren't pricing in. Stress-test before assuming the spread holds.
Location & tenants
- Location reads 81/100 on livability (#86 in FL, #1,400 nationally) — a professional / high-income tenant draw. Strengths: commute A+, health & safety A+, crime B+; Watch: employment D-.
- Broward (suburban): math 42% / reading 53% proficiency, ranked #46 of 73 in FL (top 63%) — families likely to look elsewhere, expect single-tenant / working-renter base with shorter leases.
- Zoned schools: Gulfstream Academy of Hallandale Beach (math 32% / reading 40%, grade F, #1,670 of 2,144 statewide, top 78%, 1,317 students, 73% FRL); Hallandale High School (math 10% / reading 24%, grade F, #597 of 667 statewide, top 90%, 1,104 students, 70% FRL) — zoned schools average 71% FRL vs 51% district-wide (20 pts higher); higher-poverty schools than district average — tighter screening recommended.
- Zoned-school proficiency averages 26% at this address vs 48% district-wide (-21 pts) — the specific schools serving this property underperform the Broward average; the district grade overstates school quality for this exact location.
- Market conditions: Rents flat; 1380 active listings in the ZIP; 40 comparable units currently listed for rent nearby; rentals at typical pace (median 17d on market — plan ~3-4 weeks tenant-placement turnaround); 2,111 units permitted in Broward County in 2024 (1,265 in 5+ unit buildings).
- At $3,878/mo this rent would consume 89% of the median local household income ($52k/yr) (locally 3293% of renters already pay >50% of income on rent) — very limited rent-growth headroom before tenants either downsize or default.
Forward outlook
- Local home prices are declining (-3.0%/yr); year-one equity from $1k of loan paydown is wiped out by about $4k of value loss. Plan a longer hold.
- Broward County population projected at +34% by 2050 — long-run rental-demand tailwind backs the buy-and-hold thesis.
Negotiation context
- It's been on market 136 days — a 12% lower offer ($128k) is reasonable based on typical stale-listing flexibility.
- 7 sale attempts; this cycle's ask has dropped $46k (24%) from the opening price — seller is motivated, your offer sets the floor, not the list.
Risks & watch-outs
- Watch-outs: property tax is 3.0% of price; HOA is 33% of rent.
Questions for the listing agent
- It's been on market 136 days. Have you received any prior offers? Is the seller open to a 12% concession, seller financing, or rate buy-down credit?
- Built in 1974 — when were the roof, HVAC, electrical panel, plumbing, and water heater last replaced?
- Property tax is high relative to price — has the assessment been appealed recently, and will the sale trigger a re-assessment?
- What does the HOA fee cover, when was the last increase, and are there any pending special assessments or reserve-fund shortfalls?
- Any open or pending special assessments — roof, HVAC, plumbing, elevator, façade? What's the per-unit balance and payoff schedule, and is the seller paying it off at close or rolling it to the buyer?
- Why hasn't it sold? Are there any deal-killer items the seller is aware of (foundation, flood, title, zoning, code violations)?
- Is there a deadline driving the sale (1031 exchange, divorce, estate, relocation)? That informs how much negotiation room exists.
- What's the average days-on-market for RENTAL listings here right now (not sales)? A rising rental-DOM trend means longer vacancies and softer asking-rent achievability than the comps imply.
- What's the recent tenant-quality profile in this submarket — average credit score on applications, eviction rate, late-payment / NSF rate, and stable-employment percentage? A property-management company in the area should have these aggregated.
- How much new apartment / multifamily construction is in the pipeline within 1–3 miles? Heavy new supply (>2% of stock underway) typically softens rents 12–24 months out; light construction supports rent growth.
Investment metrics
- 1% rule
- 2.66% ✓
- Cap rate
- 11.20%
- Cash-on-cash
- 17.53%
- DSCR
- 1.78
- GRM
- 3.1
CMA / ARV
No comps found within radius.
Projected returns pro-forma
-3.0% appreciation · 0.43% rent growth · sell at horizon
- IRR
- 3.7%
- Equity multiple
- 1.14×
- Total profit
- $5,543
- Equity at exit
- $21,769
- IRR
- 8.0%
- Equity multiple
- 1.48×
- Total profit
- $19,558
- Equity at exit
- $12,623
Cash invested: $40,880 (down + closing). Projections, not guarantees.
Landlord ↔ Tenant lean methodology
- Overall (STATE)
- 87 Strongly Landlord-Friendly
- State Florida
- 87 Strongly Landlord-Friendly · R+3
- County
- — inherits STATE
- City
- — inherits STATE
ZIP-level market 33009
- Rents YoY
- 0.4%
- Active inventory
- 1380
- Price-to-rent
- 3.1×
Monthly cashflow live
- Estimated rent
- $3,878 high interval (Pro) →
- Mortgage (P&I)
- −$766
- Tax from tax record
- −$368 /mo · $4,419/yr
- Insurance
- −$61
- HOA
- −$1,272
- Vacancy / Maint / Mgmt
- −$814
- Net cashflow
- $597
Break-even live
Sensitivity live
| Price | -10% $680 | -5% $638 | +0% $597 | +5% $556 | +10% $514 |
|---|---|---|---|---|---|
| Rent | -10% $291 | -5% $444 | +0% $597 | +5% $750 | +10% $903 |
| Rate | -1.0pp $671 | -0.5pp $634 | base $597 | +0.5pp $559 | +1.0pp $521 |
UW: 25.0% down · 7.5% · 30yr · 1.5% tax · 5.0% vac · 8.0% maint · 8.0% mgmt
Financing live
Cash to close
- Down payment
- $36,500
- Closing costs
- $4,380
- Reserves months
- —
- Total cash needed
- —
Loan-product check · same deal, 3 products live
Conventional
25% down · 7.5% · 30yr
- Down + closing
- —
- Monthly P&I
- —
- Monthly cashflow
- —
- DSCR
- —
- Eligible?
- —
Personal DTI + credit; lowest rate.
DSCR
20% down · 8.5% · 30yr
- Down + closing
- —
- Monthly P&I
- —
- Monthly cashflow
- —
- DSCR
- —
- Eligible?
- —
No personal income docs; deal must DSCR.
Hard money
10% down · 12.0% · 12mo
- Down + closing
- —
- Monthly P&I
- —
- Monthly cashflow
- —
- DSCR
- —
- Eligible?
- —
Short-term bridge; refi at stabilization.
Rent comps 40 comps
| Address | Beds | Baths | Sqft | Rent | $/sqft | DOM | Units | Dist |
|---|---|---|---|---|---|---|---|---|
| 906 NE 6th St Hallandale Beach, FL | 3.0 | 2.0 | 1080 | $4,250 | $3.94 | 25d | 1 | 0.28mi |
| 906 NE 6th St Hallandale Beach, FL | 3.0 | 2.0 | 1080 | $4,250 | $3.94 | 13d | 1 | 0.28mi |
| 906 NE 6th St Hallandale Beach, FL | 3.0 | 2.0 | 1080 | $4,250 | $3.94 | 6d | 1 | 0.28mi |
| 200 E Pembroke Rd Hallandale Beach, FL | 3.0 | 1.0–2.0 | 1006 | $3,472 | $3.45 | 0d | 63 | 0.37mi |
| 401 N Federal Hwy Hallandale Beach, FL | 1.0–3.0 | 1.0–2.0 | 973 | $2,765 | $2.84 | 16d | 48 | 0.45mi |
| 1180 E Hallandale Beach Blvd Unit 1241877P Hallandale Beach, FL | 1.0–2.0 | 1.0–2.0 | 844 | $5,453 | $6.46 | 5d | 2 | 0.86mi |
| 320 S Federal Hwy Hollywood, FL | 2.0 | 1.0–2.0 | 742 | $3,616 | $4.87 | 25d | 9 | 0.90mi |
| 303 S Federal Hwy Hollywood, FL | 1.0–3.0 | 1.0–3.0 | 992 | $2,932 | $2.95 | 3d | 35 | 0.92mi |
| 1770 S Young Cir Hollywood, FL | 2.0 | 1.0–2.0 | 881 | $4,768 | $5.41 | 0d | 42 | 0.96mi |
| 101 Diplomat Pkwy Hallandale Beach, FL | 1.0 | 1.0 | 859 | $3,740 | $4.35 | 25d | 1 | 0.99mi |
| 2001 Van Buren St Hollywood, FL | 2.0 | 1.0–2.0 | 788 | $3,599 | $4.57 | 16d | 171 | 1.02mi |
| 1818 Hollywood Blvd Hollywood, FL | 3.0 | 1.0–2.5 | 1089 | $4,166 | $3.83 | 0d | 26 | 1.07mi |
| 90 SW 3rd St Unit 2400 Hallandale Beach, FL | 2.0 | 2.0 | 1079 | $3,700 | $3.43 | 25d | 1 | 1.10mi |
| 215 SE 5th St Hallandale Beach, FL | 2.0–3.0 | 2.0 | 1133 | $2,700 | $2.38 | 25d | 5 | 1.12mi |
| 2165 Van Buren St Hollywood, FL | 3.0 | 1.0–3.0 | 1072 | $3,609 | $3.37 | 0d | 15 | 1.17mi |
| 1776 Polk St Hollywood, FL | 1.0–2.0 | 1.0–2.0 | 954 | $3,598 | $3.77 | 16d | 25 | 1.19mi |
| 832 NW 10th St Unit 1 Hallandale Beach, FL | 2.0 | 1.0 | 800 | $1,800 | $2.25 | 25d | 1 | 1.20mi |
| 2233 Hollywood Blvd Hollywood, FL | 1.0–2.0 | 1.0–2.0 | 913 | $3,515 | $3.85 | 16d | 94 | 1.28mi |
| 2602 E Hallandale Beach Blvd Unit 1227270P Hallandale Beach, FL | 2.0 | 1.0–2.0 | 640 | $4,219 | $6.59 | 0d | 3 | 1.32mi |
| 2601 E Hallandale Beach Blvd Unit 1227344P Hallandale Beach, FL | 1.0–2.0 | 1.0–2.0 | 844 | $4,219 | $5.00 | 3d | 2 | 1.32mi |
| 2602 E Hallandale Beach Blvd Hallandale Beach, FL | 1.0–2.0 | 1.0–2.0 | 1092 | $5,950 | $5.45 | 25d | 3 | 1.33mi |
| 2602 E Hallandale Beach Blvd Hallandale Beach, FL | 1.0–2.0 | 1.0–2.0 | 1070 | $5,950 | $5.56 | 22d | 4 | 1.33mi |
| 2600 E Hallandale Beach Blvd Unit T3110 Hallandale Beach, FL | 2.0 | 2.0 | 1028 | $3,650 | $3.55 | 25d | 1 | 1.33mi |
| 2600 E Hallandale Beach Blvd Unit T3208 Hallandale Beach, FL | 2.0 | 2.0 | 1030 | $6,950 | $6.75 | 25d | 1 | 1.33mi |
| 2600 E Hallandale Beach Blvd Unit T3307 Hallandale Beach, FL | 2.0 | 2.0 | 1030 | $4,500 | $4.37 | 25d | 1 | 1.33mi |
| 4010 S Ocean Dr Hollywood, FL | 1.0–3.0 | 1.0–3.5 | 1078 | $7,250 | $6.73 | 25d | 5 | 1.40mi |
| 2721 E Hallandale Beach Blvd Unit 1049818P Hollywood, FL | 1.0–2.0 | 1.0–2.0 | 946 | $5,897 | $6.23 | 5d | 2 | 1.42mi |
| 4010 S Ocean Dr Unit R504 Hollywood, FL | 3.0 | 2.0 | 1122 | $10,000 | $8.91 | 25d | 1 | 1.43mi |
| 4010 S Ocean Dr Unit R2102 Hollywood, FL | 2.0 | 2.0 | 1075 | $6,500 | $6.05 | 25d | 1 | 1.43mi |
| 4010 S Ocean Dr Unit T3609 Hollywood, FL | 2.0 | 2.0 | 1060 | $6,300 | $5.94 | 25d | 1 | 1.43mi |
| 4010 S Ocean Dr Unit T3609 Hollywood, FL | 2.0 | 2.0 | 1060 | $6,300 | $5.94 | 4d | 1 | 1.43mi |
| 4010 S Ocean Dr Unit 1227249P Hollywood, FL | 1.0–3.0 | 1.5–2.5 | 1140 | $5,730 | $5.02 | 0d | 3 | 1.43mi |
| 4010 S Ocean Dr Unit T3509 Hollywood, FL | 2.0 | 2.0 | 1060 | $6,000 | $5.66 | 23d | 1 | 1.43mi |
| 4010 S Ocean Dr Unit R504 Hollywood, FL | 3.0 | 2.0 | 1122 | $10,000 | $8.91 | 9d | 1 | 1.43mi |
| 4010 S Ocean Dr Unit 1388506P Hollywood, FL | 2.0 | 2.0 | 1097 | $4,881 | $4.45 | 9d | 1 | 1.43mi |
| 829 SW 1st St Hallandale Beach, FL | 2.0 | 2.0 | 850 | $1,985 | $2.34 | 25d | 1 | 1.43mi |
| 1041 NW 7th Ct Unit 2 Hallandale Beach, FL | 1.0 | 1.0 | 600 | $1,550 | $2.58 | 25d | 1 | 1.44mi |
| 2750 Washington St Hollywood, FL | 2.0 | 1.0 | 1053 | $3,500 | $3.32 | 16d | 1 | 1.45mi |
| 2750 Washington St Hollywood, FL | 2.0 | 1.0 | 1053 | $3,300 | $3.13 | 3d | 1 | 1.45mi |
| 3505 S Ocean Dr Hollywood, FL | 1.0–2.0 | 1.5–2.0 | 1085 | $6,500 | $5.99 | 14d | 17 | 1.45mi |
HOA detail condo
- Monthly dues
- $1,272 · $15,264/yr
- Likely covers
- pool
- Assessments
- None detected in remarks — confirm with the listing agent.
Listing history 44 events
-
2026-06-21days on market $146,000 Active 136 DOM
-
2026-06-18days on market $146,000 Active 133 DOM
-
2026-06-17days on market $146,000 Active 132 DOM
-
2026-06-16days on market $146,000 Active 131 DOM
-
2026-06-15pricedays on market $146,000 Active 130 DOM
-
2026-06-13days on market $149,524 Active 128 DOM
-
2026-06-09days on market $149,524 Active 124 DOM
-
2026-06-07days on market $149,524 Active 122 DOM
-
2026-06-04days on market $149,524 Active 119 DOM
-
2026-06-03days on market $149,524 Active 118 DOM
-
2026-06-02days on market $149,524 Active 117 DOM
-
2026-06-01days on market $149,524 Active 116 DOM
-
2026-05-31days on market $149,524 Active 115 DOM
-
2026-05-05price $149,524
-
2026-04-18price $165,240
-
2026-04-11price $169,900
-
2026-02-23price $175,000
-
2026-02-05$192,000 Active
-
2025-10-24historical
-
2025-09-24price $169,000
-
2025-07-21price $174,900
-
2025-07-01$195,000 Active
-
2025-06-27historical
-
2025-05-03historical $2,600
-
2025-05-01price $199,000
-
2025-04-28price $2,600
-
2025-04-24$2,800
-
2025-04-04price $209,900
-
2025-04-01historical $2,800
-
2025-03-30$2,800
-
2025-03-20price $224,900
-
2025-03-14historical $2,800
-
2025-03-13$2,800
-
2025-03-05price $237,000
-
2025-02-19historical $3,000
-
2025-02-17$3,000
-
2025-02-13price $242,000
-
2025-01-16$249,000 Active
-
2021-09-07soldstatus $165,000
-
2011-08-18soldstatus $60,000
-
2005-11-07soldstatus $158,000
-
2002-01-17soldstatus $80,000
-
1997-06-26soldstatus $48,000
-
1989-03-15soldstatus $45,000
ⓘ Source: listings_history table (triggers on properties + properties_extension) + one-shot
backfill from property_details.listing_events for pre-trigger history.
Tax reassessment forecast FL · Resets to sale price
- Current annual tax
- $4,419 · $368/mo
- Projected year-2 tax
- $4,419 · $368/mo
- Expected delta
- $0/yr ($0/mo · 0.0%)
ⓘ Screening estimate from a state-policy table — verify with the county assessor before closing.
Nearby sold comps map
Loading sold comps map…
Walkable amenities ~0.75 mi
Loading nearby amenities…
Taxation est. · year 1
- Rental income
- $46,538
- − Mortgage interest
- −$8,178
- − Property taxes
- −$4,419
- − Insurance
- −$730
- − Repairs & maintenance
- −$3,723
- − Management
- −$3,723
- − HOA
- −$15,264
- − Depreciation
- −$4,247
- Taxable income
- $6,253
- Est. tax owed @ 24.0%
- −$1,501
- After-tax cash flow
- $5,664/yr
For passive investors: Depreciation is non-cash, so a rental often shows a tax loss while cash-flowing — sheltering income. Rental losses are passive: they offset passive income freely, and up to $25,000/yr can offset ordinary (W-2) income if you actively participate and your MAGI is under $100k (phasing out to $0 by $150k); unused losses carry forward. On sale, claimed depreciation is recaptured at up to 25%, and gains may owe capital-gains tax (a 1031 exchange can defer both). Figures are a year-1 estimate at your 24.0% rate — not tax advice; consult a CPA.
Schools (NCES district)
- District
- Broward
- NCES district ID
- 1200180
- Math proficiency
- 42% ▼ -18.00%
- Reading proficiency
- 53% ▼ -5.00%
- Median HH income
- $52,139
- Composite
- 40.88/100
- National rank
- #3621
- State rank
- #46 of 73 in FL
Livability — Hallandale Beach
- Score
- 81/100
- State rank
- #86
- US rank
- #1400
Category grades
Schools grade is shown separately in the Schools card above.
Census & demographics
- Census place
- Hallandale Beach, FL
- County
- Broward County · 1,963,430 people
- City population
- 44,021
- Metro
- Miami-Fort Lauderdale-Pompano Beach, FL
- Population (ZIP)
- 44,502
- Household income
- $52,079
- Rent vs Own
- Severe rent burden
- 3293.0
Population outlook (Broward County) Hauer SSP2
- Today (2025)
- 2,207,033 people
- By 2030
- 2,360,704 · +7.0%
- By 2040
- 2,661,208 · +20.6%
- By 2050
- 2,946,698 · +33.5%
- By 2075
- 3,602,273 · +63.2%
- By 2100
- 3,970,984 · +79.9%
Race, ethnicity, and origin ACS 2023
- Neighborhood character
- Diverse neighborhood (Simpson 0.67)
- Race & ethnicity
- Hispanic / Latino 39% White 39% Two or more races 24% Black 17% Asian 1%
- Hispanic origin (detail)
- Mexican 2% Puerto Rican 3% Cuban 9% Dominican 3% Salvadoran 2%
- Common ancestry
- Scotch-Irish 5% Hispanic 5% Subsaharan African 3%
- Foreign-born
- 51% · Canada, Jamaica, Dominican Republic
- Languages at home
- 38% English-only · Spanish 36% Russian/Polish/Slavic 12% French/Haitian/Cajun 7%
Political lean MEDSL · Broward
- 2024 margin
- D (+17.0) · D 58.0% · R 41.0%
- 2008→2024 swing
- -17.8pp toward R · 2008: 34.7pp · 2024: 17.0pp
- All cycles
- 2024: D+17.0 2020: D+29.8 2016: D+35.0 2012: D+34.9 2008: D+34.7
Not yet ingested
- Civics
- —
Market trends
- HPI YoY
- ▼ -299.13%
- Current HPI
- 329.9081
- Rent YoY
- ▲ 0.43%
- Metro
- Miami-Fort Lauderdale-Pompano Beach, FL
- State GDP YoY
- ▲ 3.28%
- F500 in state
- 36
Industry mix (Fortune 500 HQ in FL)
| Industry | F500 HQs | Revenue |
|---|---|---|
| Industrial Technology | 2 | $29B |
|
||
| Insurance | 2 | $17B |
|
||
| Retail | 1 | $60B |
|
||
| Technology Distribution | 1 | $58B |
|
||
| Homebuilding | 1 | $35B |
|
||
| Technology Manufacturing | 1 | $35B |
|
||
Price history
+232.3% since first listed31 events — show timeline
- 2026-05-05 Price Changed $149,524 Beaches MLS
- 2026-04-18 Price Changed $165,240 Beaches MLS
- 2026-04-11 Price Changed $169,900 Beaches MLS
- 2026-02-23 Price Changed $175,000 Beaches MLS
- 2026-02-05 Listed $192,000 Beaches MLS
- 2025-10-24 Listing Removed — Beaches MLS
- 2025-09-24 Price Changed $169,000 Beaches MLS
- 2025-07-21 Price Changed $174,900 Beaches MLS
- 2025-07-01 Listed $195,000 Beaches MLS
- 2025-06-27 Listing Removed — Beaches MLS
- 2025-05-03 Rental Removed $2,600 TURBOTENANT
- 2025-05-01 Price Changed $199,000 Beaches MLS
- 2025-04-28 Price Changed $2,600 TURBOTENANT
- 2025-04-24 Listed for Rent $2,800 TURBOTENANT
- 2025-04-04 Price Changed $209,900 Beaches MLS
- 2025-04-01 Rental Removed $2,800 TURBOTENANT
- 2025-03-30 Listed for Rent $2,800 TURBOTENANT
- 2025-03-20 Price Changed $224,900 Beaches MLS
- 2025-03-14 Rental Removed $2,800 TURBOTENANT
- 2025-03-13 Listed for Rent $2,800 TURBOTENANT
- 2025-03-05 Price Changed $237,000 Beaches MLS
- 2025-02-19 Rental Removed $3,000 TURBOTENANT
- 2025-02-17 Listed for Rent $3,000 TURBOTENANT
- 2025-02-13 Price Changed $242,000 Beaches MLS
- 2025-01-16 Listed $249,000 Beaches MLS
- 2021-09-07 Sold (Public Records) $165,000 Public Records
- 2011-08-18 Sold (Public Records) $60,000 Public Records
- 2005-11-07 Sold (Public Records) $158,000 Public Records
- 2002-01-17 Sold (Public Records) $80,000 Public Records
- 1997-06-26 Sold (Public Records) $48,000 Public Records
- 1989-03-15 Sold (Public Records) $45,000 Public Records
Property tax history
+16.4%/yrLatest (2025): $4,419 · +6.5% YoY. Source: county tax records.
Cash-flow waterfall
monthlySold comps — $/sqft
last 12 mo · ≤1 miLoading sold comps…