142-21 26th Ave Unit 5D · New York, NY
Flood risk 1/10 · Minimal
- FEMA flood zone
- X (unshaded)
- Chance of flooding over 30 yrs
- 0.0%
- Est. flood insurance / yr
- $507 – $1,088
Fire risk 1/10 · Minimal
- Est. fire insurance / yr
- $691 – $1,283
Heat risk 6/10 · Moderate
- Hot days now (above 99°F)
- 7 days/yr
- Hot days in 30 yrs
- 15 days/yr
Wind risk 6/10 · Moderate
- Chance of severe wind over 30 yrs
- 27.0%
Air-quality risk 4/10 · Minor
- Unhealthy air days now
- 6 days/yr
- Unhealthy air days in 30 yrs
- 6 days/yr
Risk factors via First Street. Map © Google.
Why this score? — see what drove the C- grade
The composite is a weighted blend of 9 inputs, each scored 0–100. Each bar is that input's sub-score; the figure is the points it added to the 100-point composite (weight × sub-score).
- Cash flow +20.3/30.0
- ARV discount +7.5/15.0
- DSCR +6.4/10.0
- 1% rule +5.4/10.0
- Schools +5.0/10.0
- Livability +3.8/5.0
- Rent growth +3.2/5.0
- Condition / age +2.5/5.0
- Appreciation +0.0/10.0
$250,000
🖨 Deal sheet 📄 Offer letter ✓ Due diligence
Listing remarks
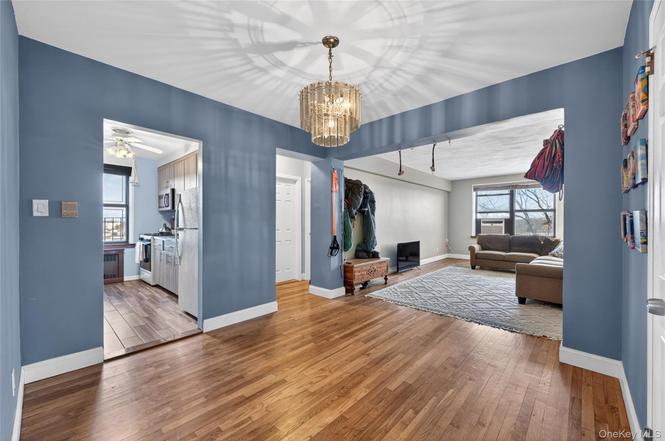
Welcome to Linden Hill. This bright corner one-bedroom co-op offers excellent natural light with a desirable north-east and South East exposure and windows on multiple sides, creating an open, airy feel. Maintenance includes all utilities, and subletting is permitted. This apartment features hardwood floors throughout and offers exceptional closet space, including dual closets plus a walk-in closet currently used as a home office. Recently renovated and thoughtfully laid out, the space balances comfort, function, and storage extremely well. This unit is eligible for the STAR program, which helps lower your monthly maintenance costs. Located on a quiet residential block near Flushing Fields
Key facts
- Walk-in closet
- Hardwood floors
- Elevator building
Tags
Property features AI
Exterior
- Parking: Garage; Parking lot; Waitlist for parking; 20 garage spaces
- Utilities: Public sewer (shared); Electricity available
- Home design: Stock cooperative
- Construction: Block construction; Brick construction
- Exterior features: Block and brick construction; Not waterfront
Interior
- Kitchen: Appliances: Other
- Bedrooms: 4 rooms total (includes first-floor bedroom)
- Bathrooms: 1 full bathroom
- Heating & cooling: Baseboard heating; Wall/window air conditioning units
- Interior features: First-floor bedroom; First-floor full bathroom; No pets allowed
- Laundry & utility: Entry level: 5
Neighborhood map
What this means for you Summary
Snapshot
- This is a 1-bed/1.0-bath condo listed at $250k.
Deal economics
- At list price, monthly cash flow is $319 ($4k/yr) — positive.
- The deal already cash-flows at list — no discount required.
- Meets the 1% rule at list price ($3k rent vs $250k).
- Recommended offer: $220k (12.0% below list) — sets the bar for market timing.
- Cap rate 7.8% vs local median 2.6% in New York — top-decile yield for the area; either an underpriced asset or a hidden risk that comps aren't pricing in. Stress-test before assuming the spread holds.
Location & tenants
- Location reads 75/100 on livability (#268 in NY, #4,188 nationally) — a middle-class / working-renter tenant base. Strengths: amenities A+, commute A+, health & safety A; Watch: crime F, cost of living F.
- Market conditions: Rents rising (+2.8%/yr); 656 active listings in the ZIP; 40 comparable units currently listed for rent nearby; rentals at typical pace (median 19d on market — plan ~3-4 weeks tenant-placement turnaround); 5,302 units permitted in Queens County in 2024 (4,918 in 5+ unit buildings).
- At $2,591/mo this rent would consume 47% of the median local household income ($66k/yr) (locally 4119% of renters already pay >50% of income on rent) — very limited rent-growth headroom before tenants either downsize or default.
Forward outlook
- Local home prices are declining (-3.0%/yr); year-one equity from $2k of loan paydown is wiped out by about $8k of value loss. Plan a longer hold.
- Queens County population projected at +16% by 2050 — long-run rental-demand tailwind backs the buy-and-hold thesis.
Negotiation context
- It's been on market 126 days — a 12% lower offer ($220k) is reasonable based on typical stale-listing flexibility.
- 3 sale attempts with the ask held roughly flat each time — persistent listings suggest the price (not the market) is what's stuck; bring a comps-based counter.
Risks & watch-outs
- Watch-outs: built in 1954 — expect roof / HVAC / electrical / plumbing capex.
- Climate carrying-cost: major wind risk, 27% chance of damaging wind over 30y; extreme-heat days projected 7→15/yr by 2055 (HVAC capex compounding) — expect insurance premiums to compound above CPI over the hold.
Questions for the listing agent
- It's been on market 126 days. Have you received any prior offers? Is the seller open to a 12% concession, seller financing, or rate buy-down credit?
- Built in 1954 — when were the roof, HVAC, electrical panel, plumbing, and water heater last replaced?
- Any open or pending special assessments — roof, HVAC, plumbing, elevator, façade? What's the per-unit balance and payoff schedule, and is the seller paying it off at close or rolling it to the buyer?
- Why hasn't it sold? Are there any deal-killer items the seller is aware of (foundation, flood, title, zoning, code violations)?
- Is there a deadline driving the sale (1031 exchange, divorce, estate, relocation)? That informs how much negotiation room exists.
- Schools are B-rated — typically a magnet for longer-tenancy family renters. What's the average tenant stay here, and is there a school-zone premium baked into asking?
- Crime grade is F in this area — have there been break-ins, vandalism, or insurance claims at this property in the last 3 years? What carrier currently insures it and at what premium?
- What's the average days-on-market for RENTAL listings here right now (not sales)? A rising rental-DOM trend means longer vacancies and softer asking-rent achievability than the comps imply.
- What's the recent tenant-quality profile in this submarket — average credit score on applications, eviction rate, late-payment / NSF rate, and stable-employment percentage? A property-management company in the area should have these aggregated.
- How much new apartment / multifamily construction is in the pipeline within 1–3 miles? Heavy new supply (>2% of stock underway) typically softens rents 12–24 months out; light construction supports rent growth.
Investment metrics
- 1% rule
- 1.04% ✓
- Cap rate
- 7.83%
- Cash-on-cash
- 5.47%
- DSCR
- 1.24
- GRM
- 8.0
CMA / ARV
No comps found within radius.
Projected returns pro-forma
-3.0% appreciation · 2.78% rent growth · sell at horizon
- IRR
- -8.1%
- Equity multiple
- 0.70×
- Total profit
- $-20,711
- Equity at exit
- $37,276
- IRR
- 1.2%
- Equity multiple
- 1.09×
- Total profit
- $5,968
- Equity at exit
- $21,615
Cash invested: $70,000 (down + closing). Projections, not guarantees.
Landlord ↔ Tenant lean methodology
- Overall (CITY)
- 0 Strongly Tenant-Friendly
- State New York
- 15 Strongly Tenant-Friendly · D+10
- County
- — inherits STATE
- City New York
- 0 Strongly Tenant-Friendly · D+34
ZIP-level market 11354
- Home prices YoY
- -33.9%
- Rents YoY
- 2.8%
- Active inventory
- 656
- Price-to-rent
- 8.0×
Monthly cashflow live
- Estimated rent
- $2,591 high interval (Pro) →
- Mortgage (P&I)
- −$1,311
- Tax est. 1.5%
- −$312 /mo · $3,750/yr
- Insurance
- −$104
- HOA
- −$0
- Vacancy / Maint / Mgmt
- −$544
- Net cashflow
- $319
Break-even live
UW: 25.0% down · 7.5% · 30yr · 1.5% tax · 5.0% vac · 8.0% maint · 8.0% mgmt
Financing live
Cash to close
- Down payment
- $62,500
- Closing costs
- $7,500
- Reserves months
- —
- Total cash needed
- —
Loan-product check · same deal, 3 products live
Conventional
25% down · 7.5% · 30yr
- Down + closing
- —
- Monthly P&I
- —
- Monthly cashflow
- —
- DSCR
- —
- Eligible?
- —
Personal DTI + credit; lowest rate.
DSCR
20% down · 8.5% · 30yr
- Down + closing
- —
- Monthly P&I
- —
- Monthly cashflow
- —
- DSCR
- —
- Eligible?
- —
No personal income docs; deal must DSCR.
Hard money
10% down · 12.0% · 12mo
- Down + closing
- —
- Monthly P&I
- —
- Monthly cashflow
- —
- DSCR
- —
- Eligible?
- —
Short-term bridge; refi at stabilization.
Rent comps 40 comps
| Address | Beds | Baths | Sqft | Rent | $/sqft | DOM | Units | Dist |
|---|---|---|---|---|---|---|---|---|
| 2621 Union St Flushing, NY | 1.0 | 1.0 | 800 | $1,800 | $2.25 | 19d | 1 | 0.11mi |
| 3132 Union St Flushing, NY | 1.0 | 1.0 | 625 | $2,400 | $3.84 | 19d | 1 | 0.38mi |
| 3132 Union St Unit 4G Flushing, NY | 1.0 | 1.0 | 650 | $2,400 | $3.69 | 7d | 1 | 0.42mi |
| 139-31 34th Ave Unit 3rd fl Flushing, NY | 2.0 | 1.0 | 900 | $2,500 | $2.78 | 24d | 1 | 0.56mi |
| 15019 26th Ave Flushing, NY | 2.0 | 1.0 | 850 | $2,800 | $3.29 | 24d | 1 | 0.56mi |
| 145-18 34th Ave Unit 8A Flushing, NY | 1.0 | 2.0 | 700 | $2,400 | $3.43 | 2d | 1 | 0.58mi |
| 140-16 34th Ave Apt 1003 Flushing, NY | 2.0 | 2.0 | 1100 | $3,300 | $3.00 | 24d | 1 | 0.60mi |
| 14016 34th Ave Unit 1210 Flushing, NY | 2.0 | 1.0 | 900 | $3,000 | $3.33 | 6d | 1 | 0.60mi |
| 140-16 34th Ave Unit 308 Flushing, NY | — | 1.0 | 600 | $2,250 | $3.75 | 24d | 1 | 0.61mi |
| 140-16 34th Ave Unit 1113 Flushing, NY | 2.0 | 1.0 | 900 | $3,000 | $3.33 | 24d | 1 | 0.61mi |
| 140-16 34th Ave Unit 412 Flushing, NY | — | 1.0 | 600 | $2,250 | $3.75 | 6d | 1 | 0.61mi |
| 141-25 Northern Blvd Unit A14 Flushing, NY | 1.0 | 1.0 | 880 | $2,350 | $2.67 | 10d | 1 | 0.70mi |
| 14809 Northern Blvd Flushing, NY | 2.0–3.0 | 2.0 | 1056 | $3,500 | $3.31 | 14d | 2 | 0.75mi |
| 14943 35th Ave Flushing, NY | 1.0 | 1.0 | 775 | $2,450 | $3.16 | 3d | 2 | 0.76mi |
| 14943 35th Ave Flushing, NY | 1.0 | 1.0 | 750 | $2,400 | $3.20 | 2d | 1 | 0.76mi |
| 36-20 Parsons Blvd Unit 5D Flushing, NY | 2.0 | 1.0 | 900 | $2,600 | $2.89 | 15d | 1 | 0.77mi |
| 13702 Northern Blvd Flushing, NY | 1.0–2.0 | 1.0 | 850 | $2,600 | $3.06 | 7d | 2 | 0.77mi |
| 13812 Northern Blvd Unit 7F Flushing, NY | 1.0 | 1.0 | 600 | $2,500 | $4.17 | 11d | 1 | 0.78mi |
| 14424 37th Ave Unit 5B Flushing, NY | 2.0 | 1.0 | 560 | $2,800 | $5.00 | 24d | 1 | 0.80mi |
| 3371 Prince St Unit 6K Flushing, NY | 2.0 | 2.0 | 768 | $4,000 | $5.21 | 15d | 1 | 0.82mi |
| 3371 Prince St Unit 7C Flushing, NY | 2.0 | 2.0 | 773 | $4,025 | $5.21 | 15d | 1 | 0.82mi |
| 3371 Prince St Unit 8J Flushing, NY | 2.0 | 2.0 | 741 | $4,075 | $5.50 | 15d | 1 | 0.82mi |
| 3371 Prince St Unit 8F Flushing, NY | 2.0 | 2.0 | 716 | $4,050 | $5.66 | 15d | 1 | 0.82mi |
| 14489 38th Ave Unit 4C Flushing, NY | 1.0 | 1.0 | 790 | $2,400 | $3.04 | 24d | 1 | 0.82mi |
| 150-01 Northern Blvd Flushing, NY | 2.0 | 2.0 | 850 | $2,800 | $3.29 | 24d | 1 | 0.84mi |
| 3641 Union St Unit 2B Flushing, NY | 2.0 | 1.0 | 968 | $3,100 | $3.20 | 24d | 1 | 0.84mi |
| 14238 37th Ave Unit 4C Flushing, NY | 2.0 | 2.0 | 820 | $2,800 | $3.41 | 24d | 1 | 0.86mi |
| 13416 35th Ave Unit 7E Flushing, NY | 2.0 | 2.0 | 681 | $3,300 | $4.85 | 24d | 1 | 0.86mi |
| 137-02 Northern Blvd Unit 6K Flushing, NY | 2.0 | 1.0 | 900 | $2,850 | $3.17 | 10d | 1 | 0.91mi |
| 13835 39th Ave Flushing, NY | 2.0 | 2.0 | 1014 | $4,350 | $4.29 | 24d | 2 | 0.96mi |
| 13835 39th Ave Flushing, NY | 2.0–3.0 | 2.0 | 1000 | $4,500 | $4.50 | 1d | 2 | 0.96mi |
| 40-10 149th St Fl 1 Flushing, NY | 2.0 | 1.0 | 900 | $2,200 | $2.44 | 15d | 1 | 0.96mi |
| 15719 26th Ave Flushing, NY | 2.0 | 1.0 | 850 | $2,850 | $3.35 | 22d | 1 | 1.00mi |
| 25-05 124th St Fl 1 Flushing, NY | 2.0 | 1.0 | 750 | $2,300 | $3.07 | 19d | 1 | 1.01mi |
| 2353 124th St College Point, NY | 1.0 | 1.0 | 1000 | $2,650 | $2.65 | 3d | 1 | 1.01mi |
| 149-08 41st Ave Unit 3rd Floor Flushing, NY | 1.0 | 1.0 | 675 | $1,850 | $2.74 | 19d | 1 | 1.03mi |
| 14731 Barclay Ave Flushing, NY | 2.0 | 1.0 | 900 | $2,500 | $2.78 | 24d | 1 | 1.05mi |
| 14427 Sanford Ave Unit 7G Flushing, NY | 2.0 | 1.0 | 655 | $3,500 | $5.34 | 24d | 1 | 1.11mi |
| 3916 Prince St Flushing, NY | 1.0 | 1.0 | 530 | $2,900 | $5.47 | 15d | 2 | 1.15mi |
| 13327 39th Ave Unit 3N Flushing, NY | 1.0 | 1.0 | 720 | $3,600 | $5.00 | 24d | 1 | 1.15mi |
HOA detail condo
- Monthly dues
- $0 · $0/yr
- Assessments
- None detected in remarks — confirm with the listing agent.
Listing history 14 events
-
2026-06-18days on market $250,000 Active 126 DOM
-
2026-06-17days on market $250,000 Active 125 DOM
-
2026-06-15days on market $250,000 Active 123 DOM
-
2026-06-13days on market $250,000 Active 121 DOM
-
2026-06-10days on market $250,000 Active 117 DOM
-
2026-06-08days on market $250,000 Active 116 DOM
-
2026-06-04days on market $250,000 Active 112 DOM
-
2026-06-03pricedays on market $250,000 Active 111 DOM
-
2026-06-01days on market $255,000 Active 109 DOM
-
2026-05-31days on market $255,000 Active 108 DOM
-
2026-05-12status Active
-
2026-03-19status Active
-
2026-02-27status Pending
-
2026-01-17$255,000 Active
ⓘ Source: listings_history table (triggers on properties + properties_extension) + one-shot
backfill from property_details.listing_events for pre-trigger history.
Climate risk First Street
- Flood 1/10 Low FEMA zone X (unshaded) · 0% chance over 30 yrs
- Wildfire 1/10 Low
- Heat 6/10 Major 7 d/yr ≥99°F today · 15 d/yr by 30 yrs out
- Wind 6/10 Major 27% chance of damaging wind over 30 yrs
- Air quality 4/10 Moderate 6 unhealthy d/yr today · 6 by 30 yrs out
Nearby sold comps map
Loading sold comps map…
Walkable amenities ~0.75 mi
Loading nearby amenities…
Taxation est. · year 1
- Rental income
- $31,093
- − Mortgage interest
- −$14,004
- − Property taxes
- −$3,750
- − Insurance
- −$1,250
- − Repairs & maintenance
- −$2,487
- − Management
- −$2,487
- − Depreciation
- −$7,273
- Taxable loss
- −$159
- Est. tax savings @ 24.0%
- +$38
- After-tax cash flow
- $3,869/yr
For passive investors: Depreciation is non-cash, so a rental often shows a tax loss while cash-flowing — sheltering income. Rental losses are passive: they offset passive income freely, and up to $25,000/yr can offset ordinary (W-2) income if you actively participate and your MAGI is under $100k (phasing out to $0 by $150k); unused losses carry forward. On sale, claimed depreciation is recaptured at up to 25%, and gains may owe capital-gains tax (a 1031 exchange can defer both). Figures are a year-1 estimate at your 24.0% rate — not tax advice; consult a CPA.
Schools (NCES district)
No district data.
Livability — New York
- Score
- 75/100
- State rank
- #268
- US rank
- #4188
Category grades
Schools grade is shown separately in the Schools card above.
Census & demographics
- Census place
- New York, NY
- County
- Queens County · 1,914,869 people
- City population
- 7,731,280
- Metro
- New York-Newark-Jersey City, NY-NJ-PA
- Population (ZIP)
- 53,028
- Household income
- $66,010
- Rent vs Own
- Severe rent burden
- 4119.0
Population outlook (Queens County) Hauer SSP2
- Today (2025)
- 2,546,320 people
- By 2030
- 2,643,059 · +3.8%
- By 2040
- 2,815,563 · +10.6%
- By 2050
- 2,944,423 · +15.6%
- By 2075
- 3,123,338 · +22.7%
- By 2100
- 3,098,688 · +21.7%
Race, ethnicity, and origin ACS 2023
- Neighborhood character
- Majority Asian (64%)
- Race & ethnicity
- Asian 64% White 15% Hispanic / Latino 14% Two or more races 6% Black 3%
- Hispanic origin (detail)
- Mexican 2% Puerto Rican 2% Dominican 2%
- Common ancestry
- Romanian 1% Italian 1%
- Foreign-born
- 66% · China, Canada, South Korea
- Languages at home
- 22% English-only · Chinese 43% Spanish 14% Korean 11%
Political lean MEDSL · Queens
- 2024 margin
- Strong D (+24.6) · D 62.3% · R 37.7%
- 2008→2024 swing
- -26.2pp toward R · 2008: 50.8pp · 2024: 24.6pp
- All cycles
- 2024: D+24.6 2020: D+45.2 2016: D+53.4 2012: D+58.5 2008: D+50.8
Not yet ingested
- Civics
- —
Market trends
- HPI YoY
- ▼ -131.64%
- Current HPI
- 257.0828
- Rent YoY
- ▲ 2.78%
- Metro
- New York-Newark-Jersey City, NY-NJ-PA
- State GDP YoY
- ▲ 2.60%
- F500 in state
- 92
Industry mix (Fortune 500 HQ in NY)
| Industry | F500 HQs | Revenue |
|---|---|---|
| Financial Services | 10 | $950B |
|
||
| Consumer Goods | 9 | $162B |
|
||
| Insurance | 4 | $225B |
|
||
| Telecommunications | 2 | $144B |
|
||
| Pharmaceuticals | 2 | $112B |
|
||
| Media / Entertainment | 2 | $69B |
|
||
Price history
4 events — show timeline
- 2026-05-12 Relisted — OneKey® MLS as Distributed by MLS Grid
- 2026-03-19 Relisted — OneKey® MLS as Distributed by MLS Grid
- 2026-02-27 Pending — OneKey® MLS as Distributed by MLS Grid
- 2026-01-17 Listed $255,000 OneKey® MLS as Distributed by MLS Grid
Cash-flow waterfall
monthlySold comps — $/sqft
last 12 mo · ≤1 miLoading sold comps…