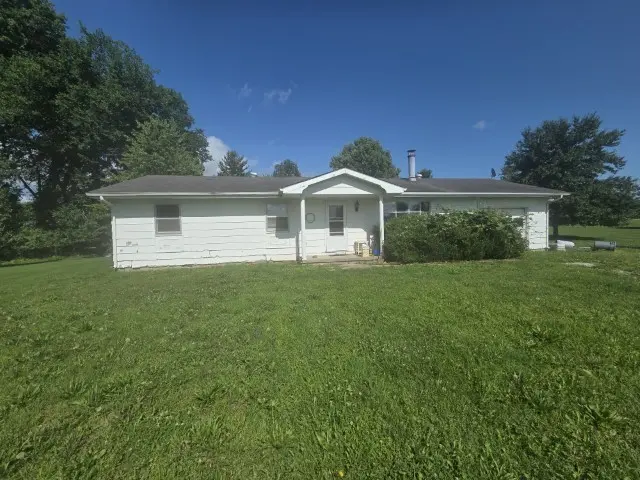
9974 N Maxwell Ln · Mount Vernon, IL
Flood risk 1/10 · Minimal
- FEMA flood zone
- X (unshaded)
- Chance of flooding over 30 yrs
- 0.0%
- Est. flood insurance / yr
- $473 – $860
Fire risk 1/10 · Minimal
- Est. fire insurance / yr
- $804 – $1,492
Heat risk 4/10 · Minor
- Hot days now (above 107°F)
- 7 days/yr
- Hot days in 30 yrs
- 20 days/yr
Wind risk 2/10 · Minimal
- Chance of severe wind over 30 yrs
- 3.0%
Air-quality risk 2/10 · Minimal
- Unhealthy air days now
- 0 days/yr
- Unhealthy air days in 30 yrs
- 1 days/yr
Risk factors via First Street. Map © Google.
Why this score? — see what drove the B- grade
The composite is a weighted blend of 9 inputs, each scored 0–100. Each bar is that input's sub-score; the figure is the points it added to the 100-point composite (weight × sub-score).
- Cash flow +30.0/30.0
- 1% rule +10.0/10.0
- DSCR +10.0/10.0
- ARV discount +7.5/15.0
- Livability +3.5/5.0
- Rent growth +2.5/5.0
- Condition / age +2.5/5.0
- Schools +1.2/10.0
- Appreciation +0.0/10.0
$45,000
🖨 Deal sheet (PDF) 📄 Offer letter ✓ Due diligence
Listing remarks
A corner location in McClellan School District is slightly elevated for a nice view. The corner lot is a total of 1.94 acres. This 3 bedroom, 1 bath home with attached garage requires extensive repairs and updating. A large Living Room with picture window and fireplace are your first steps inside. Continue ahead and the Dining Room with a patio door sits adjacent to the Kitchen, with the laundry inside a closet opposite the other appliances. Just beyond is the one-car garage. Down the short hallway are three average-sized bedrooms, one of which shares access to the one full bath in a Jack-and-Jill style. A deck extends into the backyard where there is a shed, outbuilding and dog run. Roll u
Key facts
- Corner location
- Total of 1.94 acres
- Picture window
Tags
Property features AI
Finance
- Other: Living area listed as approximately 1,500 total finished square feet; Lot dimensions: 271 x 314 x 271 x 314; Lot size approximately 1.0–1.99 acres; Directions: IL Hwy 148 to Freesia Rd, turn east, continue to Maxwell, turn right, property on left at corner
- HOA & community: No master association fee required
Exterior
- Parking: Attached garage with six garage spaces; Gravel parking
- Utilities: Public water; Septic tank sewer
- Home design: Detached single-family home; One-story layout; Fee simple ownership; Asphalt roof
- Construction: Built approximately 51–60 years ago; Masonite exterior; Block foundation; Built before 1978
- Exterior features: Deck and porch; Dog run; Corner lot
Interior
- Kitchen: Kitchen on main level (15 x 10) with linoleum flooring
- Bedrooms: Master bedroom on main level (13 x 10) with laminate flooring; Bedroom on main level (12 x 11) with laminate flooring; Bedroom on main level (9 x 9) with laminate flooring
- Flooring: Laminate flooring in living room, dining room and bedrooms; Linoleum flooring in kitchen and laundry
- Bathrooms: One full bathroom
- Heating & cooling: Electric baseboard heating; Central air conditioning
- Interior features: Six total rooms; Crawl space basement; Free-standing fireplace in the living room
- Laundry & utility: Main-level laundry closet (7 x 4) with linoleum flooring
Neighborhood map
What this means for you Summary
Snapshot
- This is a 3-bed/1.0-bath single-family listed at $45k.
Deal economics
- At list price, monthly cash flow is $681 ($8k/yr) — positive.
- The deal already cash-flows at list — no discount required.
- Meets the 1% rule at list price ($1k rent vs $45k).
- Cap rate 24.5% vs local median 5.2% in Mount Vernon — top-decile yield for the area; either an underpriced asset or a hidden risk that comps aren't pricing in. Stress-test before assuming the spread holds.
Location & tenants
- Location reads 69/100 on livability (#413 in IL) — a middle-class / working-renter tenant base. Strengths: cost of living A+, housing A+, health & safety A+; Watch: schools F, amenities F, commute F.
- Mt Vernon Twp Hsd 201 (town): math 13% / reading 16% proficiency, ranked #532 of 620 in IL (top 86%) — low school quality limits family demand, transient renter base, plan for 1-2y turnover.
- Market conditions: 191 active listings in the ZIP; 6 units permitted in Jefferson County in 2024 (0 in 5+ unit buildings).
Forward outlook
- Local home prices are declining (-3.0%/yr); year-one equity from $311 of loan paydown is wiped out by about $1k of value loss. Plan a longer hold.
- Jefferson County population projected at -14% by 2050 — secular population decline; favor cash flow + early exit over multi-decade hold.
- At projected returns (-3.0% appreciation + 3.0% rent growth), your $13k cash investment doubles in ~2 years — after that, you're playing with house money.
Negotiation context
- Only 4 days on market — expect competitive offers; lowballing is unlikely to land.
Questions for the listing agent
- Built in 1975 — when were the roof, HVAC, electrical panel, plumbing, and water heater last replaced?
- Is there a deadline driving the sale (1031 exchange, divorce, estate, relocation)? That informs how much negotiation room exists.
- Schools are F-rated, which usually means shorter tenancies and higher turnover. Who's the typical renter profile here, and what's been the actual vacancy rate?
- What's the average days-on-market for RENTAL listings here right now (not sales)? A rising rental-DOM trend means longer vacancies and softer asking-rent achievability than the comps imply.
- What's the recent tenant-quality profile in this submarket — average credit score on applications, eviction rate, late-payment / NSF rate, and stable-employment percentage? A property-management company in the area should have these aggregated.
- How much new for-sale + rental construction is in the pipeline within 1–3 miles? Heavy new supply typically softens prices + rents 12–24 months out; constrained supply supports both.
Investment metrics
- 1% rule
- 2.79% ✓
- Cap rate
- 24.46%
- Cash-on-cash
- 64.89%
- DSCR
- 3.89
- GRM
- 3.0
CMA / ARV
- ARV (on-the-fly)
- $164,736
- Comps found
- 1
Show comp detail 1 sale within ~0.75 mi
| Address | Dist | Beds/Ba | Sqft | Sold | Price | $/sf | Match |
|---|---|---|---|---|---|---|---|
| 11575 E Radisson Rd | 0.26mi | 3/2.0 | 1,328 (+6%) | 20mo | $175,000 | $132 | 56 |
Match score weights: distance 35% · size 25% · config 20% · recency 20%. Top-matched comps best support the ARV.
Projected returns pro-forma
-3.0% appreciation · 3.0% rent growth · sell at horizon
- IRR
- 64.1%
- Equity multiple
- 3.87×
- Total profit
- $36,124
- Equity at exit
- $6,710
- IRR
- 68.5%
- Equity multiple
- 7.94×
- Total profit
- $87,414
- Equity at exit
- $3,891
Cash invested: $12,600 (down + closing). Projections, not guarantees.
Landlord ↔ Tenant lean methodology
- Overall (STATE)
- 43 Moderately Tenant-Leaning
- State Illinois
- 43 Moderately Tenant-Leaning · D+7
- County
- — inherits STATE
- City
- — inherits STATE
ZIP-level market 62864
- Active inventory
- 191
- Price-to-rent
- 3.0×
Monthly cashflow live
- Estimated rent
- $1,256 medium interval (Pro) →
- Mortgage (P&I)
- −$236
- Tax est. 1.5%
- −$56 /mo · $675/yr
- Insurance
- −$19
- HOA
- −$0
- Vacancy / Maint / Mgmt
- −$264
- Net cashflow
- $681
Break-even live
Sensitivity live
| Price | -10% $712 | -5% $697 | +0% $681 | +5% $666 | +10% $650 |
|---|---|---|---|---|---|
| Rent | -10% $582 | -5% $632 | +0% $681 | +5% $731 | +10% $781 |
| Rate | -1.0pp $704 | -0.5pp $693 | base $681 | +0.5pp $670 | +1.0pp $658 |
UW: 25.0% down · 7.5% · 30yr · 1.5% tax · 5.0% vac · 8.0% maint · 8.0% mgmt
Financing live
Cash to close
- Down payment
- $11,250
- Closing costs
- $1,350
- Reserves months
- —
- Total cash needed
- —
Loan-product check · same deal, 3 products live
Conventional
25% down · 7.5% · 30yr
- Down + closing
- —
- Monthly P&I
- —
- Monthly cashflow
- —
- DSCR
- —
- Eligible?
- —
Personal DTI + credit; lowest rate.
DSCR
20% down · 8.5% · 30yr
- Down + closing
- —
- Monthly P&I
- —
- Monthly cashflow
- —
- DSCR
- —
- Eligible?
- —
No personal income docs; deal must DSCR.
Hard money
10% down · 12.0% · 12mo
- Down + closing
- —
- Monthly P&I
- —
- Monthly cashflow
- —
- DSCR
- —
- Eligible?
- —
Short-term bridge; refi at stabilization.
Listing history 3 events
-
2026-06-07statusdays on market $45,000 Pending 4 DOM
-
2026-06-04remarks 699-char remark
-
2026-06-04$45,000 Active 1 DOM
ⓘ Source: listings_history table (triggers on properties + properties_extension) + one-shot
backfill from property_details.listing_events for pre-trigger history.
Climate risk First Street
- Flood 1/10 Low FEMA zone X (unshaded) · 0% chance over 30 yrs
- Wildfire 1/10 Low
- Heat 4/10 Moderate 7 d/yr ≥107°F today · 20 d/yr by 30 yrs out
- Wind 2/10 Low 3% chance of damaging wind over 30 yrs
- Air quality 2/10 Low 0 unhealthy d/yr today · 1 by 30 yrs out
Nearby sold comps map
Loading sold comps map…
Walkable amenities ~0.75 mi
Loading nearby amenities…
Taxation est. · year 1
- Rental income
- $15,074
- − Mortgage interest
- −$2,521
- − Property taxes
- −$675
- − Insurance
- −$225
- − Repairs & maintenance
- −$1,206
- − Management
- −$1,206
- − Depreciation
- −$1,309
- Taxable income
- $7,932
- Est. tax owed @ 24.0%
- −$1,904
- After-tax cash flow
- $6,273/yr
For passive investors: Depreciation is non-cash, so a rental often shows a tax loss while cash-flowing — sheltering income. Rental losses are passive: they offset passive income freely, and up to $25,000/yr can offset ordinary (W-2) income if you actively participate and your MAGI is under $100k (phasing out to $0 by $150k); unused losses carry forward. On sale, claimed depreciation is recaptured at up to 25%, and gains may owe capital-gains tax (a 1031 exchange can defer both). Figures are a year-1 estimate at your 24.0% rate — not tax advice; consult a CPA.
Schools (NCES district)
- District
- Mt Vernon Twp Hsd 201
- NCES district ID
- 1727360
- Math proficiency
- 13% ▼ -8.00%
- Reading proficiency
- 16% ▼ -8.00%
- Median HH income
- $38,188
- Composite
- 12.22/100
- National rank
- #9648
- State rank
- #532 of 620 in IL
Livability — Mount Vernon
- Score
- 69/100
- State rank
- #413
- US rank
- #8520
Category grades
Schools grade is shown separately in the Schools card above.
Census & demographics
- Population (ZIP)
- 23,061
Population outlook (Jefferson County) Hauer SSP2
- Today (2025)
- 36,818 people
- By 2030
- 35,764 · -2.9%
- By 2040
- 33,649 · -8.6%
- By 2050
- 31,557 · -14.3%
- By 2075
- 26,055 · -29.2%
- By 2100
- 19,237 · -47.8%
Race, ethnicity, and origin ACS 2023
- Neighborhood character
- Predominantly White (83%)
- Race & ethnicity
- White 83% Black 8% Two or more races 6% Hispanic / Latino 3% Asian 1%
- Common ancestry
- Romanian 2% Slovak 2% Serbian 2%
- Foreign-born
- 2% · Canada
- Languages at home
- 97% English-only · Spanish 1% Tagalog/Filipino 1%
Political lean MEDSL · Jefferson
- 2024 margin
- Solid R (+47.8) · D 25.5% · R 73.3% · Other 1.3%
- 2008→2024 swing
- -37.0pp toward R · 2008: -10.7pp · 2024: -47.8pp
- All cycles
- 2024: R+47.8 2020: R+45.1 2016: R+43.2 2012: R+22.9 2008: R+10.7
Not yet ingested
- Civics
- —
Market trends
- HPI YoY
- ▼ -83.64%
- Current HPI
- 134.2669
- Rent YoY
- —
- Metro
- —
- State GDP YoY
- ▲ 1.59%
- F500 in state
- 60
Industry mix (Fortune 500 HQ in IL)
| Industry | F500 HQs | Revenue |
|---|---|---|
| Insurance | 4 | $201B |
|
||
| Consumer Goods | 4 | $87B |
|
||
| Industrial Machinery | 3 | $64B |
|
||
| Healthcare | 2 | $55B |
|
||
| Retail / Pharmacy | 1 | $148B |
|
||
| Agriculture / Food | 1 | $86B |
|
||
Price history
-34.3% since first listed4 events — show timeline
- 2026-06-06 Pending — MRED as Distributed by MLS Grid
- 2026-06-02 Listed $45,000 MRED as Distributed by MLS Grid
- 2014-07-02 Sold (Public Records) $68,500 Public Records
- 2014-07-02 Sold (Public Records) $68,500 Public Records
Property tax history
+2.4%/yrLatest (2024): $2,273 · +11.2% YoY. Source: county tax records.
Cash-flow waterfall
monthlySold comps — $/sqft
last 12 mo · ≤1 miLoading sold comps…