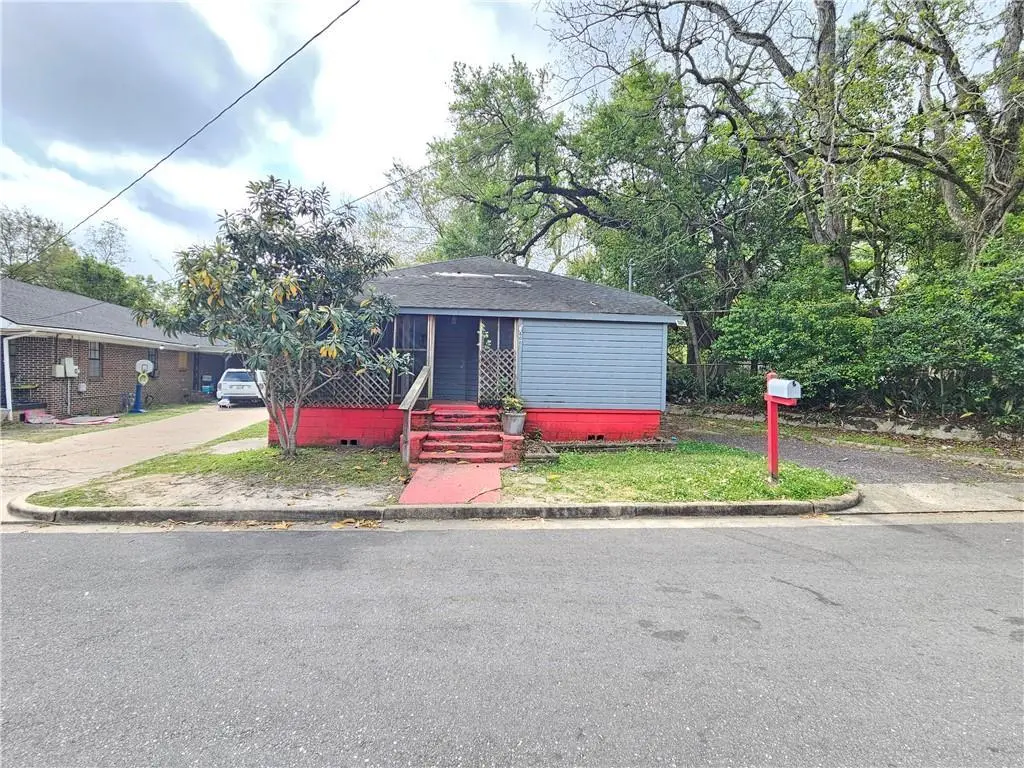
600 Forest Ave · Mobile, AL
Flood risk 8/10 · Major
- FEMA flood zone
- X (shaded)
- Chance of flooding over 30 yrs
- 0.99%
- Est. flood insurance / yr
- $507 – $1,088
Fire risk 1/10 · Minimal
- Est. fire insurance / yr
- $916 – $1,700
Heat risk 9/10 · Severe
- Hot days now (above 104°F)
- 7 days/yr
- Hot days in 30 yrs
- 21 days/yr
Wind risk 9/10 · Severe
- Chance of severe wind over 30 yrs
- 99.0%
Air-quality risk 2/10 · Minimal
- Unhealthy air days now
- 1 days/yr
- Unhealthy air days in 30 yrs
- 1 days/yr
Risk factors via First Street. Map © Google.
Why this score? — see what drove the B+ grade
The composite is a weighted blend of 9 inputs, each scored 0–100. Each bar is that input's sub-score; the figure is the points it added to the 100-point composite (weight × sub-score).
- Cash flow +30.0/30.0
- 1% rule +10.0/10.0
- DSCR +10.0/10.0
- ARV discount +7.5/15.0
- Appreciation +7.4/10.0
- Livability +3.8/5.0
- Condition / age +3.8/5.0
- Rent growth +2.5/5.0
- Schools +2.3/10.0
$69,900
🖨 Deal sheet 📄 Offer letter ✓ Due diligence
Listing remarks MLS
Great Investment Opportunity! 3-bedroom, 2-bath home offers a open floor plan perfect for everyday living. Featuring vinyl flooring throughout and a functional kitchen with Formica countertops, this home is both practical and inviting. Spacious bedrooms include walk-in closets, providing ample storage. Conveniently located near shopping, and restaurants, with easy access to I-65, this property offers endless possibilities. Previously tenant-occupied, this home presents an excellent opportunity for investors seeking a buy-and-hold rental or for buyers looking for an affordable property to call home. Don’t miss your chance to secure a property with great potential!
Key facts
- 5,140 sq ft lot
- 2 parking spots
- Listed 64 days
Neighborhood map
What this means for you Summary
Snapshot
- This is a 3-bed/1.0-bath other listed at $70k. Condition is rated good.
Deal economics
- At list price, monthly cash flow is $360 ($4k/yr) — positive.
- The deal already cash-flows at list — no discount required.
- Meets the 1% rule at list price ($1k rent vs $70k).
- Recommended offer: $66k (6.0% below list) — sets the bar for market timing.
- Cap rate 13.6% vs local median 4.9% in Mobile — top-decile yield for the area; either an underpriced asset or a hidden risk that comps aren't pricing in. Stress-test before assuming the spread holds.
Location & tenants
- Location reads 75/100 on livability (#20 in AL, #4,262 nationally) — a middle-class / working-renter tenant base. Strengths: commute A+, cost of living A+, housing A+; Watch: schools D-, crime F, employment D-.
- Mobile County (urban): math 15% / reading 39% proficiency, ranked #81 of 129 in AL (top 63%) — low school quality limits family demand, transient renter base, plan for 1-2y turnover; 67% free/reduced lunch — lower-income household profile, screen leases tightly.
- Market conditions: 40 active listings in the ZIP; 7 comparable units currently listed for rent nearby; rentals at typical pace (median 21d on market — plan ~3-4 weeks tenant-placement turnaround); 1,678 units permitted in Mobile County in 2024 (264 in 5+ unit buildings).
Forward outlook
- In year one you build about $4k of equity ($483 loan paydown + $3k appreciation (4.8% local appreciation)).
- Mobile County population projected to shrink 8% by 2050 — rents likely to lag national; underwrite the cash flow, not the appreciation.
- At projected returns (4.8% appreciation + 3.0% rent growth), your $20k cash investment doubles in ~3 years — after that, you're playing with house money.
- By year 9, paydown + projected appreciation supports a ~$33k cash-out refi (75% LTV) — recoverable capital for the next deal without selling this one.
Negotiation context
- It's been on market 64 days — a 6% lower offer ($66k) is reasonable based on typical stale-listing flexibility.
Risks & watch-outs
- Watch-outs: flood insurance adds $66/mo.
- Climate carrying-cost: severe flood risk; severe wind risk, 99% chance of damaging wind over 30y; extreme-heat days projected 7→21/yr by 2055 (HVAC capex compounding) — expect insurance premiums to compound above CPI over the hold.
Questions for the listing agent
- It's been on market 64 days. Have you received any prior offers? Is the seller open to a 6% concession, seller financing, or rate buy-down credit?
- What's the actual annual flood-insurance premium (NFIP or private), and is the property in a SFHA with mandatory coverage?
- Why hasn't it sold? Are there any deal-killer items the seller is aware of (foundation, flood, title, zoning, code violations)?
- Is there a deadline driving the sale (1031 exchange, divorce, estate, relocation)? That informs how much negotiation room exists.
- Schools are D-rated, which usually means shorter tenancies and higher turnover. Who's the typical renter profile here, and what's been the actual vacancy rate?
- Crime grade is F in this area — have there been break-ins, vandalism, or insurance claims at this property in the last 3 years? What carrier currently insures it and at what premium?
- What's the average days-on-market for RENTAL listings here right now (not sales)? A rising rental-DOM trend means longer vacancies and softer asking-rent achievability than the comps imply.
- What's the recent tenant-quality profile in this submarket — average credit score on applications, eviction rate, late-payment / NSF rate, and stable-employment percentage? A property-management company in the area should have these aggregated.
- How much new for-sale + rental construction is in the pipeline within 1–3 miles? Heavy new supply typically softens prices + rents 12–24 months out; constrained supply supports both.
Investment metrics
- 1% rule
- 1.58% ✓
- Cap rate
- 13.61%
- Cash-on-cash
- 26.15%
- DSCR
- 2.16
- GRM
- 5.3
CMA / ARV
No comps found within radius.
Projected returns pro-forma
4.78% appreciation · 3.0% rent growth · sell at horizon
- IRR
- 31.7%
- Equity multiple
- 2.95×
- Total profit
- $38,188
- Equity at exit
- $38,668
- IRR
- 30.4%
- Equity multiple
- 5.91×
- Total profit
- $96,133
- Equity at exit
- $65,968
Cash invested: $19,572 (down + closing). Projections, not guarantees.
Landlord ↔ Tenant lean methodology
- Overall (STATE)
- 90 Strongly Landlord-Friendly
- State Alabama
- 90 Strongly Landlord-Friendly · R+15
- County
- — inherits STATE
- City
- — inherits STATE
ZIP-level market 36617
- Home prices YoY
- 3.9%
- Active inventory
- 40
- Price-to-rent
- 5.3×
Monthly cashflow live
- Estimated rent
- $1,107 high interval (Pro) →
- Mortgage (P&I)
- −$367
- Tax from tax record
- −$52 /mo · $630/yr
- Insurance
- −$29
- Flood insurance flood zone
- −$66 /mo · $798/yr
- HOA
- −$0
- Vacancy / Maint / Mgmt
- −$232
- Net cashflow
- $360
Break-even live
UW: 25.0% down · 7.5% · 30yr · 1.5% tax · 5.0% vac · 8.0% maint · 8.0% mgmt
Financing live
Cash to close
- Down payment
- $17,475
- Closing costs
- $2,097
- Reserves months
- —
- Total cash needed
- —
Loan-product check · same deal, 3 products live
Conventional
25% down · 7.5% · 30yr
- Down + closing
- —
- Monthly P&I
- —
- Monthly cashflow
- —
- DSCR
- —
- Eligible?
- —
Personal DTI + credit; lowest rate.
DSCR
20% down · 8.5% · 30yr
- Down + closing
- —
- Monthly P&I
- —
- Monthly cashflow
- —
- DSCR
- —
- Eligible?
- —
No personal income docs; deal must DSCR.
Hard money
10% down · 12.0% · 12mo
- Down + closing
- —
- Monthly P&I
- —
- Monthly cashflow
- —
- DSCR
- —
- Eligible?
- —
Short-term bridge; refi at stabilization.
Rent comps 7 comps
| Address | Beds | Baths | Sqft | Rent | $/sqft | DOM | Units | Dist |
|---|---|---|---|---|---|---|---|---|
| 38 Flock Ave Mobile, AL | 2.0 | 1.0 | 849 | $795 | $0.94 | 43d | 1 | 1.15mi |
| 708 Bond St Mobile, AL | 3.0 | 1.0 | 1100 | $1,350 | $1.23 | 21d | 1 | 1.35mi |
| 672 Burden St Mobile, AL | 3.0 | 1.5 | 1421 | $1,300 | $0.91 | 21d | 1 | 1.35mi |
| 519 Bay Bridge Rd Unit B Prichard, AL | 2.0 | 1.0 | 1000 | $925 | $0.93 | 43d | 1 | 1.37mi |
| 2966 Northwest Dr Mobile, AL | 3.0 | 1.0 | 792 | $895 | $1.13 | 21d | 1 | 1.40mi |
| 510 Schwartz St Mobile, AL | 3.0 | 2.0 | 1288 | $1,400 | $1.09 | 13d | 1 | 1.40mi |
| 408 Rawls Ave Mobile, AL | 2.0 | 1.0 | 1032 | $1,100 | $1.07 | 13d | 1 | 1.46mi |
Listing history 8 events
-
2026-06-02days on market $69,900 Active 64 DOM
-
2026-06-01days on market $69,900 Active 63 DOM
-
2026-05-31days on market $69,900 Active 62 DOM
-
2026-05-30days on market $69,900 Active 61 DOM
-
2026-03-30$69,900 Active 677-char remark
Show marketing remark (677 chars)
Great Investment Opportunity! 3-bedroom, 2-bath home offers a open floor plan perfect for everyday living. Featuring vinyl flooring throughout and a functional kitchen with Formica countertops, this home is both practical and inviting. Spacious bedrooms include walk-in closets, providing ample storage. Conveniently located near shopping, and restaurants, with easy access to I-65, this property offers endless possibilities. Previously tenant-occupied, this home presents an excellent opportunity for investors seeking a buy-and-hold rental or for buyers looking for an affordable property to call home. Don’t miss your chance to secure a property with great potential!
-
2025-07-24price $69,900
-
2025-07-23price $71,000
-
2025-07-16price $73,000
ⓘ Source: listings_history table (triggers on properties + properties_extension) + one-shot
backfill from property_details.listing_events for pre-trigger history.
Tax reassessment forecast AL · Resets to sale price
- Current annual tax
- $630 · $52/mo
- Projected year-2 tax
- $630 · $52/mo
- Expected delta
- $0/yr ($0/mo · 0.0%)
ⓘ Screening estimate from a state-policy table — verify with the county assessor before closing.
Climate risk First Street
- Flood 8/10 Severe FEMA zone X (shaded) · 99% chance over 30 yrs
- Wildfire 1/10 Low
- Heat 9/10 Extreme 7 d/yr ≥104°F today · 21 d/yr by 30 yrs out
- Wind 9/10 Extreme 99% chance of damaging wind over 30 yrs
- Air quality 2/10 Low 1 unhealthy d/yr today · 1 by 30 yrs out
Nearby sold comps map
Loading sold comps map…
Walkable amenities ~0.75 mi
Loading nearby amenities…
Taxation est. · year 1
- Rental income
- $13,286
- − Mortgage interest
- −$3,915
- − Property taxes
- −$630
- − Insurance
- −$1,147
- − Repairs & maintenance
- −$1,063
- − Management
- −$1,063
- − Depreciation
- −$2,033
- Taxable income
- $3,434
- Est. tax owed @ 24.0%
- −$824
- After-tax cash flow
- $3,496/yr
For passive investors: Depreciation is non-cash, so a rental often shows a tax loss while cash-flowing — sheltering income. Rental losses are passive: they offset passive income freely, and up to $25,000/yr can offset ordinary (W-2) income if you actively participate and your MAGI is under $100k (phasing out to $0 by $150k); unused losses carry forward. On sale, claimed depreciation is recaptured at up to 25%, and gains may owe capital-gains tax (a 1031 exchange can defer both). Figures are a year-1 estimate at your 24.0% rate — not tax advice; consult a CPA.
Condition & rehab AI · 11 photos
This 3-bedroom, 2-bath home offers a good investment opportunity with a good condition and a good rehab level. It is ready for a fresh coat of paint and some minor updates to increase its value.
Value-add opportunities
- Both Paint interior walls — Fresh paint enhances curb appeal and interior aesthetics
- Both Replace ceiling fans with energy-efficient models — Modern fans improve air circulation and reduce energy costs
- Both Install new kitchen appliances — Upgraded appliances increase functionality and appeal
- Both Add landscaping around the front yard — Landscaping enhances curb appeal and adds value
- Both Install new light fixtures — Modern lighting enhances safety and aesthetics
Renovation cost estimate screening
Value-add ROI direction
- Both Paint interior walls — Fresh paint enhances curb appeal and interior aesthetics ↑
- Both Replace ceiling fans with energy-efficient models — Modern fans improve air circulation and reduce energy costs ↑
- Both Install new kitchen appliances — Upgraded appliances increase functionality and appeal ↑
- Both Add landscaping around the front yard — Landscaping enhances curb appeal and adds value ↑
- Both Install new light fixtures — Modern lighting enhances safety and aesthetics ↑
ⓘ Cost ranges are severity-bucket heuristics (US national rule-of-thumb). Get contractor quotes + a written scope before underwriting a rehab budget.
Schools (NCES district)
- District
- Mobile County
- NCES district ID
- 0102370
- Math proficiency
- 15% ▼ -28.00%
- Reading proficiency
- 39% ▬ 0.00%
- Median HH income
- $42,455
- Composite
- 22.9/100
- National rank
- #8002
- State rank
- #81 of 129 in AL
Livability — Mobile
- Score
- 75/100
- State rank
- #20
- US rank
- #4262
Category grades
Schools grade is shown separately in the Schools card above.
Census & demographics
- Census place
- Mobile, AL
- City population
- 205,729
- Population (ZIP)
- 11,952
Population outlook (Mobile County) Hauer SSP2
- Today (2025)
- 415,303 people
- By 2030
- 411,755 · -0.9%
- By 2040
- 399,670 · -3.8%
- By 2050
- 382,616 · -7.9%
- By 2075
- 337,353 · -18.8%
- By 2100
- 283,391 · -31.8%
Race, ethnicity, and origin ACS 2023
- Neighborhood character
- Predominantly Black (97%)
- Race & ethnicity
- Black 97% White 2%
- Foreign-born
- 0%
Political lean MEDSL · Mobile
- 2024 margin
- R (+16.4) · D 41.3% · R 57.7%
- 2008→2024 swing
- -7.7pp toward R · 2008: -8.7pp · 2024: -16.4pp
- All cycles
- 2024: R+16.4 2020: R+11.9 2016: R+13.9 2012: R+9.3 2008: R+8.7
Not yet ingested
- Civics
- —
Market trends
- HPI YoY
- ▲ 4.78%
- Current HPI
- 128.8377
- Rent YoY
- —
- Metro
- —
- State GDP YoY
- ▲ 2.94%
- F500 in state
- 4
Industry mix (Fortune 500 HQ in AL)
| Industry | F500 HQs | Revenue |
|---|---|---|
| Financial Services | 1 | $8B |
|
||
| Healthcare | 1 | $5B |
|
||
Price history
-4.2% since first listed4 events — show timeline
- 2026-03-30 Listed $69,900 GCMLS AL
- 2025-07-24 Price Changed $69,900 GCMLS AL
- 2025-07-23 Price Changed $71,000 GCMLS AL
- 2025-07-16 Price Changed $73,000 GCMLS AL
Property tax history
+0.9%/yrLatest (2025): $630 · -0.8% YoY. Source: county tax records.
Cash-flow waterfall
monthlySold comps — $/sqft
last 12 mo · ≤1 miLoading sold comps…