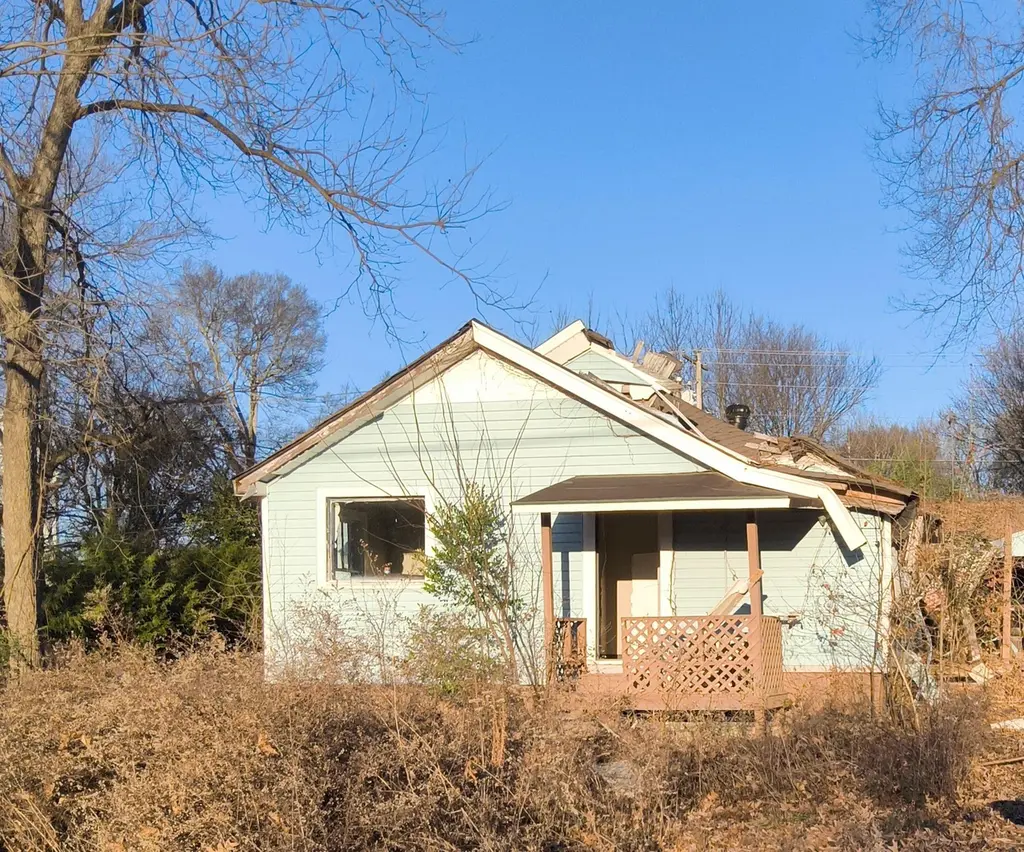
225 S Main St · Florence, AL
Flood risk 1/10 · Minimal
- FEMA flood zone
- X (unshaded)
- Chance of flooding over 30 yrs
- 0.0%
- Est. flood insurance / yr
- $507 – $1,088
Fire risk 1/10 · Minimal
- Est. fire insurance / yr
- $916 – $1,700
Heat risk 6/10 · Moderate
- Hot days now (above 107°F)
- 7 days/yr
- Hot days in 30 yrs
- 20 days/yr
Wind risk 5/10 · Moderate
- Chance of severe wind over 30 yrs
- 23.0%
Air-quality risk 2/10 · Minimal
- Unhealthy air days now
- 0 days/yr
- Unhealthy air days in 30 yrs
- 2 days/yr
Risk factors via First Street. Map © Google.
Why this score? — see what drove the B grade
The composite is a weighted blend of 9 inputs, each scored 0–100. Each bar is that input's sub-score; the figure is the points it added to the 100-point composite (weight × sub-score).
- Cash flow +30.0/30.0
- 1% rule +10.0/10.0
- DSCR +10.0/10.0
- ARV discount +7.5/15.0
- Livability +4.1/5.0
- Rent growth +4.0/5.0
- Schools +3.0/10.0
- Condition / age +2.5/5.0
- Appreciation +0.0/10.0
$45,000
🖨 Deal sheet (PDF) 📄 Offer letter ✓ Due diligence
Listing remarks MLS
Investor special! Great opportunity to add value to this property priced below tax appraisal. A tree fell on the house and repairs are needed. Property is being sold AS-IS with no repairs by seller. Ideal for investors, flippers, or contractors looking for their next project. Schedule your showing today!
Key facts
- 0.26 acre lot
- Built 1947
- Listed 157 days
Neighborhood map
What this means for you Summary
Snapshot
- This is a 3-bed/1.0-bath single-family listed at $45k.
Deal economics
- At list price, monthly cash flow is $639 ($8k/yr) — positive.
- The deal already cash-flows at list — no discount required.
- Meets the 1% rule at list price ($1k rent vs $45k).
- Recommended offer: $40k (12.0% below list) — sets the bar for market timing.
- Cap rate 23.3% vs local median 3.6% in Florence — top-decile yield for the area; either an underpriced asset or a hidden risk that comps aren't pricing in. Stress-test before assuming the spread holds.
Location & tenants
- Location reads 82/100 on livability (#4 in AL, #1,140 nationally) — a professional / high-income tenant draw. Strengths: amenities A+, commute A+, cost of living A+; Watch: crime F, employment F.
- Florence City (urban): math 28% / reading 44% proficiency, ranked #44 of 129 in AL (top 34%) — families likely to look elsewhere, expect single-tenant / working-renter base with shorter leases.
- Zoned schools: Forest Hills School (math 39% / reading 65%, grade C-, #102 of 627 statewide, top 17%, 831 students, 45% FRL); Florence Middle School (math 22% / reading 44%, grade F, #101 of 257 statewide, top 40%, 689 students, 51% FRL); Florence High School (math 28% / reading 34%, grade F, #66 of 305 statewide, top 21%, 1,034 students, 36% FRL).
- Market conditions: Rents rising fast (+6.2%/yr); 274 active listings in the ZIP; 8 comparable units currently listed for rent nearby; rentals lingering (median 48d on market — plan ~5-8 weeks vacancy on turnover, expect pricing pressure); 100% of comp listings sitting > 30 days — soft ceiling on asking rent; 164 units permitted in Lauderdale County in 2024 (72 in 5+ unit buildings).
- This rent runs 31% of the median local income ($46k/yr) — at the standard rent-burdened threshold; future hikes will face affordability resistance.
Forward outlook
- Local home prices are declining (-3.0%/yr); year-one equity from $311 of loan paydown is wiped out by about $1k of value loss. Plan a longer hold.
- At projected returns (-3.0% appreciation + 6.2% rent growth), your $13k cash investment doubles in ~2 years — after that, you're playing with house money.
Negotiation context
- It's been on market 157 days — a 12% lower offer ($40k) is reasonable based on typical stale-listing flexibility.
Risks & watch-outs
- Watch-outs: built in 1947 — expect roof / HVAC / electrical / plumbing capex.
- Climate carrying-cost: moderate wind risk, 23% chance of damaging wind over 30y; extreme-heat days projected 7→20/yr by 2055 (HVAC capex compounding) — expect insurance premiums to compound above CPI over the hold.
Questions for the listing agent
- It's been on market 157 days. Have you received any prior offers? Is the seller open to a 12% concession, seller financing, or rate buy-down credit?
- Built in 1947 — when were the roof, HVAC, electrical panel, plumbing, and water heater last replaced?
- Why hasn't it sold? Are there any deal-killer items the seller is aware of (foundation, flood, title, zoning, code violations)?
- Is there a deadline driving the sale (1031 exchange, divorce, estate, relocation)? That informs how much negotiation room exists.
- Crime grade is F in this area — have there been break-ins, vandalism, or insurance claims at this property in the last 3 years? What carrier currently insures it and at what premium?
- What's the average days-on-market for RENTAL listings here right now (not sales)? A rising rental-DOM trend means longer vacancies and softer asking-rent achievability than the comps imply.
- What's the recent tenant-quality profile in this submarket — average credit score on applications, eviction rate, late-payment / NSF rate, and stable-employment percentage? A property-management company in the area should have these aggregated.
- How much new for-sale + rental construction is in the pipeline within 1–3 miles? Heavy new supply typically softens prices + rents 12–24 months out; constrained supply supports both.
Investment metrics
- 1% rule
- 2.66% ✓
- Cap rate
- 23.33%
- Cash-on-cash
- 60.85%
- DSCR
- 3.71
- GRM
- 3.1
CMA / ARV
- ARV (median comp)
- $131,598
- List price
- $45,000
- Delta
- -65.81%
- Verdict
- UNDERPRICED
- Comps
- 20 within 1.0 mi
Show comp detail 12 sales within ~0.75 mi
| Address | Dist | Beds/Ba | Sqft | Sold | Price | $/sf | Match |
|---|---|---|---|---|---|---|---|
| 214 S Kirkman St | 0.17mi | 3/2.0 | 1,120 (-1%) | 1mo | $124,900 | $112 | 85 |
| 123 S Main St | 0.08mi | 2/2.0 (-1) | 1,140 (+0%) | 7mo | $181,000 | $159 | 81 |
| 231 N Main St | 0.30mi | 3/2.0 | 1,168 (+3%) | 2mo | $169,000 | $145 | 76 |
| 201 N Kirkman St | 0.29mi | 3/1.0 | 1,106 (-3%) | 8mo | $120,000 | $108 | 75 |
| 214 Enterprise St | 0.31mi | 3/1.0 | 1,204 (+6%) | 10mo | $120,000 | $100 | 68 |
| 213 Normandy Dr | 0.69mi | 3/1.0 | 1,125 (-1%) | 1mo | $135,000 | $120 | 65 |
| 115 N Richards St | 0.20mi | 2/1.0 (-1) | 1,270 (+12%) | 2mo | $85,000 | $67 | 64 |
| 221 N O'neal St | 0.30mi | 3/2.0 | 1,215 (+7%) | 10mo | $177,500 | $146 | 62 |
| 302 S Patton St | 0.06mi | 2/1.0 (-1) | 972 (-14%) | 9mo | $160,000 | $165 | 61 |
| 1714 Lauderdale St | 0.46mi | 2/1.0 (-1) | 1,200 (+6%) | 7mo | $165,000 | $138 | 59 |
| 12 S Franklin St | 0.64mi | 3/2.0 | 1,012 (-11%) | 8mo | $89,500 | $88 | 41 |
| 202 Minniehaha | 0.51mi | 2/1.0 (-1) | 975 (-14%) | 10mo | $99,500 | $102 | 39 |
Match score weights: distance 35% · size 25% · config 20% · recency 20%. Top-matched comps best support the ARV.
Projected returns pro-forma
-3.0% appreciation · 6.18% rent growth · sell at horizon
- IRR
- 63.2%
- Equity multiple
- 3.97×
- Total profit
- $37,376
- Equity at exit
- $6,710
- IRR
- 68.8%
- Equity multiple
- 9.12×
- Total profit
- $102,342
- Equity at exit
- $3,891
Cash invested: $12,600 (down + closing). Projections, not guarantees.
Landlord ↔ Tenant lean methodology
- Overall (STATE)
- 90 Strongly Landlord-Friendly
- State Alabama
- 90 Strongly Landlord-Friendly · R+15
- County
- — inherits STATE
- City
- — inherits STATE
ZIP-level market 35630
- Home prices YoY
- -33.7%
- Rents YoY
- 6.2%
- Active inventory
- 274
- Price-to-rent
- 3.1×
Monthly cashflow live
- Estimated rent
- $1,198 high interval (Pro) →
- Mortgage (P&I)
- −$236
- Tax from tax record
- −$53 /mo · $633/yr
- Insurance
- −$19
- HOA
- −$0
- Lot rent
- −$0
- Vacancy / Maint / Mgmt
- −$252
- Net cashflow
- $639
Break-even live
Sensitivity live
| Price | -10% $664 | -5% $652 | +0% $639 | +5% $626 | +10% $614 |
|---|---|---|---|---|---|
| Rent | -10% $544 | -5% $592 | +0% $639 | +5% $686 | +10% $734 |
| Rate | -1.0pp $662 | -0.5pp $650 | base $639 | +0.5pp $627 | +1.0pp $615 |
UW: 25.0% down · 7.5% · 30yr · 1.5% tax · 5.0% vac · 8.0% maint · 8.0% mgmt
Financing live
Cash to close
- Down payment
- $11,250
- Closing costs
- $1,350
- Reserves months
- —
- Total cash needed
- —
Loan-product check · same deal, 3 products live
Conventional
25% down · 7.5% · 30yr
- Down + closing
- —
- Monthly P&I
- —
- Monthly cashflow
- —
- DSCR
- —
- Eligible?
- —
Personal DTI + credit; lowest rate.
DSCR
20% down · 8.5% · 30yr
- Down + closing
- —
- Monthly P&I
- —
- Monthly cashflow
- —
- DSCR
- —
- Eligible?
- —
No personal income docs; deal must DSCR.
Hard money
10% down · 12.0% · 12mo
- Down + closing
- —
- Monthly P&I
- —
- Monthly cashflow
- —
- DSCR
- —
- Eligible?
- —
Short-term bridge; refi at stabilization.
Rent comps 8 comps
| Address | Beds | Baths | Sqft | Rent | $/sqft | DOM | Units | Dist |
|---|---|---|---|---|---|---|---|---|
| 211 N Patton St Unit 1510 Florence, AL | 2.0 | 1.0 | 850 | $825 | $0.97 | 47d | 1 | 0.30mi |
| 3504 Cole Ave Unit B Florence, AL | 2.0 | 1.0 | 900 | $750 | $0.83 | 47d | 1 | 0.78mi |
| 416 N Broadway St Florence, AL | 3.0 | 2.0 | 1125 | $1,450 | $1.29 | 47d | 1 | 0.93mi |
| 1110 E Limestone St Unit 1 Florence, AL | 2.0 | 1.0 | 840 | $1,600 | $1.90 | 47d | 1 | 1.01mi |
| 1846 Darby Dr Florence, AL | 2.0 | 2.5 | 1200 | $1,125 | $0.94 | 47d | 5 | 1.16mi |
| 200 Foxfield Pl Florence, AL | 2.0 | 2.0 | 1250 | $1,120 | $0.90 | 47d | 1 | 1.37mi |
| 1975 Darby Dr Florence, AL | 1.0–2.0 | 1.0–1.5 | 997 | $815 | $0.82 | 47d | 2 | 1.43mi |
| 530 N Royal Ave Florence, AL | 2.0 | 1.0 | 1200 | $1,100 | $0.92 | 48d | 1 | 1.44mi |
Listing history 18 events
-
2026-06-22days on market $45,000 Active 157 DOM
-
2026-06-21days on market $45,000 Active 156 DOM
-
2026-06-19days on market $45,000 Active 154 DOM
-
2026-06-18days on market $45,000 Active 153 DOM
-
2026-06-17days on market $45,000 Active 152 DOM
-
2026-06-16days on market $45,000 Active 151 DOM
-
2026-06-15days on market $45,000 Active 150 DOM
-
2026-06-14days on market $45,000 Active 148 DOM
-
2026-06-13days on market $45,000 Active 147 DOM
-
2026-06-10days on market $45,000 Active 145 DOM
-
2026-06-09days on market $45,000 Active 144 DOM
-
2026-06-08days on market $45,000 Active 143 DOM
-
2026-06-05days on market $45,000 Active 139 DOM
-
2026-06-02days on market $45,000 Active 137 DOM
-
2026-06-01days on market $45,000 Active 136 DOM
-
2026-05-31days on market $45,000 Active 135 DOM
-
2026-05-30days on market $45,000 Active 134 DOM
-
2026-01-14$45,000 Active 305-char remark
Show marketing remark (305 chars)
Investor special! Great opportunity to add value to this property priced below tax appraisal. A tree fell on the house and repairs are needed. Property is being sold AS-IS with no repairs by seller. Ideal for investors, flippers, or contractors looking for their next project. Schedule your showing today!
ⓘ Source: listings_history table (triggers on properties + properties_extension) + one-shot
backfill from property_details.listing_events for pre-trigger history.
Tax reassessment forecast AL · Resets to sale price
- Current annual tax
- $633 · $53/mo
- Projected year-2 tax
- $633 · $53/mo
- Expected delta
- $0/yr ($0/mo · 0.0%)
ⓘ Screening estimate from a state-policy table — verify with the county assessor before closing.
Climate risk First Street
- Flood 1/10 Low FEMA zone X (unshaded) · 0% chance over 30 yrs
- Wildfire 1/10 Low
- Heat 6/10 Major 7 d/yr ≥107°F today · 20 d/yr by 30 yrs out
- Wind 5/10 Major 23% chance of damaging wind over 30 yrs
- Air quality 2/10 Low 0 unhealthy d/yr today · 2 by 30 yrs out
Nearby sold comps map
Loading sold comps map…
Walkable amenities ~0.75 mi
Loading nearby amenities…
Taxation est. · year 1
- Rental income
- $14,377
- − Mortgage interest
- −$2,521
- − Property taxes
- −$633
- − Insurance
- −$225
- − Repairs & maintenance
- −$1,150
- − Management
- −$1,150
- − Depreciation
- −$1,309
- Taxable income
- $7,389
- Est. tax owed @ 24.0%
- −$1,773
- After-tax cash flow
- $5,894/yr
For passive investors: Depreciation is non-cash, so a rental often shows a tax loss while cash-flowing — sheltering income. Rental losses are passive: they offset passive income freely, and up to $25,000/yr can offset ordinary (W-2) income if you actively participate and your MAGI is under $100k (phasing out to $0 by $150k); unused losses carry forward. On sale, claimed depreciation is recaptured at up to 25%, and gains may owe capital-gains tax (a 1031 exchange can defer both). Figures are a year-1 estimate at your 24.0% rate — not tax advice; consult a CPA.
Schools (NCES district)
- District
- Florence City
- NCES district ID
- 0101530
- Math proficiency
- 28% ▼ -28.00%
- Reading proficiency
- 44% ▼ -4.00%
- Median HH income
- $34,997
- Composite
- 29.69/100
- National rank
- #6456
- State rank
- #44 of 129 in AL
Livability — Florence
- Score
- 82/100
- State rank
- #4
- US rank
- #1140
Category grades
Schools grade is shown separately in the Schools card above.
Census & demographics
- Census place
- Florence, AL
- County
- Lauderdale County · 47,988 people
- City population
- 34,028
- Metro
- Florence-Muscle Shoals, AL
- Population (ZIP)
- 34,028
- Household income
- $46,304
- Rent vs Own
- Severe rent burden
- 1516.0
Population outlook (Lauderdale County) Hauer SSP2
- Today (2025)
- 93,386 people
- By 2030
- 93,634 · +0.3%
- By 2040
- 93,114 · -0.3%
- By 2050
- 91,586 · -1.9%
- By 2075
- 88,667 · -5.1%
- By 2100
- 81,098 · -13.2%
Race, ethnicity, and origin ACS 2023
- Neighborhood character
- Predominantly White (70%)
- Race & ethnicity
- White 70% Black 18% Two or more races 6% Hispanic / Latino 6%
- Hispanic origin (detail)
- Mexican 5%
- Common ancestry
- Slovak 3% Serbian 2% Romanian 1%
- Foreign-born
- 4% · Canada, Vietnam, Guatemala
- Languages at home
- 92% English-only · Spanish 6% Vietnamese 1%
Political lean MEDSL · Lauderdale
- 2024 margin
- Solid R (+51.5) · D 23.8% · R 75.3%
- 2008→2024 swing
- -23.3pp toward R · 2008: -28.2pp · 2024: -51.5pp
- All cycles
- 2024: R+51.5 2020: R+44.7 2016: R+46.0 2012: R+30.9 2008: R+28.2
Not yet ingested
- Civics
- —
Market trends
- HPI YoY
- ▼ -104.78%
- Current HPI
- 206.1364
- Rent YoY
- ▲ 6.18%
- Metro
- Florence-Muscle Shoals, AL
- State GDP YoY
- ▲ 2.94%
- F500 in state
- 4
Industry mix (Fortune 500 HQ in AL)
| Industry | F500 HQs | Revenue |
|---|---|---|
| Financial Services | 1 | $8B |
|
||
| Healthcare | 1 | $5B |
|
||
Price history
1 event — show timeline
- 2026-01-14 Listed $45,000 SAARMLS
Property tax history
+4.2%/yrLatest (2025): $633 · +7.0% YoY. Source: county tax records.
Cash-flow waterfall
monthlySold comps — $/sqft
last 12 mo · ≤1 miLoading sold comps…