 Duplex
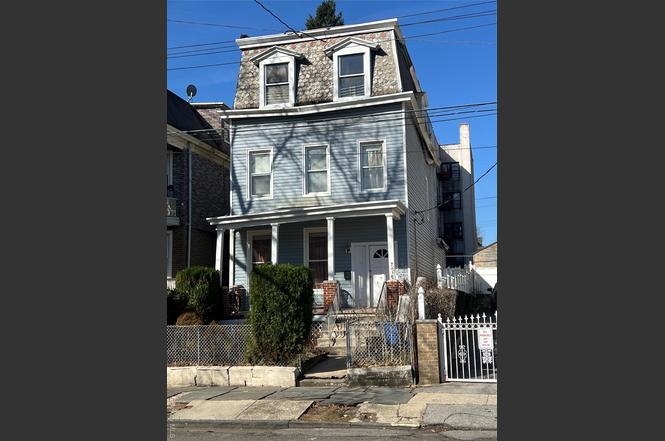
16 N 9th Ave · Mount Vernon, NY
Flood risk 1/10 · Minimal
- FEMA flood zone
- X (unshaded)
- Chance of flooding over 30 yrs
- 0.0%
- Est. flood insurance / yr
- $507 – $1,088
Fire risk 1/10 · Minimal
- Est. fire insurance / yr
- $691 – $1,283
Heat risk 6/10 · Moderate
- Hot days now (above 98°F)
- 7 days/yr
- Hot days in 30 yrs
- 15 days/yr
Wind risk 6/10 · Moderate
- Chance of severe wind over 30 yrs
- 27.0%
Air-quality risk 5/10 · Moderate
- Unhealthy air days now
- 6 days/yr
- Unhealthy air days in 30 yrs
- 8 days/yr
Risk factors via First Street. Map © Google.
Why this score? — see what drove the B grade
The composite is a weighted blend of 9 inputs, each scored 0–100. Each bar is that input's sub-score; the figure is the points it added to the 100-point composite (weight × sub-score).
- Cash flow +30.0/30.0
- 1% rule +10.0/10.0
- DSCR +10.0/10.0
- ARV discount +7.5/15.0
- Schools +3.7/10.0
- Livability +3.6/5.0
- Rent growth +3.3/5.0
- Condition / age +2.5/5.0
- Appreciation +0.0/10.0
$300,000
🖨 Deal sheet (PDF) 📄 Offer letter ✓ Due diligence
Multi-family units
County records classify this as Multi-Family (2-4 Unit). Listing-text estimate: 2 units. confirmed
Listing remarks MLS
Mint Condition 2 Family Home. Wonderful For Mother/Daughter Or Extended Family. Large Living Room Beautiful Fireplace, Spacious Formal Dining Room, All Hardwood Floors. New Kitchens/Baths With Marble Floors, New Furnace, New Hot Water Heater, New Roof. Many More Updates. Excellent Location, Convenient To All.
Key facts
- Near dining
- Spacious backyard
- Full basement
Tags
Neighborhood map
What this means for you Summary
Snapshot
- This is a 2 × 3-bed/1.5-bath units multifamily listed at $300k.
Deal economics
- At list price, monthly cash flow is $2k ($25k/yr) — positive. Per door: $1k/mo.
- The deal already cash-flows at list — no discount required.
- Meets the 1% rule at list price ($6k rent vs $300k).
- Recommended offer: $264k (12.0% below list) — sets the bar for market timing.
- Cap rate 14.7% vs local median 5.2% in Mount Vernon — top-decile yield for the area; either an underpriced asset or a hidden risk that comps aren't pricing in. Stress-test before assuming the spread holds.
Location & tenants
- Location reads 71/100 on livability (#397 in NY) — a middle-class / working-renter tenant base. Strengths: commute A+, health & safety A, employment B; Watch: crime D-, cost of living F.
- Mount Vernon School District (suburban): math 35% / reading 50% proficiency, ranked #485 of 590 in NY (top 82%) — families likely to look elsewhere, expect single-tenant / working-renter base with shorter leases; 62% free/reduced lunch — lower-income household profile, screen leases tightly.
- Market conditions: Rents rising (+3.4%/yr); 130 active listings in the ZIP; 6 comparable units currently listed for rent nearby; rentals at typical pace (median 25d on market — plan ~3-4 weeks tenant-placement turnaround); 954 units permitted in Westchester County in 2024 (649 in 5+ unit buildings).
- At $6,077/mo this rent would consume 120% of the median local household income ($61k/yr) (locally 2963% of renters already pay >50% of income on rent) — very limited rent-growth headroom before tenants either downsize or default.
Forward outlook
- Local home prices are declining (-3.0%/yr); year-one equity from $2k of loan paydown is wiped out by about $9k of value loss. Plan a longer hold.
- Westchester County population projected at +10% by 2050 — modest demand growth; plan on rents tracking national, not racing it.
- At projected returns (-3.0% appreciation + 3.4% rent growth), your $84k cash investment doubles in ~4 years — after that, you're playing with house money.
Negotiation context
- It's been on market 270 days — a 12% lower offer ($264k) is reasonable based on typical stale-listing flexibility.
- 4 sale attempts since 25y ago; this cycle's ask has dropped $275k (48%) from the opening price — seller is motivated, your offer sets the floor, not the list.
Risks & watch-outs
- Watch-outs: property tax is 4.0% of price; built in 1900 — expect roof / HVAC / electrical / plumbing capex.
- Climate carrying-cost: major wind risk, 27% chance of damaging wind over 30y; extreme-heat days projected 7→15/yr by 2055 (HVAC capex compounding) — expect insurance premiums to compound above CPI over the hold.
Questions for the listing agent
- It's been on market 270 days. Have you received any prior offers? Is the seller open to a 12% concession, seller financing, or rate buy-down credit?
- Can we see the unit-by-unit rent roll, current vacancy, and any below-market leases? What's the average tenancy length?
- What capital expenditures (roof, boiler, parking lot, exteriors) have been made in the last 5 years, and what's planned in the next 2?
- Built in 1900 — when were the roof, HVAC, electrical panel, plumbing, and water heater last replaced?
- Property tax is high relative to price — has the assessment been appealed recently, and will the sale trigger a re-assessment?
- Why hasn't it sold? Are there any deal-killer items the seller is aware of (foundation, flood, title, zoning, code violations)?
- Is there a deadline driving the sale (1031 exchange, divorce, estate, relocation)? That informs how much negotiation room exists.
- Crime grade is D in this area — have there been break-ins, vandalism, or insurance claims at this property in the last 3 years? What carrier currently insures it and at what premium?
- What's the average days-on-market for RENTAL listings here right now (not sales)? A rising rental-DOM trend means longer vacancies and softer asking-rent achievability than the comps imply.
- What's the recent tenant-quality profile in this submarket — average credit score on applications, eviction rate, late-payment / NSF rate, and stable-employment percentage? A property-management company in the area should have these aggregated.
- How much new apartment / multifamily construction is in the pipeline within 1–3 miles? Heavy new supply (>2% of stock underway) typically softens rents 12–24 months out; light construction supports rent growth.
Investment metrics
- 1% rule
- 2.03% ✓
- Cap rate
- 14.72%
- Cash-on-cash
- 30.09%
- DSCR
- 2.34
- GRM
- 4.1
CMA / ARV
No comps found within radius.
Show comp detail 12 sales within ~0.75 mi
| Address | Dist | Beds/Ba | Sqft | Sold | Price | $/sf | Match |
|---|---|---|---|---|---|---|---|
| 51 S High St | 0.35mi | 6/3.0 | 2,470 | 5mo | $640,000 | $259 | 67 |
| 112 S 7th Ave | 0.34mi | 5/3.0 (-1) | 2,200 | 1mo | $445,000 | $202 | 66 |
| 57 North St | 0.28mi | 7/3.0 (+1) | — | 6mo | $805,000 | — | 64 |
| 28 Grove St | 0.41mi | 6/2.0 | — | 1mo | $600,000 | — | 63 |
| 14 S Terrace Ave | 0.34mi | 5/2.0 (-1) | — | 2mo | $685,000 | — | 61 |
| 407 N Macquesten Pkwy | 0.52mi | 6/4.0 | 3,347 | 5mo | $850,000 | $254 | 55 |
| 248 Westchester Ave | 0.63mi | 6/4.0 | 2,674 | 0mo | $855,000 | $320 | 54 |
| 142 Cottage Ave | 0.51mi | 5/3.0 (-1) | 3,500 | 6mo | $860,000 | $246 | 54 |
| 93 Edgewood Ave | 0.73mi | 6/3.0 | 4,500 | 3mo | $974,000 | $216 | 51 |
| 19 Primrose Ave | 0.68mi | 6/4.0 | 3,759 | 4mo | $1,175,000 | $313 | 48 |
| 111 S Fulton Ave | 0.73mi | 5/2.0 (-1) | — | 1mo | $415,000 | — | 43 |
| 679 E 241st St | 0.74mi | 5/2.0 (-1) | 2,124 | 1mo | $800,000 | $377 | 43 |
Match score weights: distance 35% · size 25% · config 20% · recency 20%. Top-matched comps best support the ARV.
Projected returns pro-forma
-3.0% appreciation · 3.37% rent growth · sell at horizon
- IRR
- 25.3%
- Equity multiple
- 2.05×
- Total profit
- $88,302
- Equity at exit
- $44,731
- IRR
- 33.3%
- Equity multiple
- 4.11×
- Total profit
- $260,968
- Equity at exit
- $25,939
Cash invested: $84,000 (down + closing). Projections, not guarantees.
Landlord ↔ Tenant lean methodology
- Overall (STATE)
- 15 Strongly Tenant-Friendly
- State New York
- 15 Strongly Tenant-Friendly · D+10
- County
- — inherits STATE
- City
- — inherits STATE
ZIP-level market 10550
- Rents YoY
- 3.4%
- Active inventory
- 130
- Price-to-rent
- 8.2×
Monthly cashflow live
- Estimated rent
- $6,077 high interval (Pro) →
- Mortgage (P&I)
- −$1,573
- Tax from tax record
- −$996 /mo · $11,952/yr
- Insurance
- −$125
- HOA
- −$0
- Vacancy / Maint / Mgmt
- −$1,276
- Net cashflow
- $2,107
Break-even live
Sensitivity live
| Price | -10% $2,276 | -5% $2,192 | +0% $2,107 | +5% $2,022 | +10% $1,937 |
|---|---|---|---|---|---|
| Rent | -10% $1,627 | -5% $1,867 | +0% $2,107 | +5% $2,347 | +10% $2,587 |
| Rate | -1.0pp $2,258 | -0.5pp $2,183 | base $2,107 | +0.5pp $2,029 | +1.0pp $1,950 |
2-unit breakdown (identical units grouped — click to expand)
| Units | Beds | Baths | Est. rent |
|---|---|---|---|
| 2× units | 3 | 1.5 | $6,076 |
| #1 | 3 | 1.5 | $3,038 |
| #2 | 3 | 1.5 | $3,038 |
| Total (2 units) | $6,077 | ||
UW: 25.0% down · 7.5% · 30yr · 1.5% tax · 5.0% vac · 8.0% maint · 8.0% mgmt
Financing live
Cash to close
- Down payment
- $75,000
- Closing costs
- $9,000
- Reserves months
- —
- Total cash needed
- —
Loan-product check · same deal, 3 products live
Conventional
25% down · 7.5% · 30yr
- Down + closing
- —
- Monthly P&I
- —
- Monthly cashflow
- —
- DSCR
- —
- Eligible?
- —
Personal DTI + credit; lowest rate.
DSCR
20% down · 8.5% · 30yr
- Down + closing
- —
- Monthly P&I
- —
- Monthly cashflow
- —
- DSCR
- —
- Eligible?
- —
No personal income docs; deal must DSCR.
Hard money
10% down · 12.0% · 12mo
- Down + closing
- —
- Monthly P&I
- —
- Monthly cashflow
- —
- DSCR
- —
- Eligible?
- —
Short-term bridge; refi at stabilization.
Rent comps 6 comps
| Address | Beds | Baths | Sqft | Rent | $/sqft | DOM | Units | Dist |
|---|---|---|---|---|---|---|---|---|
| 310 S 7th Ave Mount Vernon, NY | 5.0 | 2.0 | 1000 | $4,800 | $4.80 | 25d | 1 | 0.65mi |
| 142 W 5th St Mount Vernon, NY | 6.0 | 2.0 | 1250 | $3,756 | $3.00 | 19d | 1 | 0.80mi |
| 222 Primrose Ave Unit 2 Mt Vernon, NY | 5.0 | 2.0 | 1900 | $5,250 | $2.76 | 19d | 1 | 0.89mi |
| 33 Union Ln Unit 2 Mt Vernon, NY | 5.0 | 1.0 | — | $4,000 | — | 25d | 1 | 0.93mi |
| 33 Union Ln Mount Vernon, NY | 5.0 | 1.0 | 1200 | $4,200 | $3.50 | 25d | 1 | 0.93mi |
| 641 S 5th Ave Unit 2nd/3rd Floor Mt Vernon, NY | 5.0 | 2.0 | 1800 | $3,900 | $2.17 | 5d | 1 | 1.26mi |
Listing history 14 events
-
2026-01-08status Pending
-
2025-10-15status Active
-
2025-09-20historical
-
2025-04-16price $300,000
-
2025-03-19$575,000 Active
-
2004-06-28soldstatus $339,900
-
2003-07-01soldstatus $339,900 310-char remark
Show marketing remark (310 chars)
Mint Condition 2 Family Home. Wonderful For Mother/Daughter Or Extended Family. Large Living Room Beautiful Fireplace, Spacious Formal Dining Room, All Hardwood Floors. New Kitchens/Baths With Marble Floors, New Furnace, New Hot Water Heater, New Roof. Many More Updates. Excellent Location, Convenient To All.
-
2003-04-29historical 310-char remark
Show marketing remark (310 chars)
Mint Condition 2 Family Home. Wonderful For Mother/Daughter Or Extended Family. Large Living Room Beautiful Fireplace, Spacious Formal Dining Room, All Hardwood Floors. New Kitchens/Baths With Marble Floors, New Furnace, New Hot Water Heater, New Roof. Many More Updates. Excellent Location, Convenient To All.
-
2003-03-24$339,900 310-char remark
Show marketing remark (310 chars)
Mint Condition 2 Family Home. Wonderful For Mother/Daughter Or Extended Family. Large Living Room Beautiful Fireplace, Spacious Formal Dining Room, All Hardwood Floors. New Kitchens/Baths With Marble Floors, New Furnace, New Hot Water Heater, New Roof. Many More Updates. Excellent Location, Convenient To All.
-
2002-01-22soldstatus $185,000
-
2001-09-20soldstatus $189,000 181-char remark
Show marketing remark (181 chars)
Large 2 Family, Needs Work, Close To Shopping, Buses, Trains And Schools. All Offers In Writing With Pre-qual. Sold Totally As Is Condition. Buyer To Pay Any And All Transfer Taxes.
-
2001-08-07price $189,900 181-char remark
Show marketing remark (181 chars)
Large 2 Family, Needs Work, Close To Shopping, Buses, Trains And Schools. All Offers In Writing With Pre-qual. Sold Totally As Is Condition. Buyer To Pay Any And All Transfer Taxes.
-
2001-08-07historical 181-char remark
Show marketing remark (181 chars)
Large 2 Family, Needs Work, Close To Shopping, Buses, Trains And Schools. All Offers In Writing With Pre-qual. Sold Totally As Is Condition. Buyer To Pay Any And All Transfer Taxes.
-
2001-07-25$189,000 181-char remark
Show marketing remark (181 chars)
Large 2 Family, Needs Work, Close To Shopping, Buses, Trains And Schools. All Offers In Writing With Pre-qual. Sold Totally As Is Condition. Buyer To Pay Any And All Transfer Taxes.
ⓘ Source: listings_history table (triggers on properties + properties_extension) + one-shot
backfill from property_details.listing_events for pre-trigger history.
Tax reassessment forecast NY · Partial reset (capped growth)
- Current annual tax
- $11,952 · $996/mo
- Projected year-2 tax
- $11,952 · $996/mo
- Expected delta
- $0/yr ($0/mo · 0.0%)
ⓘ Screening estimate from a state-policy table — verify with the county assessor before closing.
Climate risk First Street
- Flood 1/10 Low FEMA zone X (unshaded) · 0% chance over 30 yrs
- Wildfire 1/10 Low
- Heat 6/10 Major 7 d/yr ≥98°F today · 15 d/yr by 30 yrs out
- Wind 6/10 Major 27% chance of damaging wind over 30 yrs
- Air quality 5/10 Major 6 unhealthy d/yr today · 8 by 30 yrs out
Nearby sold comps map
Loading sold comps map…
Walkable amenities ~0.75 mi
Loading nearby amenities…
Taxation est. · year 1
- Rental income
- $72,924
- − Mortgage interest
- −$16,805
- − Property taxes
- −$11,952
- − Insurance
- −$1,500
- − Repairs & maintenance
- −$5,834
- − Management
- −$5,834
- − Depreciation
- −$8,727
- Taxable income
- $22,272
- Est. tax owed @ 24.0%
- −$5,345
- After-tax cash flow
- $19,934/yr
For passive investors: Depreciation is non-cash, so a rental often shows a tax loss while cash-flowing — sheltering income. Rental losses are passive: they offset passive income freely, and up to $25,000/yr can offset ordinary (W-2) income if you actively participate and your MAGI is under $100k (phasing out to $0 by $150k); unused losses carry forward. On sale, claimed depreciation is recaptured at up to 25%, and gains may owe capital-gains tax (a 1031 exchange can defer both). Figures are a year-1 estimate at your 24.0% rate — not tax advice; consult a CPA.
Schools (NCES district)
- District
- Mount Vernon School District
- NCES district ID
- 3620100
- Math proficiency
- 35% ▼ -3.00%
- Reading proficiency
- 50% ▲ 6.00%
- Median HH income
- $50,890
- Composite
- 36.59/100
- National rank
- #4631
- State rank
- #485 of 590 in NY
Livability — Mount Vernon
- Score
- 71/100
- State rank
- #397
- US rank
- #6876
Category grades
Schools grade is shown separately in the Schools card above.
Census & demographics
- Census place
- Mount Vernon, NY
- County
- Westchester County · 709,332 people
- City population
- 61,313
- Metro
- New York-Newark-Jersey City, NY-NJ-PA
- Population (ZIP)
- 38,972
- Household income
- $60,701
- Rent vs Own
- Severe rent burden
- 2963.0
Population outlook (Westchester County) Hauer SSP2
- Today (2025)
- 1,028,035 people
- By 2030
- 1,051,636 · +2.3%
- By 2040
- 1,098,520 · +6.9%
- By 2050
- 1,136,044 · +10.5%
- By 2075
- 1,196,925 · +16.4%
- By 2100
- 1,175,147 · +14.3%
Race, ethnicity, and origin ACS 2023
- Neighborhood character
- Predominantly Black (66%)
- Race & ethnicity
- Black 66% Hispanic / Latino 20% Two or more races 12% White 7% Asian 1%
- Hispanic origin (detail)
- Mexican 3% Puerto Rican 5% Dominican 4%
- Common ancestry
- Estonian 2% Hispanic 1% Russian 1%
- Foreign-born
- 34% · Canada, China, Jamaica
- Languages at home
- 73% English-only · Spanish 16% Other Indo-European 4% French/Haitian/Cajun 2%
Political lean MEDSL · Westchester
- 2024 margin
- Strong D (+26.3) · D 63.1% · R 36.9%
- 2008→2024 swing
- -1.3pp toward R · 2008: 27.6pp · 2024: 26.3pp
- All cycles
- 2024: D+26.3 2020: D+36.3 2016: D+32.8 2012: D+22.2 2008: D+27.6
Not yet ingested
- Civics
- —
Market trends
- HPI YoY
- ▼ -140.69%
- Current HPI
- 191.5235
- Rent YoY
- ▲ 3.37%
- Metro
- New York-Newark-Jersey City, NY-NJ-PA
- State GDP YoY
- ▲ 2.60%
- F500 in state
- 92
Industry mix (Fortune 500 HQ in NY)
| Industry | F500 HQs | Revenue |
|---|---|---|
| Financial Services | 10 | $950B |
|
||
| Consumer Goods | 9 | $162B |
|
||
| Insurance | 4 | $225B |
|
||
| Telecommunications | 2 | $144B |
|
||
| Pharmaceuticals | 2 | $112B |
|
||
| Media / Entertainment | 2 | $69B |
|
||
Price history
+58.7% since first listed14 events — show timeline
- 2026-01-08 Pending — OneKey® MLS as Distributed by MLS Grid
- 2025-10-15 Relisted — OneKey® MLS as Distributed by MLS Grid
- 2025-09-20 Listing Removed — OneKey® MLS as Distributed by MLS Grid
- 2025-04-16 Price Changed $300,000 OneKey® MLS as Distributed by MLS Grid
- 2025-03-19 Listed $575,000 OneKey® MLS as Distributed by MLS Grid
- 2004-06-28 Sold (Public Records) $339,900 Public Records
- 2003-07-01 Sold (MLS) $339,900 HGMLS
- 2003-04-29 Delisted — HGMLS
- 2003-03-24 Listed $339,900 HGMLS
- 2002-01-22 Sold (Public Records) $185,000 Public Records
- 2001-09-20 Sold (MLS) $189,000 HGMLS
- 2001-08-07 Delisted — HGMLS
- 2001-08-07 Price Changed $189,900 HGMLS
- 2001-07-25 Listed $189,000 HGMLS
Property tax history
+4.1%/yrLatest (2025): $11,952 · +3.3% YoY. Source: county tax records.
Cash-flow waterfall
monthlySold comps — $/sqft
last 12 mo · ≤1 miLoading sold comps…