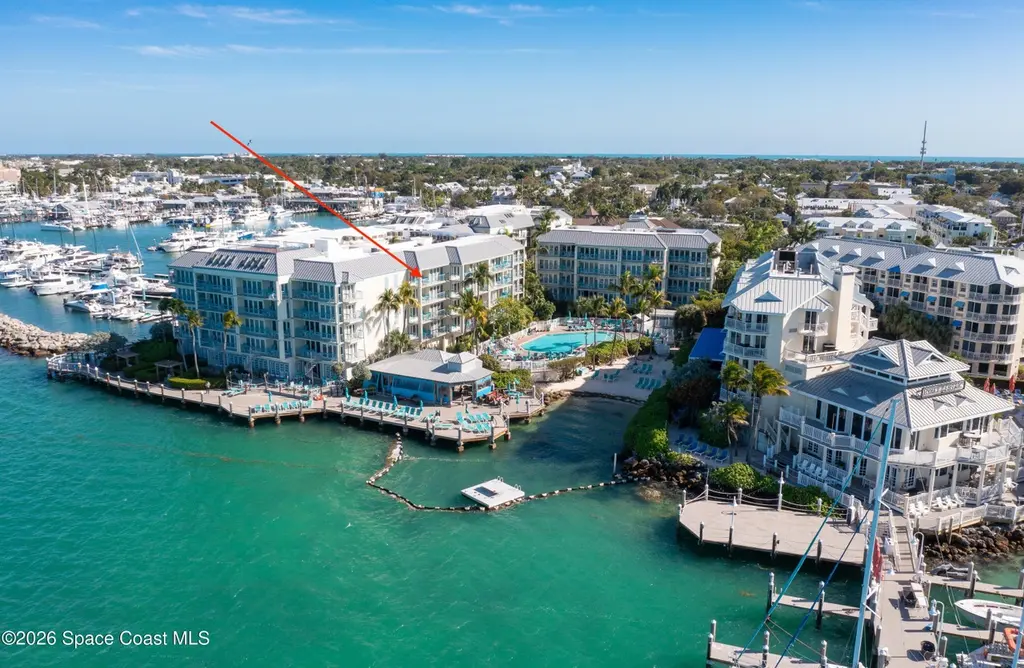
617 Front St Unit B51 Week 36 Penthouse · Key West, FL
Flood risk No data
- FEMA flood zone
- —
- Chance of flooding over 30 yrs
- —
- Est. flood insurance / yr
- —
Fire risk No data
- Est. fire insurance / yr
- —
Heat risk No data
- Hot days now (above threshold)
- —
- Hot days in 30 yrs
- —
Wind risk No data
- Chance of severe wind over 30 yrs
- —
Air-quality risk No data
- Unhealthy air days now
- —
- Unhealthy air days in 30 yrs
- —
Risk factors via First Street. Map © Google.
Why this score? — see what drove the D+ grade
The composite is a weighted blend of 9 inputs, each scored 0–100. Each bar is that input's sub-score; the figure is the points it added to the 100-point composite (weight × sub-score).
- Cash flow +15.0/30.0
- ARV discount +7.5/15.0
- 1% rule +5.0/10.0
- DSCR +5.0/10.0
- Schools +4.6/10.0
- Livability +4.1/5.0
- Rent growth +3.6/5.0
- Condition / age +2.5/5.0
- Appreciation +0.0/10.0
$32,500
🖨 Deal sheet (PDF) 📄 Offer letter ✓ Due diligence
Listing remarks
Top floor Penthouse end unit! Experience premium waterfront ownership with this deeded timeshare week 36 in the highly coveted building at the Galleon Resort. This unit offers one of the most beautiful Key West Sunsets at the resort. The residence boasts windows for abundant natural light and a balcony that maximizes the breathtaking waterfront setting. Enjoy front-row views as Coast Guard vessels and iconic pirate ships pass by just beyond your balcony. In the evenings, open the doors to take in the warm Gulf breeze and the soothing sounds of the water. Walk downstairs or take the elevator to enjoy the Galleon's on-site Tiki bar with live music, the Pirates Cove restaurant, a private beach
Key facts
- Multiple balconies
- Waterfront ownership
- Unobstructed views
Tags
Property features AI
Finance
- Other: Furnished unit
- Financial info: Association fee collected annually
- HOA & community: Part of Galleon Resort HOA; Association amenities include barbecue, beach access, cable TV, elevators, fitness center, gated community, marina, sauna, spa/hot tub, security, management, maintenance of grounds and structure, trash and water services
Exterior
- Parking: Gated parking lot; Unassigned parking; 1-car garage
- Security: Gated with guard; Security gate; 24-hour security; Closed circuit cameras; Security lights; Fire alarm and sprinkler system; Smoke detectors; Carbon monoxide detectors
- Utilities: Public sewer; Water connected; Sewer connected; Electricity connected; Natural gas available; Cable available and connected
- Home design: Timeshare property (attached unit); Single-level (one story); Entry on level 5; Faces south; Waterfront with ocean access and ocean front
- Construction: Constructed with block, concrete, and stucco; Membrane and metal roof
- Exterior features: Balcony; Courtyard; Outdoor shower; Covered deck/patio; Impact windows; Storm shutters
Interior
- Kitchen: Dishwasher; Disposal; Electric cooktop; Electric oven; Electric range; Microwave; Refrigerator; Ice maker (plumbed)
- Bedrooms: 2 bedrooms
- Flooring: Tile flooring
- Bathrooms: 2 full bathrooms
- Heating & cooling: Central heating (electric); Central air conditioning
- Interior features: Breakfast bar and breakfast nook; Built-in features; Ceiling fans; Entrance foyer; His-and-hers closets; Open floor plan; Pantry; Primary bathroom with tub and separate shower; Wet bar
- Laundry & utility: In-unit laundry with washer/dryer stacked; Washer hookup; Electric dryer hookup; Electric water heater
Neighborhood map
What this means for you Summary
Snapshot
- This is a 2-bed/2.0-bath single-family listed at $32k.
Deal economics
- At list price, monthly cash flow is $2k ($26k/yr) — positive.
- The deal already cash-flows at list — no discount required.
- Meets the 1% rule at list price ($3k rent vs $32k).
- Recommended offer: $32k (3.0% below list) — sets the bar for market timing.
- Cap rate 87.6% vs local median 0.8% in Key West — top-decile yield for the area; either an underpriced asset or a hidden risk that comps aren't pricing in. Stress-test before assuming the spread holds.
Location & tenants
- Location reads 82/100 on livability (#65 in FL, #1,123 nationally) — a professional / high-income tenant draw. Strengths: amenities A+, commute A+, employment A+; Watch: crime D+, cost of living F.
- Monroe (town): math 50% / reading 55% proficiency, ranked #23 of 73 in FL (top 32%) — acceptable for families but not a draw, mixed tenant base, ~2y average lease.
- Market conditions: Rents rising fast (+4.5%/yr); 496 active listings in the ZIP; solid renter incomes; 332 units permitted in Monroe County in 2024 (42 in 5+ unit buildings).
- This rent runs 45% of the median local income ($87k/yr) — at the standard rent-burdened threshold; future hikes will face affordability resistance.
Forward outlook
- Local home prices are declining (-3.0%/yr); year-one equity from $225 of loan paydown is wiped out by about $975 of value loss. Plan a longer hold.
- Monroe County population projected at +28% by 2050 — long-run rental-demand tailwind backs the buy-and-hold thesis.
- At projected returns (-3.0% appreciation + 4.5% rent growth), your $9k cash investment doubles in ~1 year — after that, you're playing with house money.
Negotiation context
- It's been on market 52 days — a 3% lower offer ($32k) is reasonable based on typical stale-listing flexibility.
Questions for the listing agent
- It's been on market 52 days. Have you received any prior offers? Is the seller open to a 3% concession, seller financing, or rate buy-down credit?
- What does the HOA fee cover, when was the last increase, and are there any pending special assessments or reserve-fund shortfalls?
- Is there a deadline driving the sale (1031 exchange, divorce, estate, relocation)? That informs how much negotiation room exists.
- Schools are B-rated — typically a magnet for longer-tenancy family renters. What's the average tenant stay here, and is there a school-zone premium baked into asking?
- Crime grade is D in this area — have there been break-ins, vandalism, or insurance claims at this property in the last 3 years? What carrier currently insures it and at what premium?
- The area grade is low — what's the realistic commute time and amenity access for the typical tenant pool here? Any planned neighborhood developments (good or bad) we should know about?
- What's the average days-on-market for RENTAL listings here right now (not sales)? A rising rental-DOM trend means longer vacancies and softer asking-rent achievability than the comps imply.
- What's the recent tenant-quality profile in this submarket — average credit score on applications, eviction rate, late-payment / NSF rate, and stable-employment percentage? A property-management company in the area should have these aggregated.
- How much new for-sale + rental construction is in the pipeline within 1–3 miles? Heavy new supply typically softens prices + rents 12–24 months out; constrained supply supports both.
Investment metrics
- 1% rule
- 9.97% ✓
- Cap rate
- 87.64%
- Cash-on-cash
- 290.53%
- DSCR
- 13.93
- GRM
- 0.8
CMA / ARV
- ARV (on-the-fly)
- $1,324,960
- Comps found
- 12
Show comp detail 12 sales within ~0.75 mi
| Address | Dist | Beds/Ba | Sqft | Sold | Price | $/sf | Match |
|---|---|---|---|---|---|---|---|
| 617 Front St Unit B-41 Week 28 | 0.00mi | 2/2.0 | 1,120 (0%) | 0mo | $20,000 | $18 | 100 |
| 710 William St | 0.66mi | 2/2.5 | 1,120 (0%) | 12mo | $1,325,000 | $1,183 | 57 |
| 515 Petronia St | 0.66mi | 2/2.0 | 1,200 (+7%) | 3mo | $1,400,000 | $1,167 | 55 |
| 618 Mickens Ln | 0.62mi | 2/2.5 | 1,056 (-6%) | 6mo | $800,000 | $758 | 54 |
| 709 Frances St | 0.70mi | 1/1.5 (-1) | 1,095 (-2%) | 3mo | $875,000 | $799 | 54 |
| 716 Elizabeth St | 0.62mi | 3/2.0 (+1) | 1,049 (-6%) | 9mo | $875,000 | $834 | 48 |
| 819 Elizabeth St | 0.70mi | 2/2.0 | 1,025 (-8%) | 9mo | $1,525,000 | $1,488 | 46 |
| 1120 Stump Ln | 0.62mi | 2/2.0 | 952 (-15%) | 1mo | $1,135,000 | $1,192 | 45 |
| 626 Canfield Ln | 0.59mi | 3/2.0 (+1) | 1,223 (+9%) | 9mo | $2,600,000 | $2,126 | 44 |
| 11 Lowes Ln | 0.55mi | 3/3.0 (+1) | 1,203 (+7%) | 13mo | $2,400,000 | $1,995 | 43 |
| 715 Chapman Ln | 0.72mi | 1/2.0 (-1) | 1,212 (+8%) | 8mo | $1,700,000 | $1,403 | 41 |
| 705 Chapman Ln | 0.71mi | 3/1.0 (+1) | 1,231 (+10%) | 2mo | $1,100,000 | $894 | 40 |
Match score weights: distance 35% · size 25% · config 20% · recency 20%. Top-matched comps best support the ARV.
Projected returns pro-forma
-3.0% appreciation · 4.52% rent growth · sell at horizon
- IRR
- —
- Equity multiple
- 16.41×
- Total profit
- $140,217
- Equity at exit
- $4,846
- IRR
- —
- Equity multiple
- 36.67×
- Total profit
- $324,608
- Equity at exit
- $2,810
Cash invested: $9,100 (down + closing). Projections, not guarantees.
Landlord ↔ Tenant lean methodology
- Overall (STATE)
- 87 Strongly Landlord-Friendly
- State Florida
- 87 Strongly Landlord-Friendly · R+3
- County
- — inherits STATE
- City
- — inherits STATE
ZIP-level market 33040
- Rents YoY
- 4.5%
- Active inventory
- 496
- Price-to-rent
- 0.8×
Monthly cashflow live
- Estimated rent
- $3,240 medium interval (Pro) →
- Mortgage (P&I)
- −$170
- Tax est. 1.5%
- −$41 /mo · $488/yr
- Insurance
- −$14
- HOA
- −$132
- Vacancy / Maint / Mgmt
- −$680
- Net cashflow
- $2,203
Break-even live
Sensitivity live
| Price | -10% $2,226 | -5% $2,214 | +0% $2,203 | +5% $2,192 | +10% $2,181 |
|---|---|---|---|---|---|
| Rent | -10% $1,947 | -5% $2,075 | +0% $2,203 | +5% $2,331 | +10% $2,459 |
| Rate | -1.0pp $2,220 | -0.5pp $2,211 | base $2,203 | +0.5pp $2,195 | +1.0pp $2,186 |
UW: 25.0% down · 7.5% · 30yr · 1.5% tax · 5.0% vac · 8.0% maint · 8.0% mgmt
Financing live
Cash to close
- Down payment
- $8,125
- Closing costs
- $975
- Reserves months
- —
- Total cash needed
- —
Loan-product check · same deal, 3 products live
Conventional
25% down · 7.5% · 30yr
- Down + closing
- —
- Monthly P&I
- —
- Monthly cashflow
- —
- DSCR
- —
- Eligible?
- —
Personal DTI + credit; lowest rate.
DSCR
20% down · 8.5% · 30yr
- Down + closing
- —
- Monthly P&I
- —
- Monthly cashflow
- —
- DSCR
- —
- Eligible?
- —
No personal income docs; deal must DSCR.
Hard money
10% down · 12.0% · 12mo
- Down + closing
- —
- Monthly P&I
- —
- Monthly cashflow
- —
- DSCR
- —
- Eligible?
- —
Short-term bridge; refi at stabilization.
HOA detail
- Monthly dues
- $132 · $1,584/yr
- Likely covers
- water
Listing history 18 events
-
2026-06-19days on market $32,500 Active 52 DOM
-
2026-06-18days on market $32,500 Active 51 DOM
-
2026-06-17days on market $32,500 Active 50 DOM
-
2026-06-16days on market $32,500 Active 49 DOM
-
2026-06-15days on market $32,500 Active 48 DOM
-
2026-06-14days on market $32,500 Active 46 DOM
-
2026-06-13days on market $32,500 Active 45 DOM
-
2026-06-10days on market $32,500 Active 43 DOM
-
2026-06-09days on market $32,500 Active 42 DOM
-
2026-06-08days on market $32,500 Active 41 DOM
-
2026-06-07days on market $32,500 Active 40 DOM
-
2026-06-05days on market $32,500 Active 37 DOM
-
2026-06-03days on market $32,500 Active 36 DOM
-
2026-06-02days on market $32,500 Active 35 DOM
-
2026-06-01days on market $32,500 Active 34 DOM
-
2026-05-31days on market $32,500 Active 33 DOM
-
2026-05-30days on market $32,500 Active 32 DOM
-
2026-04-27$32,500 Active
ⓘ Source: listings_history table (triggers on properties + properties_extension) + one-shot
backfill from property_details.listing_events for pre-trigger history.
Nearby sold comps map
Loading sold comps map…
Walkable amenities ~0.75 mi
Loading nearby amenities…
Taxation est. · year 1
- Rental income
- $38,883
- − Mortgage interest
- −$1,821
- − Property taxes
- −$488
- − Insurance
- −$162
- − Repairs & maintenance
- −$3,111
- − Management
- −$3,111
- − HOA
- −$1,584
- − Depreciation
- −$945
- Taxable income
- $27,662
- Est. tax owed @ 24.0%
- −$6,639
- After-tax cash flow
- $19,800/yr
For passive investors: Depreciation is non-cash, so a rental often shows a tax loss while cash-flowing — sheltering income. Rental losses are passive: they offset passive income freely, and up to $25,000/yr can offset ordinary (W-2) income if you actively participate and your MAGI is under $100k (phasing out to $0 by $150k); unused losses carry forward. On sale, claimed depreciation is recaptured at up to 25%, and gains may owe capital-gains tax (a 1031 exchange can defer both). Figures are a year-1 estimate at your 24.0% rate — not tax advice; consult a CPA.
Schools (NCES district)
- District
- Monroe
- NCES district ID
- 1201320
- Math proficiency
- 50% ▼ -14.00%
- Reading proficiency
- 55% ▼ -6.00%
- Median HH income
- $56,955
- Composite
- 45.51/100
- National rank
- #2608
- State rank
- #23 of 73 in FL
Livability — Key West
- Score
- 82/100
- State rank
- #65
- US rank
- #1123
Category grades
Schools grade is shown separately in the Schools card above.
Census & demographics
- Census place
- Key West, FL
- County
- Monroe County · 66,185 people
- City population
- 35,429
- Metro
- Key West, FL
- Population (ZIP)
- 35,429
- Household income
- $86,586
- Rent vs Own
- Severe rent burden
- 2502.0
Population outlook (Monroe County) Hauer SSP2
- Today (2025)
- 90,706 people
- By 2030
- 96,308 · +6.2%
- By 2040
- 106,565 · +17.5%
- By 2050
- 116,500 · +28.4%
- By 2075
- 141,423 · +55.9%
- By 2100
- 151,947 · +67.5%
Race, ethnicity, and origin ACS 2023
- Neighborhood character
- Diverse neighborhood (Simpson 0.61)
- Race & ethnicity
- White 56% Hispanic / Latino 26% Two or more races 16% Black 12% Asian 2%
- Hispanic origin (detail)
- Mexican 2% Puerto Rican 2% Cuban 14%
- Common ancestry
- Hispanic 6% Romanian 2% Scotch-Irish 2%
- Foreign-born
- 22% · Canada, Dominican Republic
- Languages at home
- 76% English-only · Spanish 17% French/Haitian/Cajun 2% Russian/Polish/Slavic 2%
Political lean MEDSL · Monroe
- 2024 margin
- R (+18.3) · D 40.5% · R 58.8%
- 2008→2024 swing
- -23.2pp toward R · 2008: 4.9pp · 2024: -18.3pp
- All cycles
- 2024: R+18.3 2020: R+7.9 2016: R+6.9 2012: D+0.4 2008: D+4.9
Not yet ingested
- Civics
- —
Market trends
- HPI YoY
- ▼ -814.48%
- Current HPI
- 168.5706
- Rent YoY
- ▲ 4.52%
- Metro
- Key West, FL
- State GDP YoY
- ▲ 3.28%
- F500 in state
- 36
Industry mix (Fortune 500 HQ in FL)
| Industry | F500 HQs | Revenue |
|---|---|---|
| Industrial Technology | 2 | $29B |
|
||
| Insurance | 2 | $17B |
|
||
| Retail | 1 | $60B |
|
||
| Technology Distribution | 1 | $58B |
|
||
| Homebuilding | 1 | $35B |
|
||
| Technology Manufacturing | 1 | $35B |
|
||
Price history
1 event — show timeline
- 2026-04-27 Listed $32,500 SCMLS
Cash-flow waterfall
monthlySold comps — $/sqft
last 12 mo · ≤1 miLoading sold comps…