405 West Main Street St · Hancock, NY
Flood risk 8/10 · Major
- FEMA flood zone
- X (unshaded)
- Chance of flooding over 30 yrs
- 0.99%
- Est. flood insurance / yr
- $507 – $1,088
Fire risk 1/10 · Minimal
- Est. fire insurance / yr
- $691 – $1,283
Heat risk 3/10 · Minor
- Hot days now (above 92°F)
- 8 days/yr
- Hot days in 30 yrs
- 18 days/yr
Wind risk 2/10 · Minimal
- Chance of severe wind over 30 yrs
- 1.0%
Air-quality risk 2/10 · Minimal
- Unhealthy air days now
- 0 days/yr
- Unhealthy air days in 30 yrs
- 1 days/yr
Risk factors via First Street. Map © Google.
Why this score? — see what drove the A grade
The composite is a weighted blend of 9 inputs, each scored 0–100. Each bar is that input's sub-score; the figure is the points it added to the 100-point composite (weight × sub-score).
- Cash flow +30.0/30.0
- ARV discount +15.0/15.0
- 1% rule +10.0/10.0
- DSCR +10.0/10.0
- Appreciation +10.0/10.0
- Schools +3.6/10.0
- Livability +3.5/5.0
- Rent growth +2.5/5.0
- Condition / age +2.5/5.0
$99,000
🖨 Deal sheet 📄 Offer letter ✓ Due diligence
Listing remarks
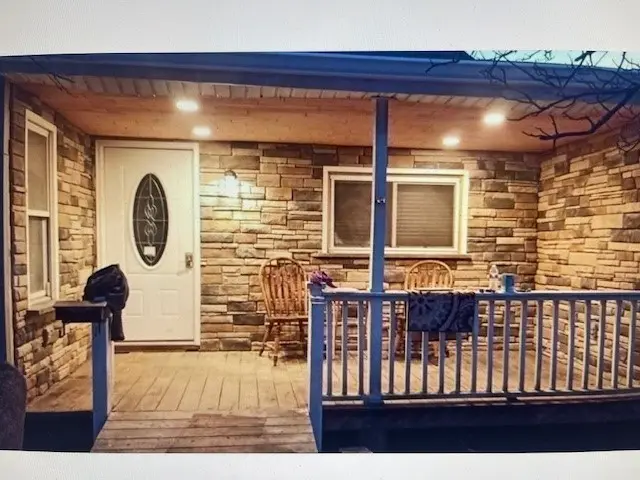
Ranch style , 2-3 bedroom, one bath home with loads of potential ! Was formerly a popular green house business. Needs TLC, but has many great features, such as a large sunny kitchen, covered porch, with a ramp for easy in & out. Full basement, attic, and car port. Sitting on a 75x147 village lot, just a short walk to all village amenities, and the beautiful Delaware River !
Key facts
- 5,662 sq ft lot
- Garage
- Built 1900
Neighborhood map
What this means for you Summary
Snapshot
- This is a 2-bed/1.0-bath single-family listed at $99k.
Deal economics
- At list price, monthly cash flow is $362 ($4k/yr) — positive.
- The deal already cash-flows at list — no discount required.
- Meets the 1% rule at list price ($2k rent vs $99k).
- Recommended offer: $87k (12.0% below list) — sets the bar for market timing.
Location & tenants
- Location reads 70/100 on livability (#454 in NY) — a middle-class / working-renter tenant base. Strengths: cost of living A+, housing A, crime A-; Watch: amenities D, commute F, employment F.
- Hancock Central School District (rural): math 40% / reading 40% proficiency, ranked #649 of 755 in NY (top 86%) — families likely to look elsewhere, expect single-tenant / working-renter base with shorter leases.
- Zoned schools: Hancock Elementary School (math 15% / reading 34%, grade F, #1,825 of 2,108 statewide, top 88%, 96 students, 54% FRL).
- Zoned-school proficiency averages 25% at this address vs 40% district-wide (-15 pts) — the specific schools serving this property underperform the Hancock Central School District average; the district grade overstates school quality for this exact location.
- Market conditions: 35 active listings in the ZIP; 1 comparable units currently listed for rent nearby; 66 units permitted in Delaware County in 2024 (0 in 5+ unit buildings).
Forward outlook
- In year one you build about $11k of equity ($684 loan paydown + $10k appreciation (10.0% local appreciation)).
- Delaware County population projected at -27% by 2050 — secular population decline; favor cash flow + early exit over multi-decade hold.
- At projected returns (10.0% appreciation + 3.0% rent growth), your $28k cash investment doubles in ~2 years — after that, you're playing with house money.
- By year 4, paydown + projected appreciation supports a ~$38k cash-out refi (75% LTV) — recoverable capital for the next deal without selling this one.
Negotiation context
- It's been on market 243 days — a 12% lower offer ($87k) is reasonable based on typical stale-listing flexibility.
- 3 sale attempts since 4y ago with the ask held roughly flat each time — persistent listings suggest the price (not the market) is what's stuck; bring a comps-based counter.
- Current owner paid $75k; 32% above their basis — modest negotiation headroom, anchor on the comps not their cost.
Risks & watch-outs
- Watch-outs: property tax is 3.3% of price; flood insurance adds $66/mo; built in 1900 — expect roof / HVAC / electrical / plumbing capex.
Questions for the listing agent
- It's been on market 243 days. Have you received any prior offers? Is the seller open to a 12% concession, seller financing, or rate buy-down credit?
- Built in 1900 — when were the roof, HVAC, electrical panel, plumbing, and water heater last replaced?
- Property tax is high relative to price — has the assessment been appealed recently, and will the sale trigger a re-assessment?
- What's the actual annual flood-insurance premium (NFIP or private), and is the property in a SFHA with mandatory coverage?
- Why hasn't it sold? Are there any deal-killer items the seller is aware of (foundation, flood, title, zoning, code violations)?
- Is there a deadline driving the sale (1031 exchange, divorce, estate, relocation)? That informs how much negotiation room exists.
- Schools are D-rated, which usually means shorter tenancies and higher turnover. Who's the typical renter profile here, and what's been the actual vacancy rate?
- What's the average days-on-market for RENTAL listings here right now (not sales)? A rising rental-DOM trend means longer vacancies and softer asking-rent achievability than the comps imply.
- What's the recent tenant-quality profile in this submarket — average credit score on applications, eviction rate, late-payment / NSF rate, and stable-employment percentage? A property-management company in the area should have these aggregated.
- How much new for-sale + rental construction is in the pipeline within 1–3 miles? Heavy new supply typically softens prices + rents 12–24 months out; constrained supply supports both.
Investment metrics
- 1% rule
- 1.62% ✓
- Cap rate
- 11.48%
- Cash-on-cash
- 18.54%
- DSCR
- 1.82
- GRM
- 5.2
CMA / ARV
- ARV (on-the-fly)
- $140,300
- Comps found
- 1
Show comp detail 1 sale within ~0.75 mi
| Address | Dist | Beds/Ba | Sqft | Sold | Price | $/sf | Match |
|---|---|---|---|---|---|---|---|
| 117 Leonard St | 0.29mi | 3/1.0 (+1) | 1,260 (+10%) | 21mo | $154,000 | $122 | 48 |
Match score weights: distance 35% · size 25% · config 20% · recency 20%. Top-matched comps best support the ARV.
Projected returns pro-forma
10.0% appreciation · 3.0% rent growth · sell at horizon
- IRR
- 35.9%
- Equity multiple
- 3.78×
- Total profit
- $77,123
- Equity at exit
- $89,187
- IRR
- 31.0%
- Equity multiple
- 8.55×
- Total profit
- $209,305
- Equity at exit
- $192,335
Cash invested: $27,720 (down + closing). Projections, not guarantees.
Landlord ↔ Tenant lean methodology
- Overall (STATE)
- 15 Strongly Tenant-Friendly
- State New York
- 15 Strongly Tenant-Friendly · D+10
- County
- — inherits STATE
- City
- — inherits STATE
ZIP-level market 12783
- Home prices YoY
- 2.5%
- Active inventory
- 35
- Price-to-rent
- 5.2×
Monthly cashflow live
- Estimated rent
- $1,600 medium interval (Pro) →
- Mortgage (P&I)
- −$519
- Tax from tax record
- −$275 /mo · $3,303/yr
- Insurance
- −$41
- Flood insurance flood zone
- −$66 /mo · $798/yr
- HOA
- −$0
- Vacancy / Maint / Mgmt
- −$336
- Net cashflow
- $362
Break-even live
UW: 25.0% down · 7.5% · 30yr · 1.5% tax · 5.0% vac · 8.0% maint · 8.0% mgmt
Financing live
Cash to close
- Down payment
- $24,750
- Closing costs
- $2,970
- Reserves months
- —
- Total cash needed
- —
Loan-product check · same deal, 3 products live
Conventional
25% down · 7.5% · 30yr
- Down + closing
- —
- Monthly P&I
- —
- Monthly cashflow
- —
- DSCR
- —
- Eligible?
- —
Personal DTI + credit; lowest rate.
DSCR
20% down · 8.5% · 30yr
- Down + closing
- —
- Monthly P&I
- —
- Monthly cashflow
- —
- DSCR
- —
- Eligible?
- —
No personal income docs; deal must DSCR.
Hard money
10% down · 12.0% · 12mo
- Down + closing
- —
- Monthly P&I
- —
- Monthly cashflow
- —
- DSCR
- —
- Eligible?
- —
Short-term bridge; refi at stabilization.
Rent comps 1 comps
| Address | Beds | Baths | Sqft | Rent | $/sqft | DOM | Units | Dist |
|---|---|---|---|---|---|---|---|---|
| 318 E Main St Apt 2 Hancock, NY | 2.0 | 1.0 | 800 | $1,600 | $2.00 | 44d | 1 | 0.74mi |
Listing history 11 events
-
2025-04-22soldstatus $75,120
-
2025-03-11status Pending
-
2024-07-11$99,000 Active
-
2024-06-24historical
-
2023-12-28$109,000 Active
-
2023-11-03historical
-
2023-11-01price $109,000
-
2023-08-25price $115,000
-
2023-07-16price $125,000
-
2023-05-18price $140,000
-
2022-11-04$145,000 Active
ⓘ Source: listings_history table (triggers on properties + properties_extension) + one-shot
backfill from property_details.listing_events for pre-trigger history.
Tax reassessment forecast NY · Partial reset (capped growth)
- Current annual tax
- $3,303 · $275/mo
- Projected year-2 tax
- $3,303 · $275/mo
- Expected delta
- $0/yr ($0/mo · 0.0%)
ⓘ Screening estimate from a state-policy table — verify with the county assessor before closing.
Climate risk First Street
- Flood 8/10 Severe FEMA zone X (unshaded) · 99% chance over 30 yrs
- Wildfire 1/10 Low
- Heat 3/10 Moderate 8 d/yr ≥92°F today · 18 d/yr by 30 yrs out
- Wind 2/10 Low 100% chance of damaging wind over 30 yrs
- Air quality 2/10 Low 0 unhealthy d/yr today · 1 by 30 yrs out
Nearby sold comps map
Loading sold comps map…
Walkable amenities ~0.75 mi
Loading nearby amenities…
Taxation est. · year 1
- Rental income
- $19,200
- − Mortgage interest
- −$5,546
- − Property taxes
- −$3,303
- − Insurance
- −$1,292
- − Repairs & maintenance
- −$1,536
- − Management
- −$1,536
- − Depreciation
- −$2,880
- Taxable income
- $3,107
- Est. tax owed @ 24.0%
- −$746
- After-tax cash flow
- $3,597/yr
For passive investors: Depreciation is non-cash, so a rental often shows a tax loss while cash-flowing — sheltering income. Rental losses are passive: they offset passive income freely, and up to $25,000/yr can offset ordinary (W-2) income if you actively participate and your MAGI is under $100k (phasing out to $0 by $150k); unused losses carry forward. On sale, claimed depreciation is recaptured at up to 25%, and gains may owe capital-gains tax (a 1031 exchange can defer both). Figures are a year-1 estimate at your 24.0% rate — not tax advice; consult a CPA.
Schools (NCES district)
- District
- Hancock Central School District
- NCES district ID
- 3613560
- Math proficiency
- 40% ▬ 0.00%
- Reading proficiency
- 40% ▼ -10.00%
- Median HH income
- $40,208
- Composite
- 35.99/100
- National rank
- #9539
- State rank
- #649 of 755 in NY
Livability — Hancock
- Score
- 70/100
- State rank
- #454
- US rank
- #7935
Category grades
Schools grade is shown separately in the Schools card above.
Census & demographics
- Census place
- Hancock, NY
- Population (ZIP)
- 1,357
Population outlook (Delaware County) Hauer SSP2
- Today (2025)
- 42,668 people
- By 2030
- 40,337 · -5.5%
- By 2040
- 35,514 · -16.8%
- By 2050
- 31,265 · -26.7%
- By 2075
- 24,455 · -42.7%
- By 2100
- 19,529 · -54.2%
Race, ethnicity, and origin ACS 2023
- Neighborhood character
- Predominantly White (79%)
- Race & ethnicity
- White 79% Hispanic / Latino 13% Two or more races 6% Black 6%
- Hispanic origin (detail)
- Puerto Rican 7%
- Common ancestry
- Romanian 4% Danish 2% Scotch-Irish 2%
- Foreign-born
- 12% · Canada
- Languages at home
- 81% English-only · Other Indo-European 9% Spanish 5% Russian/Polish/Slavic 4%
Political lean MEDSL · Delaware
- 2024 margin
- R (+19.8) · D 40.1% · R 59.9%
- 2008→2024 swing
- -14.6pp toward R · 2008: -5.2pp · 2024: -19.8pp
- All cycles
- 2024: R+19.8 2020: R+18.4 2016: R+29.2 2012: R+9.6 2008: R+5.2
Not yet ingested
- Civics
- —
Market trends
- HPI YoY
- ▲ 10.43%
- Current HPI
- 433.2531
- Rent YoY
- —
- Metro
- —
- State GDP YoY
- ▲ 2.60%
- F500 in state
- 92
Industry mix (Fortune 500 HQ in NY)
| Industry | F500 HQs | Revenue |
|---|---|---|
| Financial Services | 10 | $950B |
|
||
| Consumer Goods | 9 | $162B |
|
||
| Insurance | 4 | $225B |
|
||
| Telecommunications | 2 | $144B |
|
||
| Pharmaceuticals | 2 | $112B |
|
||
| Media / Entertainment | 2 | $69B |
|
||
Price history
-48.2% since first listed11 events — show timeline
- 2025-04-22 Sold (Public Records) $75,120 Public Records
- 2025-03-11 Pending — GBAOR
- 2024-07-11 Listed $99,000 GBAOR
- 2024-06-24 Listing Removed — UNYREIS
- 2023-12-28 Listed $109,000 UNYREIS
- 2023-11-03 Listing Removed — UNYREIS
- 2023-11-01 Price Changed $109,000 UNYREIS
- 2023-08-25 Price Changed $115,000 UNYREIS
- 2023-07-16 Price Changed $125,000 UNYREIS
- 2023-05-18 Price Changed $140,000 UNYREIS
- 2022-11-04 Listed $145,000 UNYREIS
Property tax history
+5.3%/yrLatest (2025): $3,303 · +2.5% YoY. Source: county tax records.
Cash-flow waterfall
monthlySold comps — $/sqft
last 12 mo · ≤1 miLoading sold comps…