 Duplex
429/501 W Vance St · Tyler, TX
Flood risk 1/10 · Minimal
- FEMA flood zone
- X (unshaded)
- Chance of flooding over 30 yrs
- 0.0%
- Est. flood insurance / yr
- $507 – $1,088
Fire risk 3/10 · Minor
- Est. fire insurance / yr
- $1,222 – $2,270
Heat risk 6/10 · Moderate
- Hot days now (above 110°F)
- 7 days/yr
- Hot days in 30 yrs
- 26 days/yr
Wind risk 6/10 · Moderate
- Chance of severe wind over 30 yrs
- 63.0%
Air-quality risk 2/10 · Minimal
- Unhealthy air days now
- 0 days/yr
- Unhealthy air days in 30 yrs
- 1 days/yr
Risk factors via First Street. Map © Google.
Why this score? — see what drove the C- grade
The composite is a weighted blend of 9 inputs, each scored 0–100. Each bar is that input's sub-score; the figure is the points it added to the 100-point composite (weight × sub-score).
- Cash flow +20.1/30.0
- ARV discount +7.5/15.0
- DSCR +6.4/10.0
- 1% rule +5.3/10.0
- Condition / age +4.8/5.0
- Livability +3.8/5.0
- Schools +3.3/10.0
- Rent growth +3.1/5.0
- Appreciation +0.0/10.0
$329,000
🖨 Deal sheet (PDF) 📄 Offer letter ✓ Due diligence
Multi-family units
County records classify this as Multi-Family (2-4 Unit). Listing-text estimate: 2 units. confirmed
Listing remarks
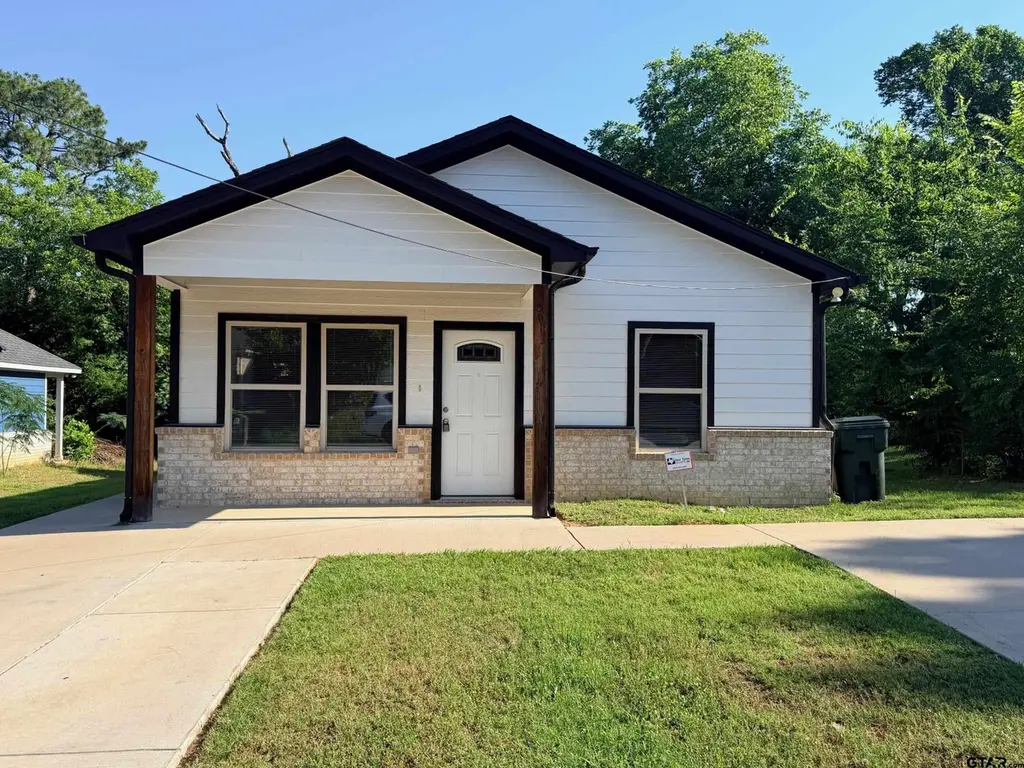
Exceptional investment opportunity in Tyler, Texas! Built in 2021, this well-maintained duplex offers immediate cash flow with both units 100% occupied and generating monthly rental income. Featuring a combined total of 5 bedrooms and 3.5 bathrooms, this modern duplex is designed to attract and retain tenants with desirable finishes and functional layouts. Each unit offers beautiful granite countertops, spacious living areas, and convenient laundry closets. The newer construction provides peace of mind with reduced maintenance concerns and contemporary features today's renters appreciate. Conveniently located within the Douglas Elementary, Moore Middle School, and Tyler High School attendan
Key facts
- Newer construction
- Modern duplex
- Granite countertops
Tags
Property features AI
Finance
- Financial info: Residential income property (duplex)
Exterior
- Parking: Concrete parking surface
- Security: Smoke detector(s)
- Utilities: Public water; Public sewer
- Home design: Duplex; Single-story
- Construction: Brick veneer construction; Composition roof
- Exterior features: Covered patio/porch; Lot about 59' x 137'; Zoned for multi-family dwelling
Interior
- Kitchen: Dishwasher; Electric oven; Electric range; Refrigerator; Microwave; Range
- Flooring: Vinyl; Wood
- Heating & cooling: Central heating (electric); Central air conditioning; Ceiling fan(s)
- Interior features: Dishwasher; Electric oven; Electric range; Refrigerator; Microwave; Range; Vinyl flooring; Wood flooring
Neighborhood map
What this means for you Summary
Snapshot
- This is a 2 × 5.0-bed/3.5-bath units multifamily listed at $329k. Condition is rated excellent.
Deal economics
- At list price, monthly cash flow is $408 ($5k/yr) — positive. Per door: $204/mo.
- The deal already cash-flows at list — no discount required.
- Meets the 1% rule at list price ($3k rent vs $329k).
- Recommended offer: $324k (1.5% below list) — sets the bar for market timing.
- Cap rate 7.8% vs local median 3.6% in Tyler — top-decile yield for the area; either an underpriced asset or a hidden risk that comps aren't pricing in. Stress-test before assuming the spread holds.
Location & tenants
- Location reads 75/100 on livability (#147 in TX, #4,181 nationally) — a middle-class / working-renter tenant base. Strengths: cost of living A+, housing A+, health & safety A+; Watch: employment C-, crime D+, commute F.
- Tyler ISD (urban): math 39% / reading 38% proficiency, ranked #449 of 826 in TX (top 54%) — families likely to look elsewhere, expect single-tenant / working-renter base with shorter leases; 66% free/reduced lunch — lower-income household profile, screen leases tightly.
- Zoned schools: Douglas El (math 45% / reading 27%, grade F, #1,921 of 4,322 statewide, top 45%, 585 students, 97% FRL); Moore Mst Magnet School (math 46% / reading 39%, grade D-, #553 of 1,662 statewide, top 34%, 1,113 students, 87% FRL); Tyler H S (math 26% / reading 27%, grade F, #1,228 of 1,632 statewide, top 76%, 2,164 students, 90% FRL) — zoned schools average 91% FRL vs 66% district-wide (25 pts higher); higher-poverty schools than district average — tighter screening recommended.
- Market conditions: Rents rising (+2.3%/yr); 155 active listings in the ZIP; 595 units permitted in Smith County in 2024 (45 in 5+ unit buildings).
- At $3,394/mo this rent would consume 79% of the median local household income ($52k/yr) (locally 803% of renters already pay >50% of income on rent) — very limited rent-growth headroom before tenants either downsize or default.
Forward outlook
- Local home prices are declining (-3.0%/yr); year-one equity from $2k of loan paydown is wiped out by about $10k of value loss. Plan a longer hold.
- Smith County population projected at +24% by 2050 — long-run rental-demand tailwind backs the buy-and-hold thesis.
Negotiation context
- It's been on market 18 days — a 2% lower offer ($324k) is reasonable based on typical stale-listing flexibility.
Risks & watch-outs
- Climate carrying-cost: major wind risk, 63% chance of damaging wind over 30y; extreme-heat days projected 7→26/yr by 2055 (HVAC capex compounding) — expect insurance premiums to compound above CPI over the hold.
Questions for the listing agent
- Can we see the unit-by-unit rent roll, current vacancy, and any below-market leases? What's the average tenancy length?
- What capital expenditures (roof, boiler, parking lot, exteriors) have been made in the last 5 years, and what's planned in the next 2?
- Is there a deadline driving the sale (1031 exchange, divorce, estate, relocation)? That informs how much negotiation room exists.
- Schools are D-rated, which usually means shorter tenancies and higher turnover. Who's the typical renter profile here, and what's been the actual vacancy rate?
- Crime grade is D in this area — have there been break-ins, vandalism, or insurance claims at this property in the last 3 years? What carrier currently insures it and at what premium?
- What's the average days-on-market for RENTAL listings here right now (not sales)? A rising rental-DOM trend means longer vacancies and softer asking-rent achievability than the comps imply.
- What's the recent tenant-quality profile in this submarket — average credit score on applications, eviction rate, late-payment / NSF rate, and stable-employment percentage? A property-management company in the area should have these aggregated.
- How much new apartment / multifamily construction is in the pipeline within 1–3 miles? Heavy new supply (>2% of stock underway) typically softens rents 12–24 months out; light construction supports rent growth.
Investment metrics
- 1% rule
- 1.03% ✓
- Cap rate
- 7.78%
- Cash-on-cash
- 5.31%
- DSCR
- 1.24
- GRM
- 8.1
CMA / ARV
No comps found within radius.
Projected returns pro-forma
-3.0% appreciation · 2.27% rent growth · sell at horizon
- IRR
- -8.9%
- Equity multiple
- 0.68×
- Total profit
- $-29,775
- Equity at exit
- $49,055
- IRR
- -0.4%
- Equity multiple
- 0.98×
- Total profit
- $-2,298
- Equity at exit
- $28,446
Cash invested: $92,120 (down + closing). Projections, not guarantees.
Landlord ↔ Tenant lean methodology
- Overall (STATE)
- 87 Strongly Landlord-Friendly
- State Texas
- 87 Strongly Landlord-Friendly · R+5
- County
- — inherits STATE
- City
- — inherits STATE
ZIP-level market 75702
- Home prices YoY
- -5.8%
- Rents YoY
- 2.3%
- Active inventory
- 155
- Price-to-rent
- 16.2×
Monthly cashflow live
- Estimated rent
- $3,394 medium interval (Pro) →
- Mortgage (P&I)
- −$1,725
- Tax est. 1.5%
- −$411 /mo · $4,935/yr
- Insurance
- −$137
- HOA
- −$0
- Vacancy / Maint / Mgmt
- −$713
- Net cashflow
- $408
Break-even live
Sensitivity live
| Price | -10% $635 | -5% $521 | +0% $408 | +5% $294 | +10% $180 |
|---|---|---|---|---|---|
| Rent | -10% $139 | -5% $274 | +0% $408 | +5% $542 | +10% $676 |
| Rate | -1.0pp $573 | -0.5pp $491 | base $408 | +0.5pp $322 | +1.0pp $236 |
2-unit breakdown (identical units grouped — click to expand)
| Units | Beds | Baths | Est. rent |
|---|---|---|---|
| 2× units | 5.0 | 3.5 | $3,394 |
| #1 | 5.0 | 3.5 | $1,697 |
| #2 | 5.0 | 3.5 | $1,697 |
| Total (2 units) | $3,394 | ||
UW: 25.0% down · 7.5% · 30yr · 1.5% tax · 5.0% vac · 8.0% maint · 8.0% mgmt
Financing live
Cash to close
- Down payment
- $82,250
- Closing costs
- $9,870
- Reserves months
- —
- Total cash needed
- —
Loan-product check · same deal, 3 products live
Conventional
25% down · 7.5% · 30yr
- Down + closing
- —
- Monthly P&I
- —
- Monthly cashflow
- —
- DSCR
- —
- Eligible?
- —
Personal DTI + credit; lowest rate.
DSCR
20% down · 8.5% · 30yr
- Down + closing
- —
- Monthly P&I
- —
- Monthly cashflow
- —
- DSCR
- —
- Eligible?
- —
No personal income docs; deal must DSCR.
Hard money
10% down · 12.0% · 12mo
- Down + closing
- —
- Monthly P&I
- —
- Monthly cashflow
- —
- DSCR
- —
- Eligible?
- —
Short-term bridge; refi at stabilization.
Listing history 12 events
-
2026-06-19days on market $329,000 Active 18 DOM
-
2026-06-18days on market $329,000 Active 17 DOM
-
2026-06-17days on market $329,000 Active 16 DOM
-
2026-06-16days on market $329,000 Active 15 DOM
-
2026-06-15days on market $329,000 Active 14 DOM
-
2026-06-14days on market $329,000 Active 12 DOM
-
2026-06-13days on market $329,000 Active 11 DOM
-
2026-06-10days on market $329,000 Active 9 DOM
-
2026-06-09days on market $329,000 Active 8 DOM
-
2026-06-08days on market $329,000 Active 7 DOM
-
2026-06-07remarks 699-char remark
-
2026-06-07$329,000 Active 6 DOM
ⓘ Source: listings_history table (triggers on properties + properties_extension) + one-shot
backfill from property_details.listing_events for pre-trigger history.
Climate risk First Street
- Flood 1/10 Low FEMA zone X (unshaded) · 0% chance over 30 yrs
- Wildfire 3/10 Moderate
- Heat 6/10 Major 7 d/yr ≥110°F today · 26 d/yr by 30 yrs out
- Wind 6/10 Major 63% chance of damaging wind over 30 yrs
- Air quality 2/10 Low 0 unhealthy d/yr today · 1 by 30 yrs out
Nearby sold comps map
Loading sold comps map…
Walkable amenities ~0.75 mi
Loading nearby amenities…
Taxation est. · year 1
- Rental income
- $40,728
- − Mortgage interest
- −$18,429
- − Property taxes
- −$4,935
- − Insurance
- −$1,645
- − Repairs & maintenance
- −$3,258
- − Management
- −$3,258
- − Depreciation
- −$9,571
- Taxable loss
- −$369
- Est. tax savings @ 24.0%
- +$88
- After-tax cash flow
- $4,980/yr
For passive investors: Depreciation is non-cash, so a rental often shows a tax loss while cash-flowing — sheltering income. Rental losses are passive: they offset passive income freely, and up to $25,000/yr can offset ordinary (W-2) income if you actively participate and your MAGI is under $100k (phasing out to $0 by $150k); unused losses carry forward. On sale, claimed depreciation is recaptured at up to 25%, and gains may owe capital-gains tax (a 1031 exchange can defer both). Figures are a year-1 estimate at your 24.0% rate — not tax advice; consult a CPA.
Condition & rehab AI · 13 photos
This well-maintained and modern two-unit duplex in Tyler, Texas, is ready for immediate rental or sale with no major repairs needed. It offers a great investment opportunity with immediate cash flow and desirable finishes.
Value-add opportunities
- Both Landscaping improvements — Enhanced curb appeal can attract more tenants and buyers.
- Both Painting exterior and interior walls — Fresh paint can improve the home's appearance and value.
Renovation cost estimate screening
Value-add ROI direction
- Both Landscaping improvements — Enhanced curb appeal can attract more tenants and buyers. ↑
- Both Painting exterior and interior walls — Fresh paint can improve the home's appearance and value. ↑
ⓘ Cost ranges are severity-bucket heuristics (US national rule-of-thumb). Get contractor quotes + a written scope before underwriting a rehab budget.
Schools (NCES district)
- District
- Tyler ISD
- NCES district ID
- 4843470
- Math proficiency
- 39% ▼ -4.00%
- Reading proficiency
- 38% ▼ -1.00%
- Median HH income
- $44,090
- Composite
- 32.69/100
- National rank
- #5650
- State rank
- #449 of 826 in TX
Livability — Tyler
- Score
- 75/100
- State rank
- #147
- US rank
- #4181
Category grades
Schools grade is shown separately in the Schools card above.
Census & demographics
- Census place
- Tyler, TX
- County
- Smith County · 180,570 people
- City population
- 127,842
- Metro
- Tyler, TX
- Population (ZIP)
- 27,927
- Household income
- $51,564
- Rent vs Own
- Severe rent burden
- 803.0
Population outlook (Smith County) Hauer SSP2
- Today (2025)
- 248,890 people
- By 2030
- 261,665 · +5.1%
- By 2040
- 286,114 · +15.0%
- By 2050
- 308,006 · +23.8%
- By 2075
- 354,171 · +42.3%
- By 2100
- 372,828 · +49.8%
Race, ethnicity, and origin ACS 2023
- Neighborhood character
- Diverse neighborhood (Simpson 0.61)
- Race & ethnicity
- Hispanic / Latino 49% Black 37% White 12% Two or more races 11% Native American 1%
- Hispanic origin (detail)
- Mexican 47%
- Common ancestry
- Lithuanian 1%
- Foreign-born
- 20% · Canada
- Languages at home
- 56% English-only · Spanish 44%
Political lean MEDSL · Smith
- 2024 margin
- Solid R (+45.1) · D 27.0% · R 72.1%
- 2008→2024 swing
- -5.6pp toward R · 2008: -39.5pp · 2024: -45.1pp
- All cycles
- 2024: R+45.1 2020: R+39.4 2016: R+43.9 2012: R+46.9 2008: R+39.5
Not yet ingested
- Civics
- —
Market trends
- HPI YoY
- ▼ -12.63%
- Current HPI
- 207.1573
- Rent YoY
- ▲ 2.27%
- Metro
- Tyler, TX
- State GDP YoY
- ▲ 3.95%
- F500 in state
- 110
Industry mix (Fortune 500 HQ in TX)
| Industry | F500 HQs | Revenue |
|---|---|---|
| Energy | 16 | $1,198B |
|
||
| Technology | 5 | $198B |
|
||
| Engineering / Construction | 4 | $72B |
|
||
| Energy Services | 3 | $60B |
|
||
| Utilities | 3 | $41B |
|
||
| Healthcare | 2 | $330B |
|
||
Price history
2 events — show timeline
- 2026-06-01 Listed $329,000 GTAR
- 2023-07-06 Rental Removed — RENT.
Cash-flow waterfall
monthlySold comps — $/sqft
last 12 mo · ≤1 miLoading sold comps…