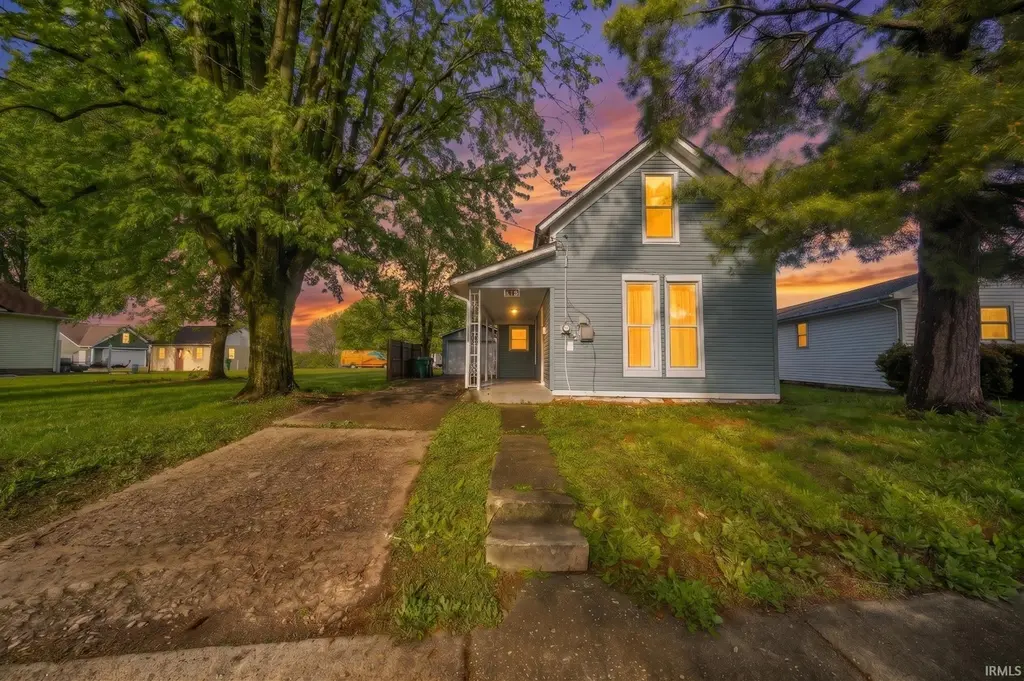
713 N Main St · New Castle, IN
Flood risk 1/10 · Minimal
- FEMA flood zone
- X (unshaded)
- Chance of flooding over 30 yrs
- 0.0%
- Est. flood insurance / yr
- $473 – $860
Fire risk 1/10 · Minimal
- Est. fire insurance / yr
- $717 – $1,331
Heat risk 3/10 · Minor
- Hot days now (above 99°F)
- 7 days/yr
- Hot days in 30 yrs
- 18 days/yr
Wind risk 2/10 · Minimal
- Chance of severe wind over 30 yrs
- 1.0%
Air-quality risk 2/10 · Minimal
- Unhealthy air days now
- 1 days/yr
- Unhealthy air days in 30 yrs
- 2 days/yr
Risk factors via First Street. Map © Google.
Why this score? — see what drove the C+ grade
The composite is a weighted blend of 9 inputs, each scored 0–100. Each bar is that input's sub-score; the figure is the points it added to the 100-point composite (weight × sub-score).
- Cash flow +23.0/30.0
- ARV discount +15.0/15.0
- DSCR +7.4/10.0
- 1% rule +5.6/10.0
- Livability +3.8/5.0
- Rent growth +3.6/5.0
- Schools +2.7/10.0
- Condition / age +2.5/5.0
- Appreciation +0.0/10.0
$89,900
🖨 Deal sheet 📄 Offer letter ✓ Due diligence
Listing remarks MLS
20 years of Investing in New Castle: Ready for New Owner. House #3 in a 6 house Investor Package Deal. 1.5 story home; 2 beds, 1 bath. 1 car detached garage with concrete drive. Gorgeous hardwoods. Covered front porch. Full basement. Last rented for $475/mo (tenants pay all utilities).
Key facts
- Private yard
- Updated kitchen
- Updated bathroom
Tags
Property features AI
Finance
- Other: Lot roughly 0.3 acres (100 x 132)
- HOA & community: No association amenities
Exterior
- Parking: Detached concrete garage with 1 garage space
- Utilities: Public water; Public sewer; Cable available
- Home design: Single-family residence; Site-built home; One story
- Construction: Vinyl siding; Stone foundation; Shingle roof; Built as site-built home
- Exterior features: Enclosed porch; Partial privacy wood fencing; Level lot
Interior
- Kitchen: Refrigerator; Electric range
- Flooring: Carpet; Laminate
- Bathrooms: One full bathroom
- Heating & cooling: Electric heating; Baseboard heating; Forced air heating; No cooling
- Interior features: Eat-in kitchen; Laminate counters; One fireplace (no specified features)
- Laundry & utility: Washer hookup on main level; Electric dryer hookup on main level; Gas water heater
Neighborhood map
What this means for you Summary
Snapshot
- This is a 2-bed/1.0-bath single-family listed at $90k.
Deal economics
- At list price, monthly cash flow is $159 ($2k/yr) — positive.
- The deal already cash-flows at list — no discount required.
- Meets the 1% rule at list price ($951 rent vs $90k).
- Recommended offer: $89k (1.5% below list) — sets the bar for market timing.
- Cap rate 8.4% vs local median 4.8% in New Castle — top-decile yield for the area; either an underpriced asset or a hidden risk that comps aren't pricing in. Stress-test before assuming the spread holds.
Location & tenants
- Location reads 75/100 on livability (#64 in IN, #4,219 nationally) — a middle-class / working-renter tenant base. Strengths: crime A+, cost of living A+, housing A+; Watch: amenities F, commute F, employment D-.
- New Castle Community School Corporation (town): math 30% / reading 35% proficiency, ranked #229 of 301 in IN (top 76%) — families likely to look elsewhere, expect single-tenant / working-renter base with shorter leases.
- Zoned schools: Wilbur Wright Elementary School (math 32% / reading 37%, grade F, #597 of 994 statewide, top 63%, 294 students, 77% FRL); New Castle Middle School (math 20% / reading 31%, grade F, #243 of 330 statewide, top 74%, 666 students, 61% FRL); New Castle High School (math 27% / reading 52%, grade F, #221 of 369 statewide, top 63%, 836 students, 56% FRL).
- Market conditions: Rents rising fast (+4.6%/yr); 214 active listings in the ZIP; 3 comparable units currently listed for rent nearby; rentals at typical pace (median 24d on market — plan ~3-4 weeks tenant-placement turnaround); 47 units permitted in Henry County in 2024 (0 in 5+ unit buildings).
Forward outlook
- Local home prices are declining (-3.0%/yr); year-one equity from $622 of loan paydown is wiped out by about $3k of value loss. Plan a longer hold.
- Henry County population projected at -12% by 2050 — secular population decline; favor cash flow + early exit over multi-decade hold.
Negotiation context
- It's been on market 16 days — a 2% lower offer ($89k) is reasonable based on typical stale-listing flexibility.
- 5 sale attempts since 27y ago; this cycle's ask has dropped $20k (18%) from the opening price — seller is motivated, your offer sets the floor, not the list.
- Current owner paid $32k; list at $90k implies a 177% gain — meaningful room to come down on a strong offer.
Risks & watch-outs
- Watch-outs: built in 1900 — expect roof / HVAC / electrical / plumbing capex.
Questions for the listing agent
- Built in 1900 — when were the roof, HVAC, electrical panel, plumbing, and water heater last replaced?
- Is there a deadline driving the sale (1031 exchange, divorce, estate, relocation)? That informs how much negotiation room exists.
- Schools are D-rated, which usually means shorter tenancies and higher turnover. Who's the typical renter profile here, and what's been the actual vacancy rate?
- What's the average days-on-market for RENTAL listings here right now (not sales)? A rising rental-DOM trend means longer vacancies and softer asking-rent achievability than the comps imply.
- What's the recent tenant-quality profile in this submarket — average credit score on applications, eviction rate, late-payment / NSF rate, and stable-employment percentage? A property-management company in the area should have these aggregated.
- How much new for-sale + rental construction is in the pipeline within 1–3 miles? Heavy new supply typically softens prices + rents 12–24 months out; constrained supply supports both.
Investment metrics
- 1% rule
- 1.06% ✓
- Cap rate
- 8.42%
- Cash-on-cash
- 7.58%
- DSCR
- 1.34
- GRM
- 7.9
CMA / ARV
- ARV (median comp)
- $108,169
- List price
- $89,900
- Delta
- -16.89%
- Verdict
- UNDERPRICED
- Comps
- 20 within 1.0 mi
Show comp detail 8 sales within ~0.75 mi
| Address | Dist | Beds/Ba | Sqft | Sold | Price | $/sf | Match |
|---|---|---|---|---|---|---|---|
| 716 N 14th St | 0.35mi | 3/2.0 (+1) | 1,196 (-0%) | 0mo | $162,900 | $136 | 74 |
| 595 N Main St | 0.28mi | 2/1.0 | 1,140 (-5%) | 7mo | $102,900 | $90 | 73 |
| 731 N Main St | 0.04mi | 3/1.0 (+1) | 1,159 (-3%) | 23mo | $139,900 | $121 | 69 |
| 1505 Garner St | 0.24mi | 2/1.0 | 1,191 (-1%) | 23mo | $115,000 | $97 | 69 |
| 1228 Woodward Ave | 0.44mi | 2/1.0 | 1,066 (-11%) | 11mo | $82,500 | $77 | 52 |
| 1522 Michigan St | 0.42mi | 2/1.5 | 1,040 (-13%) | 7mo | $74,500 | $72 | 50 |
| 1707 Woodward Ave | 0.68mi | 3/1.5 (+1) | 1,125 (-6%) | 5mo | $138,000 | $123 | 47 |
| 320 N 17th St | 0.74mi | 3/1.0 (+1) | 1,116 (-7%) | 23mo | $70,000 | $63 | 30 |
Match score weights: distance 35% · size 25% · config 20% · recency 20%. Top-matched comps best support the ARV.
Projected returns pro-forma
-3.0% appreciation · 4.59% rent growth · sell at horizon
- IRR
- -3.0%
- Equity multiple
- 0.88×
- Total profit
- $-2,895
- Equity at exit
- $13,404
- IRR
- 8.3%
- Equity multiple
- 1.68×
- Total profit
- $17,059
- Equity at exit
- $7,773
Cash invested: $25,172 (down + closing). Projections, not guarantees.
Landlord ↔ Tenant lean methodology
- Overall (STATE)
- 90 Strongly Landlord-Friendly
- State Indiana
- 90 Strongly Landlord-Friendly · R+11
- County
- — inherits STATE
- City
- — inherits STATE
ZIP-level market 47362
- Home prices YoY
- -16.0%
- Rents YoY
- 4.6%
- Active inventory
- 214
- Price-to-rent
- 7.9×
Monthly cashflow live
- Estimated rent
- $951 medium interval (Pro) →
- Mortgage (P&I)
- −$471
- Tax from tax record
- −$83 /mo · $996/yr
- Insurance
- −$37
- HOA
- −$0
- Vacancy / Maint / Mgmt
- −$200
- Net cashflow
- $159
Break-even live
UW: 25.0% down · 7.5% · 30yr · 1.5% tax · 5.0% vac · 8.0% maint · 8.0% mgmt
Financing live
Cash to close
- Down payment
- $22,475
- Closing costs
- $2,697
- Reserves months
- —
- Total cash needed
- —
Loan-product check · same deal, 3 products live
Conventional
25% down · 7.5% · 30yr
- Down + closing
- —
- Monthly P&I
- —
- Monthly cashflow
- —
- DSCR
- —
- Eligible?
- —
Personal DTI + credit; lowest rate.
DSCR
20% down · 8.5% · 30yr
- Down + closing
- —
- Monthly P&I
- —
- Monthly cashflow
- —
- DSCR
- —
- Eligible?
- —
No personal income docs; deal must DSCR.
Hard money
10% down · 12.0% · 12mo
- Down + closing
- —
- Monthly P&I
- —
- Monthly cashflow
- —
- DSCR
- —
- Eligible?
- —
Short-term bridge; refi at stabilization.
Rent comps 3 comps
| Address | Beds | Baths | Sqft | Rent | $/sqft | DOM | Units | Dist |
|---|---|---|---|---|---|---|---|---|
| 1402 Alabama St New Castle, IN | 2.0 | 1.0 | 912 | $795 | $0.87 | 24d | 1 | 0.19mi |
| 2018 N 16th St New Castle, IN | 3.0 | 1.0 | 1300 | $1,450 | $1.12 | 44d | 1 | 0.68mi |
| 940 S 15th St New Castle, IN | 1.0–2.0 | 1.0–1.5 | 816 | $1,075 | $1.32 | 2d | 2 | 1.39mi |
Listing history 8 events
-
2026-05-06$109,900 Active 706-char remark
-
2026-05-06$109,900 Active
-
2022-01-10soldstatus $32,500
Show marketing remark (286 chars)
20 years of Investing in New Castle: Ready for New Owner. House #3 in a 6 house Investor Package Deal. 1.5 story home; 2 beds, 1 bath. 1 car detached garage with concrete drive. Gorgeous hardwoods. Covered front porch. Full basement. Last rented for $475/mo (tenants pay all utilities).
-
2021-07-29$37,900
Show marketing remark (286 chars)
20 years of Investing in New Castle: Ready for New Owner. House #3 in a 6 house Investor Package Deal. 1.5 story home; 2 beds, 1 bath. 1 car detached garage with concrete drive. Gorgeous hardwoods. Covered front porch. Full basement. Last rented for $475/mo (tenants pay all utilities).
-
2000-09-05soldstatus $28,000
-
2000-03-27$29,900
-
1999-11-02historical
-
1999-08-02$45,000
ⓘ Source: listings_history table (triggers on properties + properties_extension) + one-shot
backfill from property_details.listing_events for pre-trigger history.
Tax reassessment forecast IN · Partial reset (capped growth)
- Current annual tax
- $996 · $83/mo
- Projected year-2 tax
- $996 · $83/mo
- Expected delta
- $0/yr ($0/mo · 0.0%)
ⓘ Screening estimate from a state-policy table — verify with the county assessor before closing.
Climate risk First Street
- Flood 1/10 Low FEMA zone X (unshaded) · 0% chance over 30 yrs
- Wildfire 1/10 Low
- Heat 3/10 Moderate 7 d/yr ≥99°F today · 18 d/yr by 30 yrs out
- Wind 2/10 Low 100% chance of damaging wind over 30 yrs
- Air quality 2/10 Low 1 unhealthy d/yr today · 2 by 30 yrs out
Nearby sold comps map
Loading sold comps map…
Walkable amenities ~0.75 mi
Loading nearby amenities…
Taxation est. · year 1
- Rental income
- $11,407
- − Mortgage interest
- −$5,036
- − Property taxes
- −$996
- − Insurance
- −$450
- − Repairs & maintenance
- −$913
- − Management
- −$913
- − Depreciation
- −$2,615
- Taxable income
- $486
- Est. tax owed @ 24.0%
- −$117
- After-tax cash flow
- $1,792/yr
For passive investors: Depreciation is non-cash, so a rental often shows a tax loss while cash-flowing — sheltering income. Rental losses are passive: they offset passive income freely, and up to $25,000/yr can offset ordinary (W-2) income if you actively participate and your MAGI is under $100k (phasing out to $0 by $150k); unused losses carry forward. On sale, claimed depreciation is recaptured at up to 25%, and gains may owe capital-gains tax (a 1031 exchange can defer both). Figures are a year-1 estimate at your 24.0% rate — not tax advice; consult a CPA.
Schools (NCES district)
- District
- New Castle Community School Corporation
- NCES district ID
- 1807440
- Math proficiency
- 30% ▼ -13.00%
- Reading proficiency
- 35% ▼ -9.00%
- Median HH income
- $36,717
- Composite
- 26.99/100
- National rank
- #7067
- State rank
- #229 of 301 in IN
Livability — New Castle
- Score
- 75/100
- State rank
- #64
- US rank
- #4219
Category grades
Schools grade is shown separately in the Schools card above.
Census & demographics
- Census place
- New Castle, IN
- County
- Henry County · 29,337 people
- City population
- 29,337
- Metro
- New Castle, IN
- Population (ZIP)
- 29,337
- Household income
- $60,258
- Rent vs Own
- Severe rent burden
- 545.0
Population outlook (Henry County) Hauer SSP2
- Today (2025)
- 48,028 people
- By 2030
- 47,125 · -1.9%
- By 2040
- 44,820 · -6.7%
- By 2050
- 42,207 · -12.1%
- By 2075
- 35,814 · -25.4%
- By 2100
- 26,779 · -44.2%
Race, ethnicity, and origin ACS 2023
- Neighborhood character
- Predominantly White (90%)
- Race & ethnicity
- White 90% Two or more races 3% Black 3% Hispanic / Latino 3%
- Common ancestry
- Italian 2% Slovak 1% Lithuanian 1%
- Foreign-born
- 2% · Canada
- Languages at home
- 97% English-only · Spanish 2%
Political lean MEDSL · Henry
- 2024 margin
- Solid R (+47.7) · D 25.3% · R 73.0% · Other 1.7%
- 2008→2024 swing
- -43.8pp toward R · 2008: -3.9pp · 2024: -47.7pp
- All cycles
- 2024: R+47.7 2020: R+45.2 2016: R+43.7 2012: R+17.0 2008: R+3.9
Not yet ingested
- Civics
- —
Market trends
- HPI YoY
- ▼ -43.70%
- Current HPI
- 228.8885
- Rent YoY
- ▲ 4.59%
- Metro
- New Castle, IN
- State GDP YoY
- ▲ 2.90%
- F500 in state
- 18
Industry mix (Fortune 500 HQ in IN)
| Industry | F500 HQs | Revenue |
|---|---|---|
| Industrial Machinery | 2 | $37B |
|
||
| Healthcare | 1 | $177B |
|
||
| Pharmaceuticals | 1 | $45B |
|
||
| Metals / Steel | 1 | $18B |
|
||
| Agriculture | 1 | $17B |
|
||
| Packaging | 1 | $12B |
|
||
Price history
+99.8% since first listed11 events — show timeline
- 2026-05-22 Pending — IRMLS
- 2026-05-19 Price Changed $89,900 IRMLS
- 2026-05-19 Price Changed $89,900 MIBOR as Distributed by MLS Grid
- 2026-05-06 Listed $109,900 IRMLS
- 2026-05-06 Listed $109,900 MIBOR as Distributed by MLS Grid
- 2022-01-10 Sold (MLS) $32,500 IRMLS
- 2021-07-29 Listed $37,900 IRMLS
- 2000-09-05 Sold (MLS) $28,000 MIBOR as Distributed by MLS Grid
- 2000-03-27 Listed $29,900 MIBOR as Distributed by MLS Grid
- 1999-11-02 Listing Removed — MIBOR as Distributed by MLS Grid
- 1999-08-02 Listed $45,000 MIBOR as Distributed by MLS Grid
Property tax history
-4.1%/yrLatest (2024): $996 · +7.6% YoY. Source: county tax records.
Cash-flow waterfall
monthlySold comps — $/sqft
last 12 mo · ≤1 miLoading sold comps…