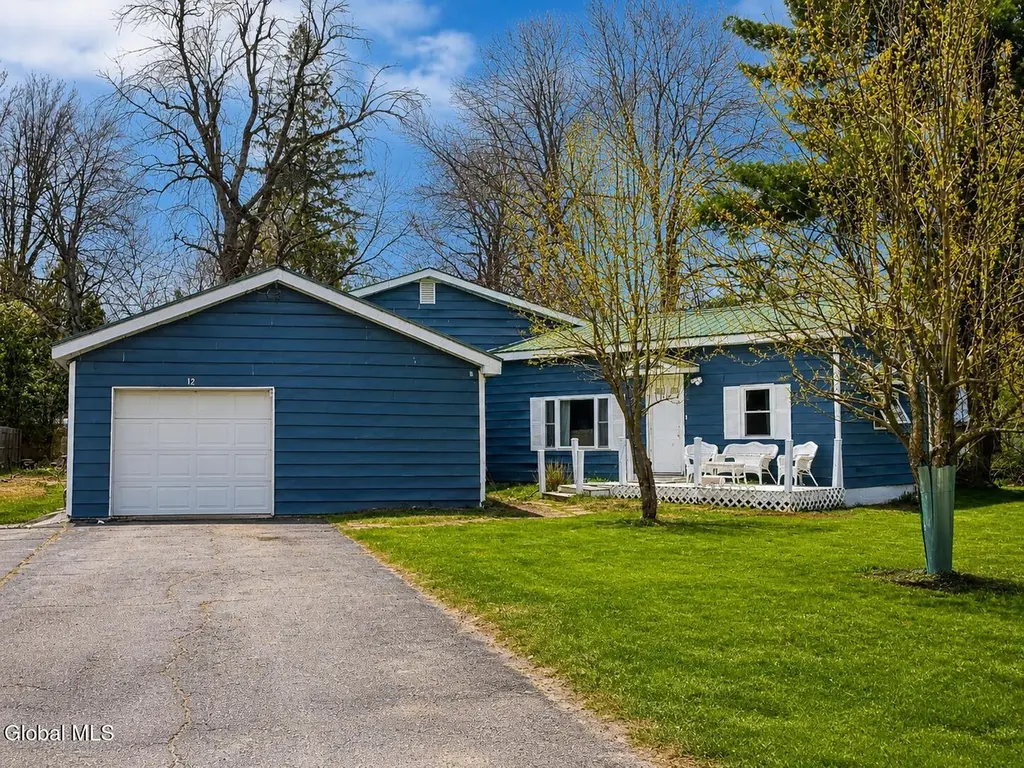
12 Cline Dr · Massena, NY
Flood risk 1/10 · Minimal
- FEMA flood zone
- —
- Chance of flooding over 30 yrs
- 0.0%
- Est. flood insurance / yr
- —
Fire risk 3/10 · Minor
- Est. fire insurance / yr
- $691 – $1,283
Heat risk 2/10 · Minimal
- Hot days now (above 94°F)
- 7 days/yr
- Hot days in 30 yrs
- 15 days/yr
Wind risk 1/10 · Minimal
- Chance of severe wind over 30 yrs
- —
Air-quality risk 2/10 · Minimal
- Unhealthy air days now
- 1 days/yr
- Unhealthy air days in 30 yrs
- 1 days/yr
Risk factors via First Street. Map © Google.
Why this score? — see what drove the C- grade
The composite is a weighted blend of 9 inputs, each scored 0–100. Each bar is that input's sub-score; the figure is the points it added to the 100-point composite (weight × sub-score).
- Cash flow +26.2/30.0
- DSCR +8.9/10.0
- 1% rule +7.2/10.0
- Schools +3.9/10.0
- Livability +3.7/5.0
- Rent growth +2.5/5.0
- Condition / age +2.5/5.0
- ARV discount +0.0/15.0
- Appreciation +0.0/10.0
$77,700
🖨 Deal sheet 📄 Offer letter ✓ Due diligence
Listing remarks
Charming single family home offers comfort, convenience, and a beautiful setting in the heart of Massena. Set on a 0.34 acre lot, this property provides a peaceful residential feel while keeping you close to everything the town has to offer. Step inside to find easy, functional living space with laminate flooring, an efficient mix of electric and gas heating, and an attached garage for year round convenience . The layout is ideal for anyone seeking manageable living with room to personalize. Outside, the lot is a standout--open, green, and beautifully sized, offering space for gardening, outdoor seating, or simply enjoying the quiet surroundings. It's the perfect blend of neighborhood livin
Key facts
- Attached garage
- Open green lot
- Prime location
Tags
Property features AI
Exterior
- Parking: Attached garage with 2 spaces; 4 total parking spaces; Off-street parking; Workshop and storage space in garage; Paved parking
- Utilities: Public water; Public sewer
- Home design: Single family residence; Metal roof; Vinyl siding
- Construction: Vinyl siding construction; Metal roof; Slab foundation
- Exterior features: Porch; Paved driveway; Garden
Interior
- Kitchen: Electric oven; Microwave; Refrigerator
- Bedrooms: Bedroom on first level; Bedroom on first level
- Bathrooms: 2 full bathrooms (both on the first level)
- Interior features: High speed internet; 7 total rooms; Slab basement
- Laundry & utility: Main-level laundry room; Washer; Dryer
Neighborhood map
What this means for you Summary
Snapshot
- This is a 2-bed/2.0-bath manufactured listed at $78k.
Deal economics
- At list price, monthly cash flow is $199 ($2k/yr) — positive.
- The deal already cash-flows at list — no discount required.
- Meets the 1% rule at list price ($946 rent vs $78k).
- Recommended offer: $75k (3.0% below list) — sets the bar for market timing.
- Cap rate 9.4% vs local median 5.3% in Massena — top-decile yield for the area; either an underpriced asset or a hidden risk that comps aren't pricing in. Stress-test before assuming the spread holds.
Location & tenants
- Location reads 73/100 on livability (#330 in NY) — a middle-class / working-renter tenant base. Strengths: cost of living A+, housing A+, health & safety A+; Watch: amenities D, crime D-, commute F.
- Massena Central School District (town): math 43% / reading 49% proficiency, ranked #456 of 590 in NY (top 77%) — families likely to look elsewhere, expect single-tenant / working-renter base with shorter leases.
- Market conditions: 171 active listings in the ZIP; 215 units permitted in St. Lawrence County in 2024 (0 in 5+ unit buildings).
Forward outlook
- Local home prices are declining (-3.0%/yr); year-one equity from $537 of loan paydown is wiped out by about $2k of value loss. Plan a longer hold.
- St. Lawrence County population projected at -14% by 2050 — secular population decline; favor cash flow + early exit over multi-decade hold.
- At projected returns (-3.0% appreciation + 3.0% rent growth), your $22k cash investment doubles in ~10 years — after that, you're playing with house money.
Negotiation context
- It's been on market 36 days — a 3% lower offer ($75k) is reasonable based on typical stale-listing flexibility.
- 5 sale attempts since 3y ago with the ask held roughly flat each time — persistent listings suggest the price (not the market) is what's stuck; bring a comps-based counter.
- Current owner paid $50k; list at $78k implies a 55% gain — meaningful room to come down on a strong offer.
Questions for the listing agent
- It's been on market 36 days. Have you received any prior offers? Is the seller open to a 3% concession, seller financing, or rate buy-down credit?
- Built in 1966 — when were the roof, HVAC, electrical panel, plumbing, and water heater last replaced?
- Is there a deadline driving the sale (1031 exchange, divorce, estate, relocation)? That informs how much negotiation room exists.
- Crime grade is D in this area — have there been break-ins, vandalism, or insurance claims at this property in the last 3 years? What carrier currently insures it and at what premium?
- What's the average days-on-market for RENTAL listings here right now (not sales)? A rising rental-DOM trend means longer vacancies and softer asking-rent achievability than the comps imply.
- What's the recent tenant-quality profile in this submarket — average credit score on applications, eviction rate, late-payment / NSF rate, and stable-employment percentage? A property-management company in the area should have these aggregated.
- How much new for-sale + rental construction is in the pipeline within 1–3 miles? Heavy new supply typically softens prices + rents 12–24 months out; constrained supply supports both.
Investment metrics
- 1% rule
- 1.22% ✓
- Cap rate
- 9.37%
- Cash-on-cash
- 11.00%
- DSCR
- 1.49
- GRM
- 6.8
CMA / ARV
- ARV (median comp)
- $55,437
- List price
- $77,700
- Delta
- 40.16%
- Verdict
- OVERPRICED
- Comps
- 1 within 2.0 mi
Projected returns pro-forma
-3.0% appreciation · 3.0% rent growth · sell at horizon
- IRR
- 0.2%
- Equity multiple
- 1.01×
- Total profit
- $131
- Equity at exit
- $11,585
- IRR
- 9.8%
- Equity multiple
- 1.76×
- Total profit
- $16,554
- Equity at exit
- $6,718
Cash invested: $21,756 (down + closing). Projections, not guarantees.
Landlord ↔ Tenant lean methodology
- Overall (STATE)
- 15 Strongly Tenant-Friendly
- State New York
- 15 Strongly Tenant-Friendly · D+10
- County
- — inherits STATE
- City
- — inherits STATE
ZIP-level market 13662
- Home prices YoY
- -6.4%
- Active inventory
- 171
- Price-to-rent
- 6.8×
Monthly cashflow live
- Estimated rent
- $946 medium interval (Pro) →
- Mortgage (P&I)
- −$407
- Tax from tax record
- −$108 /mo · $1,300/yr
- Insurance
- −$32
- HOA
- −$0
- Vacancy / Maint / Mgmt
- −$199
- Net cashflow
- $199
Break-even live
UW: 25.0% down · 7.5% · 30yr · 1.5% tax · 5.0% vac · 8.0% maint · 8.0% mgmt
Financing live
Cash to close
- Down payment
- $19,425
- Closing costs
- $2,331
- Reserves months
- —
- Total cash needed
- —
Loan-product check · same deal, 3 products live
Conventional
25% down · 7.5% · 30yr
- Down + closing
- —
- Monthly P&I
- —
- Monthly cashflow
- —
- DSCR
- —
- Eligible?
- —
Personal DTI + credit; lowest rate.
DSCR
20% down · 8.5% · 30yr
- Down + closing
- —
- Monthly P&I
- —
- Monthly cashflow
- —
- DSCR
- —
- Eligible?
- —
No personal income docs; deal must DSCR.
Hard money
10% down · 12.0% · 12mo
- Down + closing
- —
- Monthly P&I
- —
- Monthly cashflow
- —
- DSCR
- —
- Eligible?
- —
Short-term bridge; refi at stabilization.
Listing history 25 events
-
2026-06-18days on market $77,700 Active 36 DOM
-
2026-06-17days on market $77,700 Active 35 DOM
-
2026-06-16days on market $77,700 Active 34 DOM
-
2026-06-15days on market $77,700 Active 33 DOM
-
2026-06-13days on market $77,700 Active 31 DOM
-
2026-06-12days on market $77,700 Active 30 DOM
-
2026-06-09days on market $77,700 Active 27 DOM
-
2026-06-08days on market $77,700 Active 26 DOM
-
2026-06-07days on market $77,700 Active 25 DOM
-
2026-06-04days on market $77,700 Active 21 DOM
-
2026-06-02days on market $77,700 Active 20 DOM
-
2026-06-01days on market $77,700 Active 19 DOM
-
2026-05-31days on market $77,700 Active 18 DOM
-
2026-05-12$77,700 Active 1238-char remark
-
2025-06-15price $76,500
-
2025-05-13$83,000 Active
-
2024-12-05price $67,500
-
2024-11-15price $72,500
-
2024-11-04status Active
-
2024-11-04price $79,000
-
2024-07-09$75,000 Active
-
2023-04-14soldstatus $50,000 Closed
-
2023-02-06$58,900
-
2014-02-13soldstatus $37,000
-
2007-08-13soldstatus $48,000
ⓘ Source: listings_history table (triggers on properties + properties_extension) + one-shot
backfill from property_details.listing_events for pre-trigger history.
Tax reassessment forecast NY · Partial reset (capped growth)
- Current annual tax
- $1,300 · $108/mo
- Projected year-2 tax
- $1,307 · $109/mo
- Expected delta
- +$7/yr (+$1/mo · 0.5%)
ⓘ Screening estimate from a state-policy table — verify with the county assessor before closing.
Climate risk First Street
- Flood 1/10 Low 0% chance over 30 yrs
- Wildfire 3/10 Moderate
- Heat 2/10 Low 7 d/yr ≥94°F today · 15 d/yr by 30 yrs out
- Wind 1/10 Low
- Air quality 2/10 Low 1 unhealthy d/yr today · 1 by 30 yrs out
Nearby sold comps map
Loading sold comps map…
Walkable amenities ~0.75 mi
Loading nearby amenities…
Taxation est. · year 1
- Rental income
- $11,356
- − Mortgage interest
- −$4,352
- − Property taxes
- −$1,300
- − Insurance
- −$388
- − Repairs & maintenance
- −$908
- − Management
- −$908
- − Depreciation
- −$2,260
- Taxable income
- $1,238
- Est. tax owed @ 24.0%
- −$297
- After-tax cash flow
- $2,096/yr
For passive investors: Depreciation is non-cash, so a rental often shows a tax loss while cash-flowing — sheltering income. Rental losses are passive: they offset passive income freely, and up to $25,000/yr can offset ordinary (W-2) income if you actively participate and your MAGI is under $100k (phasing out to $0 by $150k); unused losses carry forward. On sale, claimed depreciation is recaptured at up to 25%, and gains may owe capital-gains tax (a 1031 exchange can defer both). Figures are a year-1 estimate at your 24.0% rate — not tax advice; consult a CPA.
Schools (NCES district)
- District
- Massena Central School District
- NCES district ID
- 3618660
- Math proficiency
- 43% ▼ -10.00%
- Reading proficiency
- 49% ▲ 1.00%
- Median HH income
- $42,610
- Composite
- 38.75/100
- National rank
- #4123
- State rank
- #456 of 590 in NY
Livability — Massena
- Score
- 73/100
- State rank
- #330
- US rank
- #5449
Category grades
Schools grade is shown separately in the Schools card above.
Census & demographics
- City population
- 15,737
- Population (ZIP)
- 15,737
Population outlook (St. Lawrence County) Hauer SSP2
- Today (2025)
- 110,027 people
- By 2030
- 107,455 · -2.3%
- By 2040
- 100,492 · -8.7%
- By 2050
- 94,254 · -14.3%
- By 2075
- 80,175 · -27.1%
- By 2100
- 63,140 · -42.6%
Race, ethnicity, and origin ACS 2023
- Neighborhood character
- Predominantly White (93%)
- Race & ethnicity
- White 93% Two or more races 4% Hispanic / Latino 2%
- Common ancestry
- Lithuanian 12% Slovak 2% Romanian 2%
- Foreign-born
- 4% · Canada
- Languages at home
- 96% English-only · French/Haitian/Cajun 1% Spanish 1% Russian/Polish/Slavic 1%
Political lean MEDSL · St. Lawrence
- 2024 margin
- R (+18.0) · D 41.0% · R 59.0%
- 2008→2024 swing
- -34.3pp toward R · 2008: 16.3pp · 2024: -18.0pp
- All cycles
- 2024: R+18.0 2020: R+11.7 2016: R+10.8 2012: D+16.6 2008: D+16.3
Not yet ingested
- Civics
- —
Market trends
- HPI YoY
- ▼ -16.77%
- Current HPI
- 243.4674
- Rent YoY
- —
- Metro
- —
- State GDP YoY
- ▲ 2.60%
- F500 in state
- 92
Industry mix (Fortune 500 HQ in NY)
| Industry | F500 HQs | Revenue |
|---|---|---|
| Financial Services | 10 | $950B |
|
||
| Consumer Goods | 9 | $162B |
|
||
| Insurance | 4 | $225B |
|
||
| Telecommunications | 2 | $144B |
|
||
| Pharmaceuticals | 2 | $112B |
|
||
| Media / Entertainment | 2 | $69B |
|
||
Price history
+61.9% since first listed12 events — show timeline
- 2026-05-12 Listed $77,700 Global MLS
- 2025-06-15 Price Changed $76,500 SLCMLS
- 2025-05-13 Listed $83,000 SLCMLS
- 2024-12-05 Price Changed $67,500 SLCMLS
- 2024-11-15 Price Changed $72,500 SLCMLS
- 2024-11-04 Relisted — SLCMLS
- 2024-11-04 Price Changed $79,000 SLCMLS
- 2024-07-09 Listed $75,000 SLCMLS
- 2023-04-14 Sold (MLS) $50,000 SLCMLS
- 2023-02-06 Listed $58,900 SLCMLS
- 2014-02-13 Sold (Public Records) $37,000 Public Records
- 2007-08-13 Sold (Public Records) $48,000 Public Records
Property tax history
+14.4%/yrLatest (2025): $1,300 · -33.2% YoY. Source: county tax records.
Cash-flow waterfall
monthlySold comps — $/sqft
last 12 mo · ≤1 miLoading sold comps…