 Multi-family
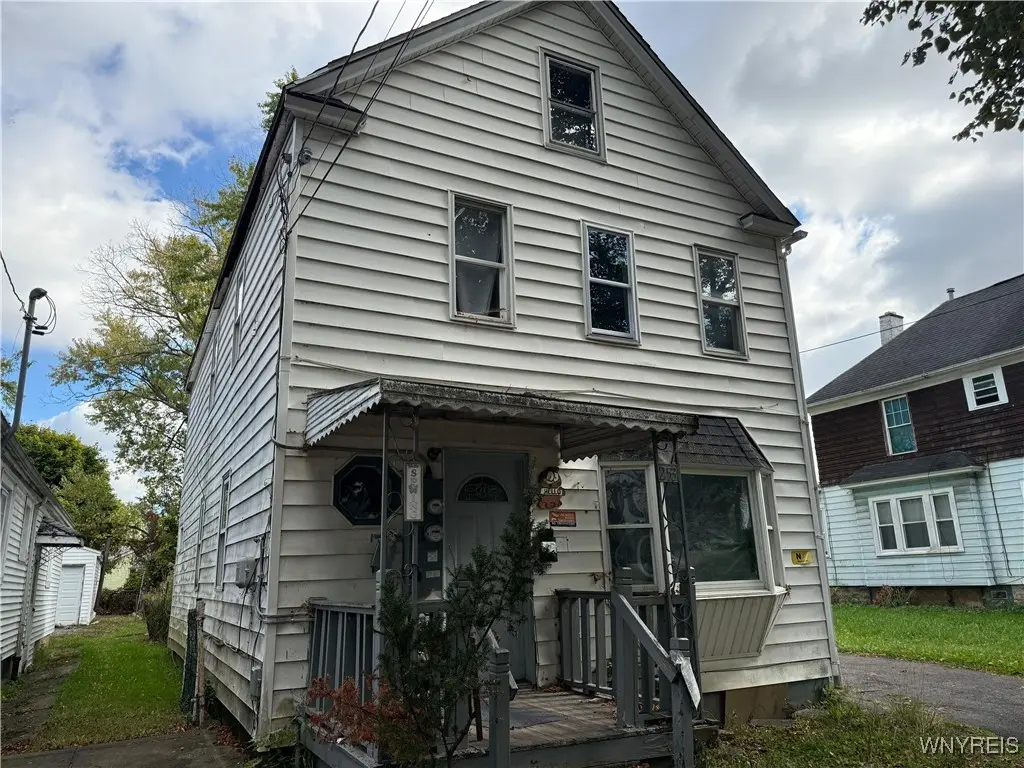
253 Gold St · Buffalo, NY
Flood risk 6/10 · Moderate
- FEMA flood zone
- X (unshaded)
- Chance of flooding over 30 yrs
- 0.69%
- Est. flood insurance / yr
- $507 – $1,088
Fire risk 1/10 · Minimal
- Est. fire insurance / yr
- $691 – $1,283
Heat risk 3/10 · Minor
- Hot days now (above 92°F)
- 7 days/yr
- Hot days in 30 yrs
- 15 days/yr
Wind risk 1/10 · Minimal
- Chance of severe wind over 30 yrs
- —
Air-quality risk 3/10 · Minor
- Unhealthy air days now
- 2 days/yr
- Unhealthy air days in 30 yrs
- 3 days/yr
Risk factors via First Street. Map © Google.
Why this score? — see what drove the A grade
The composite is a weighted blend of 9 inputs, each scored 0–100. Each bar is that input's sub-score; the figure is the points it added to the 100-point composite (weight × sub-score).
- Cash flow +30.0/30.0
- ARV discount +15.0/15.0
- 1% rule +10.0/10.0
- DSCR +10.0/10.0
- Appreciation +9.0/10.0
- Livability +3.9/5.0
- Schools +3.3/10.0
- Rent growth +2.5/5.0
- Condition / age +2.5/5.0
$125,000
🖨 Deal sheet (PDF) 📄 Offer letter ✓ Due diligence
Multi-family units
County records classify this as Multi-Family (2-4 Unit). Listing-text estimate: 1 unit. estimate disagrees with records
Listing remarks MLS
Discover this beautiful updated ready to move multi family home with 4 bedrooms and 2 bathrooms at the lower and upper unit along with crawl basement and crawl attic space located on east side of Buffalo, close to religious facility. The entire property was remodeled, renovated along with fresh paint. The exquisite interiors with wonderful wooden work make you feel at home with comfort, peace and tranquility. There is a beautiful back yard at the back of the property. The home is accessible to all amenities and facilities within 5 minutes driving distance and access to all major highways and state ways. It’s a good location with public transportation access close by.
Key facts
- Crawl attic space
- Back yard
- Crawl basement
Tags
Neighborhood map
What this means for you Summary
Snapshot
- This is a 6-bed/2.0-bath multifamily listed at $125k.
Deal economics
- At list price, monthly cash flow is $1k ($15k/yr) — positive.
- The deal already cash-flows at list — no discount required.
- Meets the 1% rule at list price ($2k rent vs $125k).
- Cap rate 17.9% vs local median 8.0% in Buffalo — top-decile yield for the area; either an underpriced asset or a hidden risk that comps aren't pricing in. Stress-test before assuming the spread holds.
Location & tenants
- Location reads 77/100 on livability (#195 in NY, #3,011 nationally) — a middle-class / working-renter tenant base. Strengths: commute A+, housing A+, health & safety A+; Watch: crime F, employment D-.
- Buffalo City School District (urban): math 41% / reading 40% proficiency, ranked #535 of 590 in NY (top 91%) — families likely to look elsewhere, expect single-tenant / working-renter base with shorter leases; 75% free/reduced lunch — lower-income household profile, screen leases tightly.
- Market conditions: 169 active listings in the ZIP; 1,244 units permitted in Erie County in 2024 (563 in 5+ unit buildings).
- At $2,460/mo this rent would consume 59% of the median local household income ($50k/yr) (locally 841% of renters already pay >50% of income on rent) — very limited rent-growth headroom before tenants either downsize or default.
Forward outlook
- In year one you build about $11k of equity ($864 loan paydown + $10k appreciation (8.1% local appreciation)).
- At projected returns (8.1% appreciation + 3.0% rent growth), your $35k cash investment doubles in ~2 years — after that, you're playing with house money.
- By year 4, paydown + projected appreciation supports a ~$38k cash-out refi (75% LTV) — recoverable capital for the next deal without selling this one.
Negotiation context
- Only 8 days on market — expect competitive offers; lowballing is unlikely to land.
- 5 sale attempts since 17y ago; this cycle's ask has dropped $24k (16%) from the opening price — seller is motivated, your offer sets the floor, not the list.
- Current owner paid $55k; list at $125k implies a 127% gain — meaningful room to come down on a strong offer.
Risks & watch-outs
- Watch-outs: built in 1900 — expect roof / HVAC / electrical / plumbing capex.
- Climate carrying-cost: major flood risk — expect insurance premiums to compound above CPI over the hold.
Questions for the listing agent
- Built in 1900 — when were the roof, HVAC, electrical panel, plumbing, and water heater last replaced?
- Is there a deadline driving the sale (1031 exchange, divorce, estate, relocation)? That informs how much negotiation room exists.
- Crime grade is F in this area — have there been break-ins, vandalism, or insurance claims at this property in the last 3 years? What carrier currently insures it and at what premium?
- What's the average days-on-market for RENTAL listings here right now (not sales)? A rising rental-DOM trend means longer vacancies and softer asking-rent achievability than the comps imply.
- What's the recent tenant-quality profile in this submarket — average credit score on applications, eviction rate, late-payment / NSF rate, and stable-employment percentage? A property-management company in the area should have these aggregated.
- How much new apartment / multifamily construction is in the pipeline within 1–3 miles? Heavy new supply (>2% of stock underway) typically softens rents 12–24 months out; light construction supports rent growth.
Investment metrics
- 1% rule
- 1.97% ✓
- Cap rate
- 17.91%
- Cash-on-cash
- 41.47%
- DSCR
- 2.85
- GRM
- 4.2
CMA / ARV
- ARV (median comp)
- $210,594
- List price
- $125,000
- Delta
- -29.25%
- Verdict
- UNDERPRICED
- Comps
- 20 within 1.0 mi
Show comp detail 12 sales within ~0.75 mi
| Address | Dist | Beds/Ba | Sqft | Sold | Price | $/sf | Match |
|---|---|---|---|---|---|---|---|
| 345 Ideal St | 0.21mi | 6/2.0 | 1,960 (-2%) | 12mo | $140,000 | $71 | 76 |
| 121 Schiller St | 0.31mi | 6/2.0 | 2,000 (-0%) | 12mo | $157,000 | $79 | 75 |
| 115 Greene St | 0.35mi | 5/3.0 (-1) | 1,968 (-2%) | 6mo | $165,000 | $84 | 66 |
| 103 Goethe St | 0.36mi | 5/2.0 (-1) | 2,024 (+1%) | 15mo | $140,000 | $69 | 64 |
| 120 Gold Street St | 0.26mi | 5/2.0 (-1) | 2,104 (+5%) | 15mo | $151,000 | $72 | 62 |
| 8 Wagner Ave | 0.37mi | 5/3.0 (-1) | 2,149 (+7%) | 2mo | $205,000 | $95 | 60 |
| 55 N Ogden St Unit E | 0.40mi | 6/2.0 | 2,184 (+9%) | 14mo | $220,000 | $101 | 56 |
| 304 Longnecker St | 0.23mi | 7/2.5 (+1) | 1,803 (-10%) | 14mo | $123,768 | $69 | 53 |
| 2067 Broadway St | 0.57mi | 6/3.0 | 1,970 (-2%) | 17mo | $172,000 | $87 | 52 |
| 56 Shepard St | 0.74mi | 5/2.0 (-1) | 2,093 (+4%) | 5mo | $88,000 | $42 | 50 |
| 1514 William St | 0.70mi | 6/2.0 | 2,200 (+10%) | 4mo | $175,000 | $80 | 49 |
| 24 Gatchell St | 0.67mi | 5/2.0 (-1) | 2,200 (+10%) | 12mo | $67,000 | $30 | 38 |
Match score weights: distance 35% · size 25% · config 20% · recency 20%. Top-matched comps best support the ARV.
Projected returns pro-forma
8.06% appreciation · 3.0% rent growth · sell at horizon
- IRR
- 53.8%
- Equity multiple
- 4.68×
- Total profit
- $128,960
- Equity at exit
- $95,463
- IRR
- 48.9%
- Equity multiple
- 10.05×
- Total profit
- $316,855
- Equity at exit
- $189,968
Cash invested: $35,000 (down + closing). Projections, not guarantees.
Landlord ↔ Tenant lean methodology
- Overall (STATE)
- 15 Strongly Tenant-Friendly
- State New York
- 15 Strongly Tenant-Friendly · D+10
- County
- — inherits STATE
- City
- — inherits STATE
ZIP-level market 14206
- Home prices YoY
- 1.8%
- Active inventory
- 169
- Price-to-rent
- 8.5×
Monthly cashflow live
- Estimated rent
- $2,460 high interval (Pro) →
- Mortgage (P&I)
- −$656
- Tax from tax record
- −$26 /mo · $314/yr
- Insurance
- −$52
- HOA
- −$0
- Vacancy / Maint / Mgmt
- −$517
- Net cashflow
- $1,210
Break-even live
Sensitivity live
| Price | -10% $1,280 | -5% $1,245 | +0% $1,210 | +5% $1,174 | +10% $1,139 |
|---|---|---|---|---|---|
| Rent | -10% $1,015 | -5% $1,112 | +0% $1,210 | +5% $1,307 | +10% $1,404 |
| Rate | -1.0pp $1,273 | -0.5pp $1,241 | base $1,210 | +0.5pp $1,177 | +1.0pp $1,144 |
2-unit breakdown (identical units grouped — click to expand)
| Units | Beds | Baths | Est. rent |
|---|---|---|---|
| 2× units | 2 | 1 | $2,460 |
| #1 | 2 | 1 | $1,230 |
| #2 | 2 | 1 | $1,230 |
| Total (2 units) | $2,460 | ||
UW: 25.0% down · 7.5% · 30yr · 1.5% tax · 5.0% vac · 8.0% maint · 8.0% mgmt
Financing live
Cash to close
- Down payment
- $31,250
- Closing costs
- $3,750
- Reserves months
- —
- Total cash needed
- —
Loan-product check · same deal, 3 products live
Conventional
25% down · 7.5% · 30yr
- Down + closing
- —
- Monthly P&I
- —
- Monthly cashflow
- —
- DSCR
- —
- Eligible?
- —
Personal DTI + credit; lowest rate.
DSCR
20% down · 8.5% · 30yr
- Down + closing
- —
- Monthly P&I
- —
- Monthly cashflow
- —
- DSCR
- —
- Eligible?
- —
No personal income docs; deal must DSCR.
Hard money
10% down · 12.0% · 12mo
- Down + closing
- —
- Monthly P&I
- —
- Monthly cashflow
- —
- DSCR
- —
- Eligible?
- —
Short-term bridge; refi at stabilization.
Listing history 24 events
-
2026-06-18days on market $125,000 Active 8 DOM
-
2026-06-17days on market $125,000 Active 7 DOM
-
2026-06-16days on market $125,000 Active 6 DOM
-
2026-06-15days on market $125,000 Active 5 DOM
-
2026-06-13days on market $125,000 Active 3 DOM
-
2026-06-13remarks 693-char remark
-
2026-06-13pricedays on market $125,000 Active 2 DOM
-
2026-05-31days on market $149,000 Active 186 DOM
-
2025-11-26$149,000 Active 681-char remark
Show marketing remark (681 chars)
Discover this beautiful updated ready to move multi family home with 4 bedrooms and 2 bathrooms at the lower and upper unit along with crawl basement and crawl attic space located on east side of Buffalo, close to religious facility. The entire property was remodeled, renovated along with fresh paint. The exquisite interiors with wonderful wooden work make you feel at home with comfort, peace and tranquility. There is a beautiful back yard at the back of the property. The home is accessible to all amenities and facilities within 5 minutes driving distance and access to all major highways and state ways. It’s a good location with public transportation access close by.
-
2025-08-16historical
-
2025-07-07$140,000 Active
-
2023-08-29soldstatus $55,000
-
2023-05-10status Under Contract- Do Not Show
-
2023-05-01historical
-
2023-04-21price $90,000
-
2023-04-05price $100,000
-
2023-01-31$138,000 Active
-
2020-03-26soldstatus $119,700
-
2015-09-15soldstatus $38,500
-
2014-10-29$41,900
-
2011-03-08soldstatus $29,925
-
2010-09-24soldstatus $14,500
-
2010-09-24soldstatus $14,500
-
2009-12-28$29,900
ⓘ Source: listings_history table (triggers on properties + properties_extension) + one-shot
backfill from property_details.listing_events for pre-trigger history.
Tax reassessment forecast NY · Partial reset (capped growth)
- Current annual tax
- $314 · $26/mo
- Projected year-2 tax
- $1,213 · $101/mo
- Expected delta
- +$899/yr (+$75/mo · 286.5%)
ⓘ Screening estimate from a state-policy table — verify with the county assessor before closing.
Climate risk First Street
- Flood 6/10 Major FEMA zone X (unshaded) · 69% chance over 30 yrs
- Wildfire 1/10 Low
- Heat 3/10 Moderate 7 d/yr ≥92°F today · 15 d/yr by 30 yrs out
- Wind 1/10 Low
- Air quality 3/10 Moderate 2 unhealthy d/yr today · 3 by 30 yrs out
Nearby sold comps map
Loading sold comps map…
Walkable amenities ~0.75 mi
Loading nearby amenities…
Taxation est. · year 1
- Rental income
- $29,520
- − Mortgage interest
- −$7,002
- − Property taxes
- −$314
- − Insurance
- −$625
- − Repairs & maintenance
- −$2,362
- − Management
- −$2,362
- − Depreciation
- −$3,636
- Taxable income
- $13,220
- Est. tax owed @ 24.0%
- −$3,173
- After-tax cash flow
- $11,343/yr
For passive investors: Depreciation is non-cash, so a rental often shows a tax loss while cash-flowing — sheltering income. Rental losses are passive: they offset passive income freely, and up to $25,000/yr can offset ordinary (W-2) income if you actively participate and your MAGI is under $100k (phasing out to $0 by $150k); unused losses carry forward. On sale, claimed depreciation is recaptured at up to 25%, and gains may owe capital-gains tax (a 1031 exchange can defer both). Figures are a year-1 estimate at your 24.0% rate — not tax advice; consult a CPA.
Schools (NCES district)
- District
- Buffalo City School District
- NCES district ID
- 3605850
- Math proficiency
- 41% ▲ 11.00%
- Reading proficiency
- 40% ▲ 7.00%
- Median HH income
- $31,665
- Composite
- 33.17/100
- National rank
- #5544
- State rank
- #535 of 590 in NY
Livability — Buffalo
- Score
- 77/100
- State rank
- #195
- US rank
- #3011
Category grades
Schools grade is shown separately in the Schools card above.
Census & demographics
- Census place
- Buffalo, NY
- County
- Erie County · 714,559 people
- City population
- 440,021
- Metro
- Buffalo-Cheektowaga, NY
- Population (ZIP)
- 21,631
- Household income
- $50,450
- Rent vs Own
- Severe rent burden
- 841.0
Population outlook (Erie County) Hauer SSP2
- Today (2025)
- 933,037 people
- By 2030
- 935,181 · +0.2%
- By 2040
- 928,531 · -0.5%
- By 2050
- 905,725 · -2.9%
- By 2075
- 834,037 · -10.6%
- By 2100
- 708,033 · -24.1%
Race, ethnicity, and origin ACS 2023
- Neighborhood character
- Majority White (65%)
- Race & ethnicity
- White 65% Hispanic / Latino 13% Black 12% Two or more races 8% Asian 4%
- Hispanic origin (detail)
- Mexican 2% Puerto Rican 10%
- Common ancestry
- Romanian 25% Lithuanian 1% Italian 1%
- Foreign-born
- 6% · Canada, China
- Languages at home
- 88% English-only · Spanish 5% Other Indo-European 3% Arabic 2%
Political lean MEDSL · Erie
- 2024 margin
- Lean D (+9.7) · D 54.8% · R 45.2%
- 2008→2024 swing
- -7.9pp toward R · 2008: 17.5pp · 2024: 9.7pp
- All cycles
- 2024: D+9.7 2020: D+14.7 2016: D+4.8 2012: D+15.6 2008: D+17.5
Not yet ingested
- Civics
- —
Market trends
- HPI YoY
- ▲ 8.06%
- Current HPI
- 457.3935
- Rent YoY
- —
- Metro
- Buffalo-Cheektowaga, NY
- State GDP YoY
- ▲ 2.60%
- F500 in state
- 92
Industry mix (Fortune 500 HQ in NY)
| Industry | F500 HQs | Revenue |
|---|---|---|
| Financial Services | 10 | $950B |
|
||
| Consumer Goods | 9 | $162B |
|
||
| Insurance | 4 | $225B |
|
||
| Telecommunications | 2 | $144B |
|
||
| Pharmaceuticals | 2 | $112B |
|
||
| Media / Entertainment | 2 | $69B |
|
||
Price history
+398.3% since first listed16 events — show timeline
- 2025-11-26 Listed $149,000 WNYREIS
- 2025-08-16 Listing Removed — WNYREIS
- 2025-07-07 Listed $140,000 WNYREIS
- 2023-08-29 Sold (Public Records) $55,000 Public Records
- 2023-05-10 Pending — WNYREIS
- 2023-05-01 Listing Removed — WNYREIS
- 2023-04-21 Price Changed $90,000 WNYREIS
- 2023-04-05 Price Changed $100,000 WNYREIS
- 2023-01-31 Listed $138,000 WNYREIS
- 2020-03-26 Sold (Public Records) $119,700 Public Records
- 2015-09-15 Sold (Public Records) $38,500 Public Records
- 2014-10-29 Listed $41,900 WNYREIS
- 2011-03-08 Sold (Public Records) $29,925 Public Records
- 2010-09-24 Sold (Public Records) $14,500 Public Records
- 2010-09-24 Sold (MLS) $14,500 WNYREIS
- 2009-12-28 Listed $29,900 WNYREIS
Property tax history
+2.3%/yrLatest (2025): $314 · +0.0% YoY. Source: county tax records.
Cash-flow waterfall
monthlySold comps — $/sqft
last 12 mo · ≤1 miLoading sold comps…