 8-Plex
10507 Broadway Dr · Amarillo, TX
Flood risk 1/10 · Minimal
- FEMA flood zone
- X (unshaded)
- Chance of flooding over 30 yrs
- 0.0%
- Est. flood insurance / yr
- $507 – $1,088
Fire risk 7/10 · Major
- Est. fire insurance / yr
- $1,222 – $2,270
Heat risk 5/10 · Moderate
- Hot days now (above 98°F)
- 6 days/yr
- Hot days in 30 yrs
- 17 days/yr
Wind risk 2/10 · Minimal
- Chance of severe wind over 30 yrs
- —
Air-quality risk 2/10 · Minimal
- Unhealthy air days now
- 1 days/yr
- Unhealthy air days in 30 yrs
- 2 days/yr
Risk factors via First Street. Map © Google.
Why this score? — see what drove the B- grade
The composite is a weighted blend of 9 inputs, each scored 0–100. Each bar is that input's sub-score; the figure is the points it added to the 100-point composite (weight × sub-score).
- Cash flow +30.0/30.0
- 1% rule +10.0/10.0
- DSCR +10.0/10.0
- ARV discount +7.5/15.0
- Schools +3.5/10.0
- Livability +3.3/5.0
- Rent growth +2.5/5.0
- Condition / age +2.2/5.0
- Appreciation +0.0/10.0
$469,000
🖨 Deal sheet 📄 Offer letter ✓ Due diligence
Multi-family units
County records classify this as Multi-Family (2-4 Unit). Listing-text estimate: 8 units. estimate disagrees with records
Listing remarks MLS
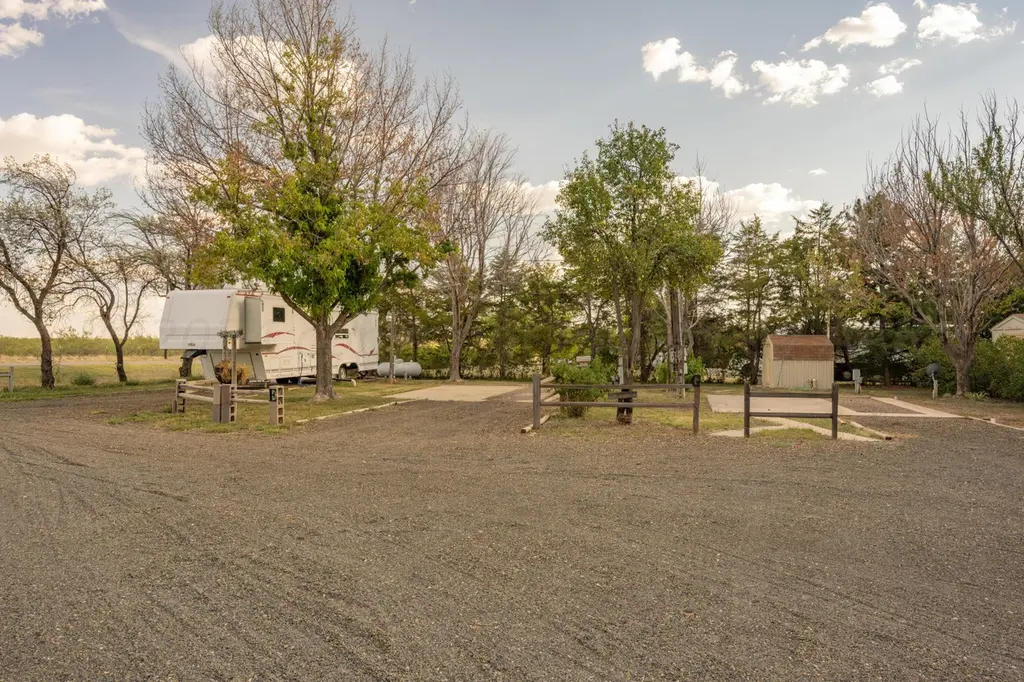
Extremely well maintained mobile home park with 6 park owned 2 bdm homes + 3 RV spaces, all nestled amongst mature trees/landscape. Country setting just north of Amarillo city limits allows for easy expansion through county. Tenants maintain yards, pay own utilities. Park pays water (2 wells) & garbage. Features gravel drives & designated parking, community storm shelter, 4 septic tanks, numerous storage bldgs/well houses, covered parking. Rent out storage bldgs/parking for add'l income. Possible room for addition of tiny homes and/or RV spaces. All mobile homes recently detached from land for much lower taxes, with homes being taxed as personal property. A local bank will loan up to 80%, LTV, call for details. MOTIVATED SELLERS. BRING ALL REASONABLE OFFERS.
Key facts
- Covered parking
- Country setting
- Storage buildings
Tags
Neighborhood map
What this means for you Summary
Snapshot
- This is a 8 × 3-bed/?-bath units multifamily listed at $469k. Condition is rated fair.
Deal economics
- At list price, monthly cash flow is $3k ($40k/yr) — positive. Per door: $417/mo.
- The deal already cash-flows at list — no discount required.
- Meets the 1% rule at list price ($8k rent vs $469k).
- Recommended offer: $455k (3.0% below list) — sets the bar for market timing.
Location & tenants
- Location reads 66/100 on livability (#624 in TX) — a middle-class / working-renter tenant base. Strengths: cost of living A+, housing A+; Watch: amenities C-, schools D, crime F.
- River Road ISD (suburban): math 38% / reading 41% proficiency, ranked #389 of 826 in TX (top 47%) — families likely to look elsewhere, expect single-tenant / working-renter base with shorter leases.
- Market conditions: 62 active listings in the ZIP; 1,214 units permitted in Potter County in 2024 (650 in 5+ unit buildings).
Forward outlook
- Local home prices are declining (-3.0%/yr); year-one equity from $3k of loan paydown is wiped out by about $14k of value loss. Plan a longer hold.
- At projected returns (-3.0% appreciation + 3.0% rent growth), your $131k cash investment doubles in ~4 years — after that, you're playing with house money.
Negotiation context
- It's been on market 55 days — a 3% lower offer ($455k) is reasonable based on typical stale-listing flexibility.
- 2 sale attempts since 5y ago with the ask held roughly flat each time — persistent listings suggest the price (not the market) is what's stuck; bring a comps-based counter.
Risks & watch-outs
- Climate carrying-cost: major wildfire risk; extreme-heat days projected 6→17/yr by 2055 (HVAC capex compounding) — expect insurance premiums to compound above CPI over the hold.
Questions for the listing agent
- It's been on market 55 days. Have you received any prior offers? Is the seller open to a 3% concession, seller financing, or rate buy-down credit?
- Can we see the unit-by-unit rent roll, current vacancy, and any below-market leases? What's the average tenancy length?
- What capital expenditures (roof, boiler, parking lot, exteriors) have been made in the last 5 years, and what's planned in the next 2?
- Have any recent inspections been done? Can we get a copy of the seller's disclosures and any deferred-maintenance estimates?
- Is there a deadline driving the sale (1031 exchange, divorce, estate, relocation)? That informs how much negotiation room exists.
- Schools are D-rated, which usually means shorter tenancies and higher turnover. Who's the typical renter profile here, and what's been the actual vacancy rate?
- Crime grade is F in this area — have there been break-ins, vandalism, or insurance claims at this property in the last 3 years? What carrier currently insures it and at what premium?
- What's the average days-on-market for RENTAL listings here right now (not sales)? A rising rental-DOM trend means longer vacancies and softer asking-rent achievability than the comps imply.
- What's the recent tenant-quality profile in this submarket — average credit score on applications, eviction rate, late-payment / NSF rate, and stable-employment percentage? A property-management company in the area should have these aggregated.
- How much new apartment / multifamily construction is in the pipeline within 1–3 miles? Heavy new supply (>2% of stock underway) typically softens rents 12–24 months out; light construction supports rent growth.
Investment metrics
- 1% rule
- 1.77% ✓
- Cap rate
- 14.82%
- Cash-on-cash
- 30.45%
- DSCR
- 2.35
- GRM
- 4.7
CMA / ARV
No comps found within radius.
Projected returns pro-forma
-3.0% appreciation · 3.0% rent growth · sell at horizon
- IRR
- 25.1%
- Equity multiple
- 2.04×
- Total profit
- $136,372
- Equity at exit
- $69,929
- IRR
- 32.9%
- Equity multiple
- 3.99×
- Total profit
- $392,559
- Equity at exit
- $40,551
Cash invested: $131,320 (down + closing). Projections, not guarantees.
Landlord ↔ Tenant lean methodology
- Overall (STATE)
- 87 Strongly Landlord-Friendly
- State Texas
- 87 Strongly Landlord-Friendly · R+5
- County
- — inherits STATE
- City
- — inherits STATE
ZIP-level market 79108
- Home prices YoY
- -25.9%
- Active inventory
- 62
- Price-to-rent
- 37.6×
Monthly cashflow live
- Estimated rent
- $8,321 medium interval (Pro) →
- Mortgage (P&I)
- −$2,459
- Tax est. 1.5%
- −$586 /mo · $7,035/yr
- Insurance
- −$195
- HOA
- −$0
- Vacancy / Maint / Mgmt
- −$1,747
- Net cashflow
- $3,332
Break-even live
8-unit breakdown (identical units grouped — click to expand)
| Units | Beds | Baths | Est. rent |
|---|---|---|---|
| 8× units | 3 | — | $8,320 |
| #1 | 3 | — | $1,040 |
| #2 | 3 | — | $1,040 |
| #3 | 3 | — | $1,040 |
| #4 | 3 | — | $1,040 |
| #5 | 3 | — | $1,040 |
| #6 | 3 | — | $1,040 |
| #7 | 3 | — | $1,040 |
| #8 | 3 | — | $1,040 |
| Total (8 units) | $8,321 | ||
UW: 25.0% down · 7.5% · 30yr · 1.5% tax · 5.0% vac · 8.0% maint · 8.0% mgmt
Financing live
Cash to close
- Down payment
- $117,250
- Closing costs
- $14,070
- Reserves months
- —
- Total cash needed
- —
Loan-product check · same deal, 3 products live
Conventional
25% down · 7.5% · 30yr
- Down + closing
- —
- Monthly P&I
- —
- Monthly cashflow
- —
- DSCR
- —
- Eligible?
- —
Personal DTI + credit; lowest rate.
DSCR
20% down · 8.5% · 30yr
- Down + closing
- —
- Monthly P&I
- —
- Monthly cashflow
- —
- DSCR
- —
- Eligible?
- —
No personal income docs; deal must DSCR.
Hard money
10% down · 12.0% · 12mo
- Down + closing
- —
- Monthly P&I
- —
- Monthly cashflow
- —
- DSCR
- —
- Eligible?
- —
Short-term bridge; refi at stabilization.
Listing history 20 events
-
2026-06-18days on market $469,000 Active 55 DOM
-
2026-06-17days on market $469,000 Active 54 DOM
-
2026-06-16days on market $469,000 Active 53 DOM
-
2026-06-15days on market $469,000 Active 52 DOM
-
2026-06-15days on market $469,000 Active 51 DOM
-
2026-06-13days on market $469,000 Active 50 DOM
-
2026-06-12days on market $469,000 Active 49 DOM
-
2026-06-09days on market $469,000 Active 46 DOM
-
2026-06-08days on market $469,000 Active 45 DOM
-
2026-06-08days on market $469,000 Active 44 DOM
-
2026-06-07days on market $469,000 Active 43 DOM
-
2026-06-03days on market $469,000 Active 40 DOM
-
2026-06-02days on market $469,000 Active 39 DOM
-
2026-06-01days on market $469,000 Active 38 DOM
-
2026-05-31days on market $469,000 Active 37 DOM
-
2026-04-24$469,000 Active 780-char remark
Show marketing remark (780 chars)
Extremely well maintained mobile home park with 6 park owned 2 bdm homes + 3 RV spaces, all nestled amongst mature trees/landscape. Country setting just north of Amarillo city limits allows for easy expansion through county. Tenants maintain yards, pay own utilities. Park pays water (2 wells) & garbage. Features gravel drives & designated parking, community storm shelter, 4 septic tanks, numerous storage bldgs/well houses, covered parking. Rent out storage bldgs/parking for add'l income. Possible room for addition of tiny homes and/or RV spaces. All mobile homes recently detached from land for much lower taxes, with homes being taxed as personal property. A local bank will loan up to 80%, LTV, call for details. MOTIVATED SELLERS. BRING ALL REASONABLE OFFERS.
-
2022-10-27price $499,900
-
2022-10-20price $509,000
-
2021-10-29soldstatus
-
2021-08-14$430,000
ⓘ Source: listings_history table (triggers on properties + properties_extension) + one-shot
backfill from property_details.listing_events for pre-trigger history.
Climate risk First Street
- Flood 1/10 Low FEMA zone X (unshaded) · 0% chance over 30 yrs
- Wildfire 7/10 Severe
- Heat 5/10 Major 6 d/yr ≥98°F today · 17 d/yr by 30 yrs out
- Wind 2/10 Low
- Air quality 2/10 Low 1 unhealthy d/yr today · 2 by 30 yrs out
Nearby sold comps map
Loading sold comps map…
Walkable amenities ~0.75 mi
Loading nearby amenities…
Taxation est. · year 1
- Rental income
- $99,852
- − Mortgage interest
- −$26,271
- − Property taxes
- −$7,035
- − Insurance
- −$2,345
- − Repairs & maintenance
- −$7,988
- − Management
- −$7,988
- − Depreciation
- −$13,644
- Taxable income
- $34,581
- Est. tax owed @ 24.0%
- −$8,299
- After-tax cash flow
- $31,690/yr
For passive investors: Depreciation is non-cash, so a rental often shows a tax loss while cash-flowing — sheltering income. Rental losses are passive: they offset passive income freely, and up to $25,000/yr can offset ordinary (W-2) income if you actively participate and your MAGI is under $100k (phasing out to $0 by $150k); unused losses carry forward. On sale, claimed depreciation is recaptured at up to 25%, and gains may owe capital-gains tax (a 1031 exchange can defer both). Figures are a year-1 estimate at your 24.0% rate — not tax advice; consult a CPA.
Condition & rehab AI · 12 photos
This multi-family property requires moderate repairs and maintenance to improve its curb appeal and increase its value.
Repairs flagged
- Major siding — Significant wear and tear
- Major roof — No visible damage
- Major landscaping — Sparse vegetation
Value-add opportunities
- Both paint exterior walls — Enhances curb appeal and resale value
- Both landscaping — Improves curb appeal and rental value
- Both repair and paint siding — Enhances curb appeal and resale value
Renovation cost estimate screening
| Repair item | Severity | Est. cost |
|---|---|---|
| siding · Significant wear and tear | Major | $15,000–50,000 |
| roof · No visible damage | Major | $15,000–50,000 |
| landscaping · Sparse vegetation | Major | $15,000–50,000 |
| Total estimated repair cost · 3 items | $45,000–150,000 |
Value-add ROI direction
- Both paint exterior walls — Enhances curb appeal and resale value ↑
- Both landscaping — Improves curb appeal and rental value ↑
- Both repair and paint siding — Enhances curb appeal and resale value ↑
ⓘ Cost ranges are severity-bucket heuristics (US national rule-of-thumb). Get contractor quotes + a written scope before underwriting a rehab budget.
Schools (NCES district)
- District
- River Road ISD
- NCES district ID
- 4837260
- Math proficiency
- 38% ▼ -3.00%
- Reading proficiency
- 41% ▼ -1.00%
- Median HH income
- $57,718
- Composite
- 34.81/100
- National rank
- #5105
- State rank
- #389 of 826 in TX
Livability — Amarillo
- Score
- 66/100
- State rank
- #624
- US rank
- #11876
Category grades
Schools grade is shown separately in the Schools card above.
Census & demographics
- City population
- 185,802
- Population (ZIP)
- 10,979
Population outlook (Potter County) Hauer SSP2
- Today (2025)
- 121,296 people
- By 2030
- 120,883 · -0.3%
- By 2040
- 119,668 · -1.3%
- By 2050
- 117,788 · -2.9%
- By 2075
- 110,250 · -9.1%
- By 2100
- 92,923 · -23.4%
Race, ethnicity, and origin ACS 2023
- Neighborhood character
- Predominantly White (66%)
- Race & ethnicity
- White 66% Hispanic / Latino 23% Two or more races 14% Asian 3% Black 2%
- Hispanic origin (detail)
- Mexican 20%
- Common ancestry
- Italian 3% Slovak 3% Lithuanian 2%
- Foreign-born
- 8% · Canada, Philippines
- Languages at home
- 80% English-only · Spanish 17% Other Asian/Pacific 2%
Political lean MEDSL · Potter
- 2024 margin
- Solid R (+44.4) · D 27.3% · R 71.7% · Other 1.1%
- 2008→2024 swing
- -5.0pp toward R · 2008: -39.4pp · 2024: -44.4pp
- All cycles
- 2024: R+44.4 2020: R+38.7 2016: R+41.9 2012: R+44.6 2008: R+39.4
Not yet ingested
- Civics
- —
Market trends
- HPI YoY
- ▼ -64.97%
- Current HPI
- 185.6329
- Rent YoY
- —
- Metro
- —
- State GDP YoY
- ▲ 3.95%
- F500 in state
- 110
Industry mix (Fortune 500 HQ in TX)
| Industry | F500 HQs | Revenue |
|---|---|---|
| Energy | 16 | $1,198B |
|
||
| Technology | 5 | $198B |
|
||
| Engineering / Construction | 4 | $72B |
|
||
| Energy Services | 3 | $60B |
|
||
| Utilities | 3 | $41B |
|
||
| Healthcare | 2 | $330B |
|
||
Price history
+9.1% since first listed5 events — show timeline
- 2026-04-24 Listed $469,000 AARMLS
- 2022-10-27 Price Changed $499,900 AARMLS
- 2022-10-20 Price Changed $509,000 AARMLS
- 2021-10-29 Sold (MLS) — AARMLS
- 2021-08-14 Listed $430,000 AARMLS
Cash-flow waterfall
monthlySold comps — $/sqft
last 12 mo · ≤1 miLoading sold comps…