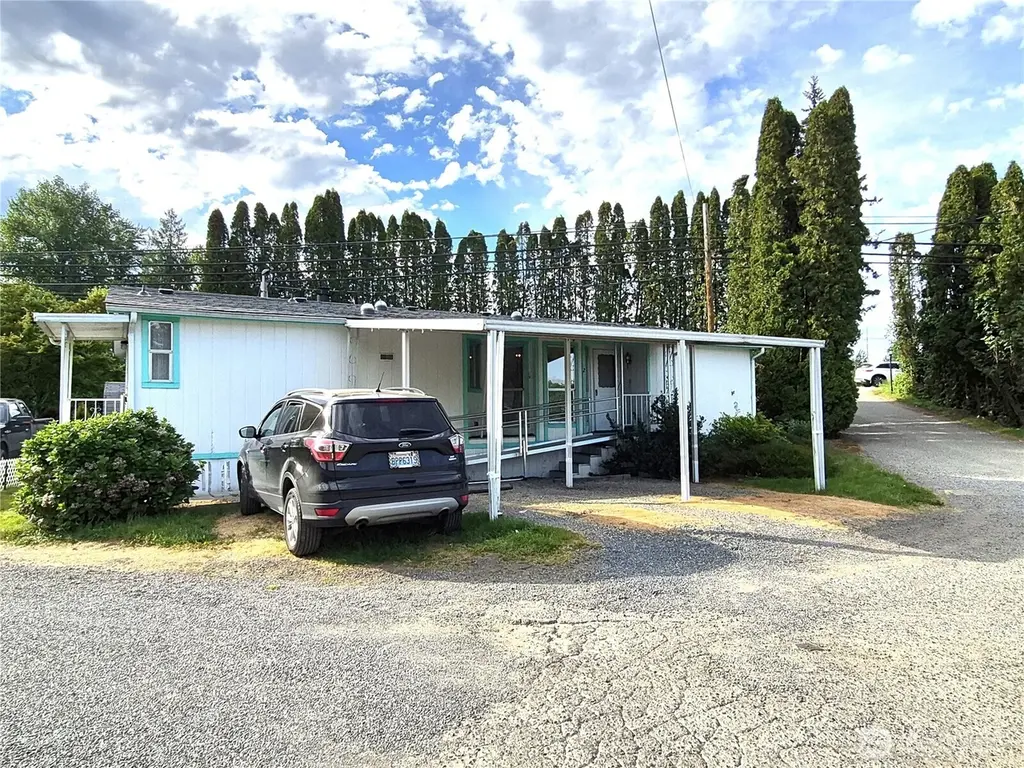
11100 92nd St SE #2 · Snohomish, WA
Flood risk No data
- FEMA flood zone
- —
- Chance of flooding over 30 yrs
- —
- Est. flood insurance / yr
- —
Fire risk No data
- Est. fire insurance / yr
- —
Heat risk No data
- Hot days now (above threshold)
- —
- Hot days in 30 yrs
- —
Wind risk No data
- Chance of severe wind over 30 yrs
- —
Air-quality risk No data
- Unhealthy air days now
- —
- Unhealthy air days in 30 yrs
- —
Risk factors via First Street. Map © Google.
Why this score? — see what drove the B grade
The composite is a weighted blend of 9 inputs, each scored 0–100. Each bar is that input's sub-score; the figure is the points it added to the 100-point composite (weight × sub-score).
- Cash flow +30.0/30.0
- DSCR +10.0/10.0
- 1% rule +9.3/10.0
- ARV discount +7.5/15.0
- Schools +5.9/10.0
- Rent growth +4.7/5.0
- Livability +3.9/5.0
- Condition / age +2.5/5.0
- Appreciation +0.0/10.0
$163,000
🖨 Deal sheet (PDF) 📄 Offer letter ✓ Due diligence
Listing remarks
Double wide mobile home in Pilchuck Mobile Home Park. This park has no age restrictions. This home features 3 bedrooms, 2 full bathrooms with a Great Room design large living room and fireplace open to dining room and kitchen. There is a slider to the covered back deck area and large corner lot yard with storage shed. Dining room with Bay window. Large kitchen with walk in pantry and breakfast bar area. There is a ramp going into the home for easier access. Big utility room. The Primary suite is on one end of the home with a private bath garden tub/shower. The other two bedrooms are at the other end of the home with a full bath in the hallway. This home has a new roof and there are 7 solar
Key facts
- Large corner lot
- Covered back deck
- Walk in pantry
Tags
Property features AI
Finance
- Other: Mobile home remains with property
- Financial info: Land lease: $892; Listing terms: Cash or Conventional
- HOA & community: Pilchuck Mobile Home Park (park approved for sale); Park has 18 homes; Senior exemption available; Land lease payment
Exterior
- Parking: Carport
- Security: Tie down foundation system
- Utilities: Public water (Snohomish County PUD); Sewer (City of Snohomish); Power (Snohomish County PUD); Cable (Xfinity); Internet (Comcast); Energy sources: Electric and wood; Water heater located in bedroom closet
- Home design: Manufactured double-wide (Fleetwood model 52/28); One story; Faces south; Vaulted ceilings; Entry and dining and living rooms
- Construction: Wood construction; Composition roof (see remarks); Metal skirting; Concrete ribbon foundation
- Exterior features: Corner lot on a dead-end, paved street; Patio/porch/deck; Landscaped; Outbuilding shed for storage; Wood exterior
Interior
- Kitchen: Dishwasher; Refrigerator; Stove/Range; Walk-in pantry
- Bedrooms: 3 bedrooms
- Flooring: Vinyl; Carpet
- Bathrooms: 2 full bathrooms (2 tubs, 2 showers)
- Heating & cooling: Forced air heating; No central cooling
- Interior features: Fireplace (wood burning); Water heater (electric)
- Laundry & utility: Washer and dryer; Utility room
Neighborhood map
What this means for you Summary
Snapshot
- This is a 3-bed/2.0-bath manufactured listed at $163k.
Deal economics
- At list price, monthly cash flow is $887 ($11k/yr) — positive.
- The deal already cash-flows at list — no discount required.
- Meets the 1% rule at list price ($2k rent vs $163k).
- Recommended offer: $158k (3.0% below list) — sets the bar for market timing.
- Cap rate 12.8% vs local median 2.3% in Snohomish — top-decile yield for the area; either an underpriced asset or a hidden risk that comps aren't pricing in. Stress-test before assuming the spread holds.
Location & tenants
- Location reads 78/100 on livability (#120 in WA, #2,426 nationally) — a middle-class / working-renter tenant base. Strengths: health & safety A+, housing A, commute A-; Watch: amenities F, cost of living F.
- Snohomish School District (suburban): math 58% / reading 69% proficiency, ranked #25 of 291 in WA (top 9%) — acceptable for families but not a draw, mixed tenant base, ~2y average lease; only 18% free/reduced lunch — higher-income household profile.
- Zoned schools: Dutch Hill Elementary (653 students, 18% FRL); Centennial Middle School (720 students, 28% FRL); Snohomish High School (1,565 students, 26% FRL).
- Market conditions: Rents rising fast (+8.8%/yr); 245 active listings in the ZIP; 10 comparable units currently listed for rent nearby; rentals at typical pace (median 19d on market — plan ~3-4 weeks tenant-placement turnaround); high-income renter base; 3,982 units permitted in Snohomish County in 2024 (1,492 in 5+ unit buildings).
Forward outlook
- Local home prices are declining (-3.0%/yr); year-one equity from $1k of loan paydown is wiped out by about $5k of value loss. Plan a longer hold.
- Snohomish County population projected at +30% by 2050 — long-run rental-demand tailwind backs the buy-and-hold thesis.
- At projected returns (-3.0% appreciation + 8.0% rent growth), your $46k cash investment doubles in ~5 years — after that, you're playing with house money.
Negotiation context
- It's been on market 34 days — a 3% lower offer ($158k) is reasonable based on typical stale-listing flexibility.
Questions for the listing agent
- It's been on market 34 days. Have you received any prior offers? Is the seller open to a 3% concession, seller financing, or rate buy-down credit?
- Is there a deadline driving the sale (1031 exchange, divorce, estate, relocation)? That informs how much negotiation room exists.
- Schools are A-rated — typically a magnet for longer-tenancy family renters. What's the average tenant stay here, and is there a school-zone premium baked into asking?
- What's the average days-on-market for RENTAL listings here right now (not sales)? A rising rental-DOM trend means longer vacancies and softer asking-rent achievability than the comps imply.
- What's the recent tenant-quality profile in this submarket — average credit score on applications, eviction rate, late-payment / NSF rate, and stable-employment percentage? A property-management company in the area should have these aggregated.
- How much new for-sale + rental construction is in the pipeline within 1–3 miles? Heavy new supply typically softens prices + rents 12–24 months out; constrained supply supports both.
Investment metrics
- 1% rule
- 1.43% ✓
- Cap rate
- 12.82%
- Cash-on-cash
- 23.32%
- DSCR
- 2.04
- GRM
- 5.8
CMA / ARV
No comps found within radius.
Projected returns pro-forma
-3.0% appreciation · 8.0% rent growth · sell at horizon
- IRR
- 21.4%
- Equity multiple
- 1.93×
- Total profit
- $42,327
- Equity at exit
- $24,304
- IRR
- 32.5%
- Equity multiple
- 4.62×
- Total profit
- $165,362
- Equity at exit
- $14,093
Cash invested: $45,640 (down + closing). Projections, not guarantees.
Landlord ↔ Tenant lean methodology
- Overall (STATE)
- 28 Tenant-Leaning
- State Washington
- 28 Tenant-Leaning · D+8
- County
- — inherits STATE
- City
- — inherits STATE
ZIP-level market 98290
- Rents YoY
- 8.8%
- Active inventory
- 245
- Price-to-rent
- 5.8×
Monthly cashflow live
- Estimated rent
- $2,330 high interval (Pro) →
- Mortgage (P&I)
- −$855
- Tax from tax record
- −$31 /mo · $371/yr
- Insurance
- −$68
- HOA
- −$0
- Vacancy / Maint / Mgmt
- −$489
- Net cashflow
- $887
Break-even live
Sensitivity live
| Price | -10% $979 | -5% $933 | +0% $887 | +5% $841 | +10% $795 |
|---|---|---|---|---|---|
| Rent | -10% $703 | -5% $795 | +0% $887 | +5% $979 | +10% $1,071 |
| Rate | -1.0pp $969 | -0.5pp $929 | base $887 | +0.5pp $845 | +1.0pp $802 |
UW: 25.0% down · 7.5% · 30yr · 1.5% tax · 5.0% vac · 8.0% maint · 8.0% mgmt
Financing live
Cash to close
- Down payment
- $40,750
- Closing costs
- $4,890
- Reserves months
- —
- Total cash needed
- —
Loan-product check · same deal, 3 products live
Conventional
25% down · 7.5% · 30yr
- Down + closing
- —
- Monthly P&I
- —
- Monthly cashflow
- —
- DSCR
- —
- Eligible?
- —
Personal DTI + credit; lowest rate.
DSCR
20% down · 8.5% · 30yr
- Down + closing
- —
- Monthly P&I
- —
- Monthly cashflow
- —
- DSCR
- —
- Eligible?
- —
No personal income docs; deal must DSCR.
Hard money
10% down · 12.0% · 12mo
- Down + closing
- —
- Monthly P&I
- —
- Monthly cashflow
- —
- DSCR
- —
- Eligible?
- —
Short-term bridge; refi at stabilization.
Rent comps 10 comps
| Address | Beds | Baths | Sqft | Rent | $/sqft | DOM | Units | Dist |
|---|---|---|---|---|---|---|---|---|
| 218 Maple Ave Apt 1 Snohomish, WA | 2.0 | 1.0 | 1000 | $1,845 | $1.84 | 16d | 1 | 0.41mi |
| 407 1st St Snohomish, WA | 2.0 | 2.0 | 1025 | $2,150 | $2.10 | 26d | 1 | 0.45mi |
| 514 Maple Ave Snohomish, WA | 2.0 | 1.0 | 920 | $1,650 | $1.79 | 45d | 1 | 0.58mi |
| 625 Avenue B Unit B Snohomish, WA | 3.0 | 1.0 | 1232 | $2,995 | $2.43 | 45d | 1 | 0.86mi |
| 625 Avenue B Unit 1 Snohomish, WA | 3.0 | 1.0 | 1232 | $2,495 | $2.03 | 7d | 1 | 0.86mi |
| 1209 10th St Snohomish, WA | 3.0 | 2.0 | 1280 | $2,495 | $1.95 | 5d | 1 | 1.09mi |
| 1209 10th St Unit A203 Snohomish, WA | 3.0 | 2.0 | 1280 | $2,495 | $1.95 | 7d | 1 | 1.09mi |
| 1209 10th St Snohomish, WA | 2.0 | 2.0 | 1100 | $2,295 | $2.09 | 1d | 1 | 1.09mi |
| 1209 10th St Snohomish, WA | 3.0 | 2.0 | 1100 | $2,495 | $2.27 | 45d | 1 | 1.09mi |
| 1101 Avenue D Snohomish, WA | 1.0–2.0 | 1.0–2.0 | 859 | $2,000 | $2.33 | 18d | 2 | 1.18mi |
Listing history 15 events
-
2026-06-21days on market $163,000 Active 34 DOM
-
2026-06-18days on market $163,000 Active 31 DOM
-
2026-06-17days on market $163,000 Active 30 DOM
-
2026-06-16days on market $163,000 Active 29 DOM
-
2026-06-15days on market $163,000 Active 28 DOM
-
2026-06-13days on market $163,000 Active 26 DOM
-
2026-06-09days on market $163,000 Active 22 DOM
-
2026-06-08days on market $163,000 Active 21 DOM
-
2026-06-07days on market $163,000 Active 20 DOM
-
2026-06-04days on market $163,000 Active 17 DOM
-
2026-06-03days on market $163,000 Active 16 DOM
-
2026-06-02days on market $163,000 Active 15 DOM
-
2026-06-01days on market $163,000 Active 14 DOM
-
2026-05-31days on market $163,000 Active 13 DOM
-
2026-05-18$163,000 Active
ⓘ Source: listings_history table (triggers on properties + properties_extension) + one-shot
backfill from property_details.listing_events for pre-trigger history.
Tax reassessment forecast WA · Resets to sale price
- Current annual tax
- $371 · $31/mo
- Projected year-2 tax
- $1,597 · $133/mo
- Expected delta
- +$1,226/yr (+$102/mo · 330.6%)
ⓘ Screening estimate from a state-policy table — verify with the county assessor before closing.
Nearby sold comps map
Loading sold comps map…
Walkable amenities ~0.75 mi
Loading nearby amenities…
Taxation est. · year 1
- Rental income
- $27,960
- − Mortgage interest
- −$9,131
- − Property taxes
- −$371
- − Insurance
- −$815
- − Repairs & maintenance
- −$2,237
- − Management
- −$2,237
- − Depreciation
- −$4,742
- Taxable income
- $8,428
- Est. tax owed @ 24.0%
- −$2,023
- After-tax cash flow
- $8,622/yr
For passive investors: Depreciation is non-cash, so a rental often shows a tax loss while cash-flowing — sheltering income. Rental losses are passive: they offset passive income freely, and up to $25,000/yr can offset ordinary (W-2) income if you actively participate and your MAGI is under $100k (phasing out to $0 by $150k); unused losses carry forward. On sale, claimed depreciation is recaptured at up to 25%, and gains may owe capital-gains tax (a 1031 exchange can defer both). Figures are a year-1 estimate at your 24.0% rate — not tax advice; consult a CPA.
Schools (NCES district)
- District
- Snohomish School District
- NCES district ID
- 5308020
- Math proficiency
- 58% ▬ 0.00%
- Reading proficiency
- 69% ▲ 1.00%
- Median HH income
- $89,715
- Composite
- 59.21/100
- National rank
- #1934
- State rank
- #25 of 291 in WA
Livability — Snohomish
- Score
- 78/100
- State rank
- #120
- US rank
- #2426
Category grades
Schools grade is shown separately in the Schools card above.
Census & demographics
- County
- Snohomish County · 786,756 people
- City population
- 39,826
- Metro
- Seattle-Tacoma-Bellevue, WA
- Population (ZIP)
- 39,826
- Household income
- $132,973
- Rent vs Own
- Severe rent burden
- 522.0
Population outlook (Snohomish County) Hauer SSP2
- Today (2025)
- 899,800 people
- By 2030
- 960,975 · +6.8%
- By 2040
- 1,074,447 · +19.4%
- By 2050
- 1,171,954 · +30.2%
- By 2075
- 1,384,849 · +53.9%
- By 2100
- 1,497,296 · +66.4%
Race, ethnicity, and origin ACS 2023
- Neighborhood character
- Predominantly White (82%)
- Race & ethnicity
- White 82% Two or more races 9% Hispanic / Latino 7% Asian 3%
- Hispanic origin (detail)
- Mexican 5%
- Common ancestry
- Portuguese 7% Lithuanian 5% Italian 3%
- Foreign-born
- 7% · Canada, China
- Languages at home
- 91% English-only · Spanish 5% Other Asian/Pacific 1% Russian/Polish/Slavic 1%
Political lean MEDSL · Snohomish
- 2024 margin
- D (+19.0) · D 57.8% · R 38.9% · Other 3.3%
- 2008→2024 swing
- +0.1pp no change · 2008: 18.9pp · 2024: 19.0pp
- All cycles
- 2024: D+19.0 2020: D+20.6 2016: D+16.6 2012: D+16.2 2008: D+18.9
Not yet ingested
- Civics
- —
Market trends
- HPI YoY
- ▼ -751.01%
- Current HPI
- 338.6319
- Rent YoY
- ▲ 8.82%
- Metro
- Seattle-Tacoma-Bellevue, WA
- State GDP YoY
- ▲ 4.65%
- F500 in state
- 22
Industry mix (Fortune 500 HQ in WA)
| Industry | F500 HQs | Revenue |
|---|---|---|
| Retail | 2 | $269B |
|
||
| Technology / Retail | 1 | $638B |
|
||
| Technology | 1 | $245B |
|
||
| Telecommunications | 1 | $38B |
|
||
| Food / Beverage | 1 | $36B |
|
||
| Automotive / Trucks | 1 | $34B |
|
||
Price history
1 event — show timeline
- 2026-05-18 Listed $163,000 NWMLS as Distributed by MLS Grid
Cash-flow waterfall
monthlySold comps — $/sqft
last 12 mo · ≤1 miLoading sold comps…