727 Schwartz St · Houston, TX
Flood risk 1/10 · Minimal
- FEMA flood zone
- X (unshaded)
- Chance of flooding over 30 yrs
- 0.0%
- Est. flood insurance / yr
- $507 – $1,088
Fire risk 1/10 · Minimal
- Est. fire insurance / yr
- $1,222 – $2,270
Heat risk 9/10 · Severe
- Hot days now (above 109°F)
- 7 days/yr
- Hot days in 30 yrs
- 24 days/yr
Wind risk 9/10 · Severe
- Chance of severe wind over 30 yrs
- 99.0%
Air-quality risk 3/10 · Minor
- Unhealthy air days now
- 2 days/yr
- Unhealthy air days in 30 yrs
- 3 days/yr
Risk factors via First Street. Map © Google.
Why this score? — see what drove the C- grade
The composite is a weighted blend of 9 inputs, each scored 0–100. Each bar is that input's sub-score; the figure is the points it added to the 100-point composite (weight × sub-score).
- ARV discount +13.7/15.0
- Appreciation +10.0/10.0
- Cash flow +8.1/30.0
- 1% rule +3.9/10.0
- Livability +3.7/5.0
- Rent growth +3.6/5.0
- Schools +2.7/10.0
- Condition / age +2.5/5.0
- DSCR +2.2/10.0
$355,000
🖨 Deal sheet (PDF) 📄 Offer letter ✓ Due diligence
Listing remarks
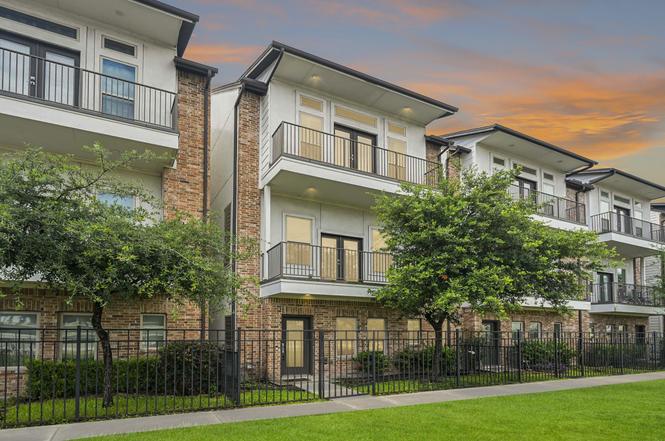
Stunning property nestled in the highly desirable EaDO community. Comes with granite countertops and a large walk-in pantry. Along with a beautiful island that illuminates the open concept kitchen and spacious living room with high ceilings. The property comes with TWO COVERED BALCONIES to utilize at your leisure. The spacious primary bedroom comes with a free-standing soaking tub, a walk-in shower and two walk in closets. No yard maintenance is required for the property. A beautiful park and DOG PARK are right down the street for the community to enjoy. Take advantage of living in one of the most convenient areas around in EaDO (East of Downtown) with numerous dining, shopping and entertai
Key facts
- Covered balconies
- Walk in closets
- Walk-in shower
Tags
Property features AI
Finance
- Other: Seller disclosure available
- HOA & community: Clark Landing Owners Association (gated community); Annual association fee for common areas
Exterior
- Parking: Attached garage (2 spaces); Attached parking
- Security: Leased security system; Controlled access; Smoke detectors
- Utilities: Public water; Public sewer
- Home design: Residential property; Faces north; Built in 2016; Slab foundation
- Construction: Brick and cement siding construction; Composition roof
- Exterior features: Balcony; Fully fenced yard; Side yard
Interior
- Kitchen: Dishwasher; Electric oven; Disposal; Wine refrigerator
- Bedrooms: Primary bedroom (third level); Bedroom (third level); Bedroom (first level)
- Flooring: Carpet; Engineered hardwood; Tile; Wood
- Bathrooms: 3 full bathrooms; 1 half bathroom
- Heating & cooling: Central heating (gas, zoned); Central air conditioning (electric, zoned); Radiant attic barrier; Insulation
- Interior features: Entrance foyer; Kitchen island; Kitchen/Family room combo; Kitchen/Dining combo; Living/Dining room; Bath in primary bedroom; Double vanity; Soaking tub; Separate shower; Tub/shower combination; Walk-in pantry; Multiple staircases; Wired for sound; Window treatments; Low emissivity windows; Window coverings
- Laundry & utility: Washer hookup; Electric dryer hookup; Gas dryer hookup; Utility room (third level)
Neighborhood map
What this means for you Summary
Snapshot
- This is a 3-bed/3.5-bath single-family listed at $355k.
Deal economics
- At list price, monthly cash flow is $-340 ($-4k/yr) — negative.
- To cash-flow at today's rent, offer at most $295k (16.9% below list).
- To meet the 1% rule (rent ≥ 1% of price), the offer needs to be $316k (10.9% below list).
- Recommended offer: $295k (16.9% below list) — sets the bar for cash-flow.
- Cap rate 5.1% vs local median 3.2% in Houston — top-decile yield for the area; either an underpriced asset or a hidden risk that comps aren't pricing in. Stress-test before assuming the spread holds.
Location & tenants
- Location reads 74/100 on livability (#184 in TX, #4,771 nationally) — a middle-class / working-renter tenant base. Strengths: amenities A+, cost of living A+, housing A+; Watch: crime F.
- Houston ISD (urban): math 27% / reading 35% proficiency, ranked #593 of 826 in TX (top 72%) — families likely to look elsewhere, expect single-tenant / working-renter base with shorter leases; 71% free/reduced lunch — lower-income household profile, screen leases tightly.
- Zoned schools: Bruce El (math 12% / reading 22%, grade F, #3,836 of 4,322 statewide, top 91%, 307 students, 98% FRL); Mcreynolds Middle (math 10% / reading 17%, grade F, #1,602 of 1,662 statewide, top 97%, 398 students, 98% FRL); Wheatley H S (math 17% / reading 19%, grade F, #1,445 of 1,632 statewide, top 89%, 643 students, 95% FRL) — zoned schools average 97% FRL vs 71% district-wide (26 pts higher); higher-poverty schools than district average — tighter screening recommended.
- Zoned-school proficiency averages 16% at this address vs 31% district-wide (-15 pts) — the specific schools serving this property underperform the Houston ISD average; the district grade overstates school quality for this exact location.
- Market conditions: Rents rising fast (+4.3%/yr); 339 active listings in the ZIP; 40 comparable units currently listed for rent nearby; rentals leasing fast (median 14d on market — plan ~1-2 weeks tenant-placement turnaround); 29,883 units permitted in Harris County in 2024 (8,621 in 5+ unit buildings).
- At $3,165/mo this rent would consume 76% of the median local household income ($50k/yr) (locally 969% of renters already pay >50% of income on rent) — very limited rent-growth headroom before tenants either downsize or default.
Forward outlook
- In year one you build about $38k of equity ($2k loan paydown + $36k appreciation (10.0% local appreciation)).
- Harris County population projected at +47% by 2050 — long-run rental-demand tailwind backs the buy-and-hold thesis.
- By year 2, paydown + projected appreciation supports a ~$61k cash-out refi (75% LTV) — recoverable capital for the next deal without selling this one.
Negotiation context
- Only 2 days on market — expect competitive offers; lowballing is unlikely to land.
- 10 sale attempts since 9y ago with the ask held roughly flat each time — persistent listings suggest the price (not the market) is what's stuck; bring a comps-based counter.
Risks & watch-outs
- Climate carrying-cost: severe wind risk, 99% chance of damaging wind over 30y; extreme-heat days projected 7→24/yr by 2055 (HVAC capex compounding) — expect insurance premiums to compound above CPI over the hold.
Questions for the listing agent
- What do current leases actually rent for vs. the listed asking? Can we see a recent rent roll and the last 12 months of T-12 income?
- What does the HOA fee cover, when was the last increase, and are there any pending special assessments or reserve-fund shortfalls?
- Is there a deadline driving the sale (1031 exchange, divorce, estate, relocation)? That informs how much negotiation room exists.
- Schools are D-rated, which usually means shorter tenancies and higher turnover. Who's the typical renter profile here, and what's been the actual vacancy rate?
- Crime grade is F in this area — have there been break-ins, vandalism, or insurance claims at this property in the last 3 years? What carrier currently insures it and at what premium?
- What's the average days-on-market for RENTAL listings here right now (not sales)? A rising rental-DOM trend means longer vacancies and softer asking-rent achievability than the comps imply.
- What's the recent tenant-quality profile in this submarket — average credit score on applications, eviction rate, late-payment / NSF rate, and stable-employment percentage? A property-management company in the area should have these aggregated.
- How much new for-sale + rental construction is in the pipeline within 1–3 miles? Heavy new supply typically softens prices + rents 12–24 months out; constrained supply supports both.
Investment metrics
- 1% rule
- 0.89% ✗
- Cap rate
- 5.14%
- Cash-on-cash
- -4.11%
- DSCR
- 0.82
- GRM
- 9.3
CMA / ARV
- ARV (median comp)
- $411,718
- List price
- $355,000
- Delta
- -13.78%
- Verdict
- UNDERPRICED
- Comps
- 20 within 1.0 mi
Show comp detail 12 sales within ~0.75 mi
| Address | Dist | Beds/Ba | Sqft | Sold | Price | $/sf | Match |
|---|---|---|---|---|---|---|---|
| 3209 Baer St Unit B | 0.25mi | 3/3.5 | 1,996 (-2%) | 1mo | $464,900 | $233 | 84 |
| 3209 Baer St Unit A | 0.25mi | 3/3.5 | 1,990 (-2%) | 1mo | $464,900 | $234 | 84 |
| 3306 Cline St | 0.31mi | 3/3.5 | 2,154 (+6%) | 1mo | $390,000 | $181 | 75 |
| 411 Grove St Unit C | 0.28mi | 3/2.5 | 1,903 (-6%) | 2mo | $375,000 | $197 | 70 |
| 2808 Mills St | 0.65mi | 3/3.5 | 2,039 (+0%) | 1mo | $359,000 | $176 | 68 |
| 2706 Fox St | 0.62mi | 3/3.5 | 2,012 (-1%) | 1mo | $499,900 | $248 | 68 |
| 2804 Mills St | 0.67mi | 3/3.5 | 2,039 (+0%) | 1mo | $379,000 | $186 | 68 |
| 3415 Stonewall St | 0.53mi | 3/2.5 | 1,969 (-3%) | 1mo | $369,000 | $187 | 65 |
| 3409 Stonewall St | 0.53mi | 3/2.5 | 1,969 (-3%) | 1mo | $349,900 | $178 | 65 |
| 2814 Mills St | 0.67mi | 3/3.5 | 1,972 (-3%) | 1mo | $389,900 | $198 | 63 |
| 2812 Mills St | 0.66mi | 3/3.5 | 1,972 (-3%) | 1mo | $369,900 | $188 | 63 |
| 2321 Ann St | 0.51mi | 3/3.0 | 2,197 (+8%) | 1mo | $339,000 | $154 | 60 |
Match score weights: distance 35% · size 25% · config 20% · recency 20%. Top-matched comps best support the ARV.
Projected returns pro-forma
10.0% appreciation · 4.27% rent growth · sell at horizon
- IRR
- 21.8%
- Equity multiple
- 2.77×
- Total profit
- $176,041
- Equity at exit
- $319,812
- IRR
- 20.0%
- Equity multiple
- 6.48×
- Total profit
- $544,782
- Equity at exit
- $689,687
Cash invested: $99,400 (down + closing). Projections, not guarantees.
Landlord ↔ Tenant lean methodology
- Overall (STATE)
- 87 Strongly Landlord-Friendly
- State Texas
- 87 Strongly Landlord-Friendly · R+5
- County
- — inherits STATE
- City
- — inherits STATE
ZIP-level market 77020
- Home prices YoY
- 29.1%
- Rents YoY
- 4.3%
- Active inventory
- 339
- Price-to-rent
- 9.3×
Monthly cashflow live
- Estimated rent
- $3,165 high interval (Pro) →
- Mortgage (P&I)
- −$1,862
- Tax from tax record
- −$731 /mo · $8,772/yr
- Insurance
- −$148
- HOA
- −$100
- Vacancy / Maint / Mgmt
- −$665
- Net cashflow
- $-340
Break-even live
Sensitivity live
| Price | -10% $-139 | -5% $-240 | +0% $-340 | +5% $-441 | +10% $-541 |
|---|---|---|---|---|---|
| Rent | -10% $-590 | -5% $-465 | +0% $-340 | +5% $-215 | +10% $-90 |
| Rate | -1.0pp $-162 | -0.5pp $-250 | base $-340 | +0.5pp $-432 | +1.0pp $-526 |
UW: 25.0% down · 7.5% · 30yr · 1.5% tax · 5.0% vac · 8.0% maint · 8.0% mgmt
Financing live
Cash to close
- Down payment
- $88,750
- Closing costs
- $10,650
- Reserves months
- —
- Total cash needed
- —
Loan-product check · same deal, 3 products live
Conventional
25% down · 7.5% · 30yr
- Down + closing
- —
- Monthly P&I
- —
- Monthly cashflow
- —
- DSCR
- —
- Eligible?
- —
Personal DTI + credit; lowest rate.
DSCR
20% down · 8.5% · 30yr
- Down + closing
- —
- Monthly P&I
- —
- Monthly cashflow
- —
- DSCR
- —
- Eligible?
- —
No personal income docs; deal must DSCR.
Hard money
10% down · 12.0% · 12mo
- Down + closing
- —
- Monthly P&I
- —
- Monthly cashflow
- —
- DSCR
- —
- Eligible?
- —
Short-term bridge; refi at stabilization.
Rent comps 40 comps
| Address | Beds | Baths | Sqft | Rent | $/sqft | DOM | Units | Dist |
|---|---|---|---|---|---|---|---|---|
| 2905 Baer St Unit 1047953P Houston, TX | 3.0 | 2.5 | 1991 | $2,922 | $1.47 | 0d | 1 | 0.04mi |
| 611 Sydnor St Houston, TX | 3.0 | 4.0 | 2157 | $2,400 | $1.11 | 45d | 1 | 0.14mi |
| 308 Grove St Houston, TX | 3.0 | 3.0 | 1701 | $2,350 | $1.38 | 9d | 1 | 0.32mi |
| 3410 Baer St Houston, TX | 3.0 | 4.0 | 2040 | $3,500 | $1.72 | 45d | 1 | 0.35mi |
| 3419 Gillespie St Houston, TX | 3.0 | 3.5 | 2168 | $2,300 | $1.06 | 45d | 1 | 0.37mi |
| 1303 Bayou St Unit C Houston, TX | 3.0 | 3.0 | 1869 | $3,200 | $1.71 | 45d | 1 | 0.37mi |
| 1307 Bayou St Unit B Houston, TX | 3.0 | 3.0 | 1814 | $2,400 | $1.32 | 9d | 1 | 0.38mi |
| 1513 Cage St Houston, TX | 3.0 | 2.0 | 1467 | $1,550 | $1.06 | 45d | 1 | 0.58mi |
| 2115 Runnels St Unit 2148 Houston, TX | 3.0 | 2.0 | 1839 | $3,045 | $1.66 | 12d | 1 | 0.61mi |
| 2115 Runnels St Unit 3187 Houston, TX | 3.0 | 2.0 | 1839 | $3,005 | $1.63 | 0d | 1 | 0.61mi |
| 2115 Runnels St Unit 3174 Houston, TX | 3.0 | 2.0 | 1839 | $3,056 | $1.66 | 13d | 1 | 0.61mi |
| 2115 Runnels St Unit 3174 Houston, TX | 3.0 | 2.0 | 1839 | $3,056 | $1.66 | 0d | 1 | 0.61mi |
| 4109 Hare St Unit 1019559P Houston, TX | 4.0 | 2.5 | 1905 | $6,852 | $3.60 | 9d | 1 | 0.69mi |
| 4109 Hare St Unit A Houston, TX | 4.0 | 2.5 | 1913 | $6,950 | $3.63 | 45d | 1 | 0.69mi |
| 2414 East Dr Unit Canal St unit Houston, TX | 3.0 | 3.5 | 2063 | $2,950 | $1.43 | 9d | 1 | 0.80mi |
| 15 N Chenevert St Houston, TX | 2.0 | 1.0–2.0 | 1351 | $4,000 | $2.96 | 0d | 16 | 0.87mi |
| 1222 Upton St Houston, TX | 3.0 | 4.0 | 2055 | $2,600 | $1.27 | 45d | 1 | 1.02mi |
| 1475 Texas St Houston, TX | 3.0 | 1.0–2.0 | 1304 | $6,350 | $4.87 | 45d | 28 | 1.26mi |
| 1625 N Main St Houston, TX | 3.0 | 1.0–3.0 | 994 | $2,354 | $2.37 | 0d | 41 | 1.26mi |
| 4706 Hershe St Houston, TX | 3.0 | 2.5 | 2283 | $3,300 | $1.45 | 45d | 1 | 1.29mi |
| 409 Travis St Unit 424 Houston, TX | 2.0 | 2.0 | 1495 | $3,292 | $2.20 | 9d | 1 | 1.34mi |
| 409 Travis St Unit 2187 Houston, TX | 2.0 | 2.0 | 1495 | $3,317 | $2.22 | 0d | 1 | 1.34mi |
| 409 Travis St Unit 425 Houston, TX | 2.0 | 2.0 | 1495 | $3,276 | $2.19 | 0d | 1 | 1.34mi |
| 409 Travis St Unit 432 Houston, TX | 2.0 | 2.0 | 1495 | $3,316 | $2.22 | 12d | 1 | 1.34mi |
| 2504 Rusk St Unit 1563174P Houston, TX | 2.0 | 2.0 | 1819 | $4,036 | $2.22 | 4d | 1 | 1.35mi |
| 4712 Rawley St Unit a Houston, TX | 3.0 | 2.0 | 1501 | $2,070 | $1.38 | 22d | 1 | 1.35mi |
| 4712 Rawley St Unit B Houston, TX | 3.0 | 2.5 | 1501 | $2,045 | $1.36 | 22d | 1 | 1.35mi |
| 413 Travis St Houston, TX | 2.0 | 2.0 | 1495 | $4,000 | $2.68 | 45d | 1 | 1.36mi |
| 915 Texas Ave Unit 420 Houston, TX | 3.0 | 2.0 | 2366 | $4,655 | $1.97 | 20d | 1 | 1.39mi |
| 915 Texas Ave Unit 420 Houston, TX | 3.0 | 2.0 | 2366 | $4,655 | $1.97 | 45d | 1 | 1.39mi |
| 414 Milam St Houston, TX | 2.0 | 2.5 | 1585 | $3,845 | $2.43 | 23d | 1 | 1.39mi |
| 414 Milam St Ph 2-4602 Houston, TX | 2.0 | 2.0 | 2158 | $8,990 | $4.17 | 45d | 1 | 1.39mi |
| 414 Milam St Unit B1-2003 Houston, TX | 2.0 | 2.0 | 1585 | $4,513 | $2.85 | 45d | 1 | 1.39mi |
| 2816 Rusk St Houston, TX | 3.0 | 3.5 | 2107 | $2,800 | $1.33 | 45d | 1 | 1.39mi |
| 909 Texas Ave Houston, TX | 2.0 | 1.0–2.0 | 1262 | $3,129 | $2.48 | 3d | 36 | 1.40mi |
| 1757 Walker St Houston, TX | 2.0 | 2.0 | 1575 | $4,350 | $2.76 | 26d | 1 | 1.40mi |
| 808 Crawford St Houston, TX | 1.0–3.0 | 1.0–3.5 | 1740 | $12,645 | $7.27 | 0d | 27 | 1.41mi |
| 414 Milam St Unit 422 Houston, TX | 2.0 | 2.0 | 1585 | $3,833 | $2.42 | 9d | 1 | 1.42mi |
| 414 Milam St Unit 2148 Houston, TX | 2.0 | 2.0 | 1585 | $3,858 | $2.43 | 0d | 1 | 1.42mi |
| 414 Milam St Unit 437 Houston, TX | 2.0 | 2.0 | 1585 | $3,857 | $2.43 | 12d | 1 | 1.42mi |
HOA detail
- Monthly dues
- $100 · $1,200/yr
Listing history 38 events
-
2026-06-21pricedays on market $355,000 Active 2 DOM
-
2026-06-07days on market $354,990 Active 366 DOM
-
2026-06-04pricedays on market $354,990 Active 363 DOM
-
2026-06-01days on market $364,990 Active 360 DOM
-
2026-05-31days on market $364,990 Active 359 DOM
-
2026-01-16price $364,990 960-char remark
-
2025-08-23price $374,990 960-char remark
-
2025-06-06$399,990 Active 960-char remark
-
2025-06-01historical
-
2025-05-09$399,990 Active
-
2025-05-09historical
-
2025-03-19price $399,990
-
2024-12-11price $409,990
-
2024-11-08$410,000 Active
-
2024-11-03historical
-
2024-11-02historical
-
2024-06-25$424,990 Active
-
2024-06-25historical
-
2024-05-06$434,990 Active
-
2024-04-25historical $2,448
-
2024-04-10historical $2,448
-
2024-03-21$2,448
-
2024-03-16historical $2,548
-
2024-03-13price $2,548
-
2024-02-02price $2,598
-
2024-01-31price $2,598
-
2024-01-20price $2,735
-
2024-01-18price $2,735
-
2023-12-19price $2,900
-
2023-12-18price $2,900
-
2023-12-07$3,069
-
2023-12-05$3,069
-
2017-08-21soldstatus Sold
-
2017-07-05status Pending
-
2017-06-24price $314,000
-
2017-05-27price $319,000
-
2017-05-22price $329,000
-
2017-01-29$339,000 Active
ⓘ Source: listings_history table (triggers on properties + properties_extension) + one-shot
backfill from property_details.listing_events for pre-trigger history.
Tax reassessment forecast TX · Resets to sale price
- Current annual tax
- $8,772 · $731/mo
- Projected year-2 tax
- $8,772 · $731/mo
- Expected delta
- $0/yr ($0/mo · 0.0%)
ⓘ Screening estimate from a state-policy table — verify with the county assessor before closing.
Climate risk First Street
- Flood 1/10 Low FEMA zone X (unshaded) · 0% chance over 30 yrs
- Wildfire 1/10 Low
- Heat 9/10 Extreme 7 d/yr ≥109°F today · 24 d/yr by 30 yrs out
- Wind 9/10 Extreme 99% chance of damaging wind over 30 yrs
- Air quality 3/10 Moderate 2 unhealthy d/yr today · 3 by 30 yrs out
Nearby sold comps map
Loading sold comps map…
Walkable amenities ~0.75 mi
Loading nearby amenities…
Taxation est. · year 1
- Rental income
- $37,977
- − Mortgage interest
- −$19,886
- − Property taxes
- −$8,772
- − Insurance
- −$1,775
- − Repairs & maintenance
- −$3,038
- − Management
- −$3,038
- − HOA
- −$1,200
- − Depreciation
- −$10,327
- Taxable loss
- −$10,059
- Est. tax savings @ 24.0%
- +$2,414
- After-tax cash flow
- $-1,671/yr
For passive investors: Depreciation is non-cash, so a rental often shows a tax loss while cash-flowing — sheltering income. Rental losses are passive: they offset passive income freely, and up to $25,000/yr can offset ordinary (W-2) income if you actively participate and your MAGI is under $100k (phasing out to $0 by $150k); unused losses carry forward. On sale, claimed depreciation is recaptured at up to 25%, and gains may owe capital-gains tax (a 1031 exchange can defer both). Figures are a year-1 estimate at your 24.0% rate — not tax advice; consult a CPA.
Schools (NCES district)
- District
- Houston ISD
- NCES district ID
- 4823640
- Math proficiency
- 27% ▼ -18.00%
- Reading proficiency
- 35% ▼ -6.00%
- Median HH income
- $46,054
- Composite
- 26.63/100
- National rank
- #7173
- State rank
- #593 of 826 in TX
Livability — Houston
- Score
- 74/100
- State rank
- #184
- US rank
- #4771
Category grades
Schools grade is shown separately in the Schools card above.
Census & demographics
- Census place
- Houston, TX
- County
- Harris County · 4,702,590 people
- City population
- 3,226,434
- Metro
- Houston-The Woodlands-Sugar Land, TX
- Population (ZIP)
- 23,686
- Household income
- $50,119
- Rent vs Own
- Severe rent burden
- 969.0
Population outlook (Harris County) Hauer SSP2
- Today (2025)
- 5,571,493 people
- By 2030
- 6,089,821 · +9.3%
- By 2040
- 7,142,806 · +28.2%
- By 2050
- 8,185,864 · +46.9%
- By 2075
- 10,574,329 · +89.8%
- By 2100
- 12,109,958 · +117.4%
Race, ethnicity, and origin ACS 2023
- Neighborhood character
- Predominantly Hispanic (69%)
- Race & ethnicity
- Hispanic / Latino 69% Black 24% Two or more races 22% White 5% Asian 1%
- Hispanic origin (detail)
- Mexican 60%
- Common ancestry
- Swiss 1%
- Foreign-born
- 23% · Canada
- Languages at home
- 39% English-only · Spanish 59% Other Indo-European 1%
Political lean MEDSL · Harris
- 2024 margin
- Lean D (+5.5) · D 52.0% · R 46.4% · Other 1.6%
- 2008→2024 swing
- +3.9pp toward D · 2008: 1.6pp · 2024: 5.5pp
- All cycles
- 2024: D+5.5 2020: D+13.3 2016: D+12.4 2012: D+0.1 2008: D+1.6
Not yet ingested
- Civics
- —
Market trends
- HPI YoY
- ▲ 55.64%
- Current HPI
- 246.5578
- Rent YoY
- ▲ 4.27%
- Metro
- Houston-The Woodlands-Sugar Land, TX
- State GDP YoY
- ▲ 3.95%
- F500 in state
- 110
Industry mix (Fortune 500 HQ in TX)
| Industry | F500 HQs | Revenue |
|---|---|---|
| Energy | 16 | $1,198B |
|
||
| Technology | 5 | $198B |
|
||
| Engineering / Construction | 4 | $72B |
|
||
| Energy Services | 3 | $60B |
|
||
| Utilities | 3 | $41B |
|
||
| Healthcare | 2 | $330B |
|
||
Price history
+4.7% since first listed36 events — show timeline
- 2026-06-19 Listed $355,000 HARMLS
- 2026-06-07 Listing Removed — HARMLS
- 2026-06-04 Price Changed $354,990 HARMLS
- 2026-01-16 Price Changed $364,990 HARMLS
- 2025-08-23 Price Changed $374,990 HARMLS
- 2025-06-06 Listed $399,990 HARMLS
- 2025-06-01 Listing Removed — HARMLS
- 2025-05-09 Listing Removed — HARMLS
- 2025-05-09 Listed $399,990 HARMLS
- 2025-03-19 Price Changed $399,990 HARMLS
- 2024-12-11 Price Changed $409,990 HARMLS
- 2024-11-08 Listed $410,000 HARMLS
- 2024-11-03 Coming Soon — HARMLS
- 2024-11-02 Listing Removed — HARMLS
- 2024-06-25 Listing Removed — HARMLS
- 2024-06-25 Listed $424,990 HARMLS
- 2024-05-06 Listed $434,990 HARMLS
- 2024-04-25 Rental Removed $2,448 RENT.
- 2024-04-10 Rental Removed $2,448 APPFOLIO
- 2024-03-21 Listed for Rent $2,448 RENT.
- 2024-03-16 Rental Removed $2,548 RENT.
- 2024-03-13 Price Changed $2,548 APPFOLIO
- 2024-02-02 Price Changed $2,598 APPFOLIO
- 2024-01-31 Price Changed $2,598 RENT.
- 2024-01-20 Price Changed $2,735 APPFOLIO
- 2024-01-18 Price Changed $2,735 RENT.
- 2023-12-19 Price Changed $2,900 APPFOLIO
- 2023-12-18 Price Changed $2,900 RENT.
- 2023-12-07 Listed for Rent $3,069 APPFOLIO
- 2023-12-05 Listed for Rent $3,069 RENT.
- 2017-08-21 Sold (MLS) — HARMLS
- 2017-07-05 Pending — HARMLS
- 2017-06-24 Price Changed $314,000 HARMLS
- 2017-05-27 Price Changed $319,000 HARMLS
- 2017-05-22 Price Changed $329,000 HARMLS
- 2017-01-29 Listed $339,000 HARMLS
Property tax history
+30.5%/yrLatest (2025): $8,772 · -3.6% YoY. Source: county tax records.
Cash-flow waterfall
monthlySold comps — $/sqft
last 12 mo · ≤1 miLoading sold comps…